 🏗️ New Construction
Fleetwood U86 Holiday Village Plan · Nashville-Davidson metropolitan government (balance), TN
Flood risk No data
- FEMA flood zone
- —
- Chance of flooding over 30 yrs
- —
- Est. flood insurance / yr
- —
Fire risk No data
- Est. fire insurance / yr
- —
Heat risk No data
- Hot days now (above threshold)
- —
- Hot days in 30 yrs
- —
Wind risk No data
- Chance of severe wind over 30 yrs
- —
Air-quality risk No data
- Unhealthy air days now
- —
- Unhealthy air days in 30 yrs
- —
Risk factors via First Street. Map © Google.
Why this score? — see what drove the C- grade
The composite is a weighted blend of 9 inputs, each scored 0–100. Each bar is that input's sub-score; the figure is the points it added to the 100-point composite (weight × sub-score).
- Cash flow +23.7/30.0
- DSCR +7.6/10.0
- ARV discount +7.5/15.0
- 1% rule +6.2/10.0
- Rent growth +2.8/5.0
- Livability +2.5/5.0
- Condition / age +2.5/5.0
- Schools +1.4/10.0
- Appreciation +0.0/10.0
$145,000
🖨 Deal sheet 📄 Offer letter ✓ Due diligence
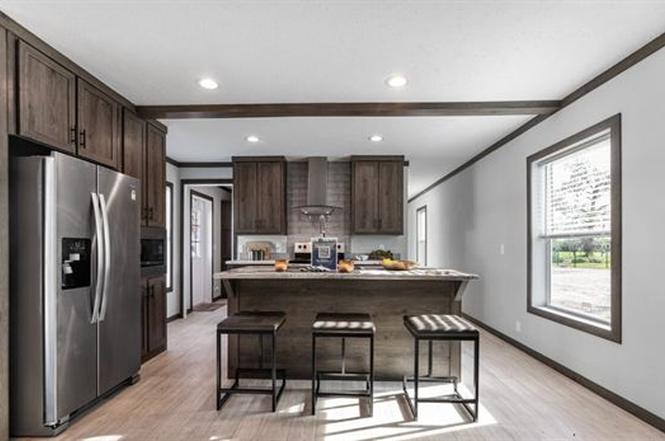
Listing remarks
Holiday Village in Nashville, Tennessee is a peaceful, yet vibrant community, ideal for people dreaming of owning a home in a thriving area of Tennessee. Our 3-bedroom, 2-bathroom homes feature spacious open-concept floor plans, Energy-Star Certified appliances, and wood kitchen cabinets. Holiday Village, owned and operated by UMH Properties, is a gated community offering a wide variety of amenities, including bus shelters, and playgrounds. Additionally, this Nashville community offers exciting events such as resident appreciation nights, raffles, and seed and fertilizer handouts to jumpstart your landscaping. With our new expansion underway, we invite you to come choose your lot and custom
Key facts
- Listed 106 days
Tags
Property features AI
Finance
- Financial info: Listed as a plan (new construction inventory type); List price $145,000
Exterior
- Utilities: Central air conditioning
- Home design: Plan: Fleetwood U86 Holiday Village; Single-story (plan information)
- Construction: Living area approximately 1,178 (plan)
- Exterior features: Shake roof
Interior
- Bedrooms: 3 bedrooms
- Bathrooms: 2 full bathrooms
- Heating & cooling: Central air
- Interior features: Central air cooling
Neighborhood map
What this means for you Summary
Snapshot
- This is a 3-bed/2.0-bath manufactured listed at $145k.
Deal economics
- At list price, monthly cash flow is $369 ($4k/yr) — positive.
- The deal already cash-flows at list — no discount required.
- Meets the 1% rule at list price ($2k rent vs $145k).
- Recommended offer: $132k (9.0% below list) — sets the bar for market timing.
- Cap rate 8.6% vs local median 2.9% in Nashville-Davidson metropolitan government (balance) — top-decile yield for the area; either an underpriced asset or a hidden risk that comps aren't pricing in. Stress-test before assuming the spread holds.
Location & tenants
- Location reads: area grade C — affects rentability + tenant quality, not the cash-flow math above.
- Davidson County (urban): math 12% / reading 19% proficiency, ranked #126 of 139 in TN (top 91%) — low school quality limits family demand, transient renter base, plan for 1-2y turnover; 66% free/reduced lunch — lower-income household profile, screen leases tightly.
- Market conditions: Rents rising (+1.3%/yr); 535 active listings in the ZIP; 40 comparable units currently listed for rent nearby; rentals at typical pace (median 15d on market — plan ~3-4 weeks tenant-placement turnaround); 6,873 units permitted in Davidson County in 2024 (4,138 in 5+ unit buildings).
- This rent runs 42% of the median local income ($62k/yr) — at the standard rent-burdened threshold; future hikes will face affordability resistance.
Forward outlook
- Local home prices are declining (-3.0%/yr); year-one equity from $1k of loan paydown is wiped out by about $6k of value loss. Plan a longer hold.
- Davidson County population projected at +42% by 2050 — long-run rental-demand tailwind backs the buy-and-hold thesis.
Negotiation context
- It's been on market 106 days — a 9% lower offer ($132k) is reasonable based on typical stale-listing flexibility.
Questions for the listing agent
- It's been on market 106 days. Have you received any prior offers? Is the seller open to a 9% concession, seller financing, or rate buy-down credit?
- Why hasn't it sold? Are there any deal-killer items the seller is aware of (foundation, flood, title, zoning, code violations)?
- Is there a deadline driving the sale (1031 exchange, divorce, estate, relocation)? That informs how much negotiation room exists.
- What's the average days-on-market for RENTAL listings here right now (not sales)? A rising rental-DOM trend means longer vacancies and softer asking-rent achievability than the comps imply.
- What's the recent tenant-quality profile in this submarket — average credit score on applications, eviction rate, late-payment / NSF rate, and stable-employment percentage? A property-management company in the area should have these aggregated.
- How much new for-sale + rental construction is in the pipeline within 1–3 miles? Heavy new supply typically softens prices + rents 12–24 months out; constrained supply supports both.
Investment metrics
- 1% rule
- 1.12% ✓
- Cap rate
- 8.59%
- Cash-on-cash
- 8.19%
- DSCR
- 1.36
- GRM
- 7.5
CMA / ARV
- ARV (on-the-fly)
- $193,192
- Comps found
- 1
Show comp detail 1 sale within ~0.75 mi
| Address | Dist | Beds/Ba | Sqft | Sold | Price | $/sf | Match |
|---|---|---|---|---|---|---|---|
| 329 Queen Ave | 0.53mi | 4/2.0 (+1) | 1,218 (+3%) | 8mo | $200,000 | $164 | 58 |
Match score weights: distance 35% · size 25% · config 20% · recency 20%. Top-matched comps best support the ARV.
Projected returns pro-forma
-3.0% appreciation · 1.33% rent growth · sell at horizon
- IRR
- -5.7%
- Equity multiple
- 0.79×
- Total profit
- $-11,332
- Equity at exit
- $28,806
- IRR
- 1.8%
- Equity multiple
- 1.12×
- Total profit
- $6,385
- Equity at exit
- $16,704
Cash invested: $54,094 (down + closing). Projections, not guarantees.
Landlord ↔ Tenant lean methodology
- Overall (STATE)
- 87 Strongly Landlord-Friendly
- State Tennessee
- 87 Strongly Landlord-Friendly · R+13
- County
- — inherits STATE
- City
- — inherits STATE
ZIP-level market 37207
- Home prices YoY
- -27.8%
- Rents YoY
- 1.3%
- Active inventory
- 535
- Price-to-rent
- 5.6×
Monthly cashflow live
- Estimated rent
- $2,157 high interval (Pro) →
- Mortgage (P&I)
- −$1,013
- Tax est. 1.5%
- −$241 /mo · $2,898/yr
- Insurance
- −$80
- HOA
- −$0
- Vacancy / Maint / Mgmt
- −$453
- Net cashflow
- $369
Break-even live
UW: 25.0% down · 7.5% · 30yr · 1.5% tax · 5.0% vac · 8.0% maint · 8.0% mgmt
Financing live
Cash to close
- Down payment
- $48,298
- Closing costs
- $5,796
- Reserves months
- —
- Total cash needed
- —
Loan-product check · same deal, 3 products live
Conventional
25% down · 7.5% · 30yr
- Down + closing
- —
- Monthly P&I
- —
- Monthly cashflow
- —
- DSCR
- —
- Eligible?
- —
Personal DTI + credit; lowest rate.
DSCR
20% down · 8.5% · 30yr
- Down + closing
- —
- Monthly P&I
- —
- Monthly cashflow
- —
- DSCR
- —
- Eligible?
- —
No personal income docs; deal must DSCR.
Hard money
10% down · 12.0% · 12mo
- Down + closing
- —
- Monthly P&I
- —
- Monthly cashflow
- —
- DSCR
- —
- Eligible?
- —
Short-term bridge; refi at stabilization.
Rent comps 40 comps
| Address | Beds | Baths | Sqft | Rent | $/sqft | DOM | Units | Dist |
|---|---|---|---|---|---|---|---|---|
| 109 Duke St Unit B Nashville, TN | 2.0 | 2.5 | 1400 | $2,000 | $1.43 | 24d | 1 | 0.30mi |
| 109 Duke St Unit E Nashville, TN | 2.0 | 2.5 | 1400 | $2,200 | $1.57 | 24d | 1 | 0.30mi |
| 204 Prince Ave Unit A Nashville, TN | 2.0 | 1.0 | 800 | $1,875 | $2.34 | 24d | 1 | 0.34mi |
| 215 Prince Ave Unit D Nashville, TN | 2.0 | 1.0 | 780 | $999 | $1.28 | 24d | 1 | 0.37mi |
| 438 Roger Williams Ave Nashville, TN | 2.0 | 1.5 | 960 | $1,450 | $1.51 | 21d | 1 | 0.42mi |
| 1801 Meridian St Nashville, TN | 1.0–2.0 | 1.0–2.5 | 1050 | $2,817 | $2.68 | 4d | 10 | 0.53mi |
| 308 Prince Ave Nashville, TN | 2.0 | 1.0 | 900 | $1,200 | $1.33 | 16d | 1 | 0.54mi |
| 308 Prince Ave Unit A Nashville, TN | 2.0 | 1.0 | 800 | $1,200 | $1.50 | 21d | 1 | 0.54mi |
| 128 Gordon Ter Nashville, TN | 3.0 | 2.0 | 1400 | $2,600 | $1.86 | 10d | 1 | 0.54mi |
| 2003 Overby Rd Nashville, TN | 2.0 | 2.0 | 924 | $2,295 | $2.48 | 7d | 1 | 0.67mi |
| 5515 Scruggs Ln Nashville, TN | 2.0–3.0 | 2.0 | 1128 | $1,799 | $1.59 | 3d | 42 | 0.68mi |
| 55 Lucile St Nashville, TN | 2.0 | 1.0–2.0 | 731 | $2,125 | $2.91 | 2d | 23 | 0.86mi |
| 214 Lucile Ln Nashville, TN | 2.0 | 2.5 | 1326 | $2,595 | $1.96 | 12d | 1 | 0.86mi |
| 112 Lucile St Nashville, TN | 2.0 | 1.0 | 1200 | $1,795 | $1.50 | 24d | 1 | 0.89mi |
| 2316 Woodridge Dr Nashville, TN | 3.0 | 1.0 | 950 | $1,595 | $1.68 | 24d | 1 | 0.93mi |
| 64 Fern Ave Nashville, TN | 3.0 | 2.5 | 1468 | $3,149 | $2.15 | 2d | 1 | 1.00mi |
| 538 Norton Ave Nashville, TN | 3.0 | 2.0 | 1394 | $2,000 | $1.43 | 19d | 1 | 1.00mi |
| 600 E Trinity Ln Unit 1049679P Nashville, TN | 2.0 | 2.0 | 990 | $3,890 | $3.93 | 24d | 1 | 1.03mi |
| 1301 Baptist World Center Dr Unit 1385496P Nashville, TN | 2.0 | 2.5 | 1097 | $2,693 | $2.45 | 7d | 1 | 1.07mi |
| 1111 Baptist World Center Dr #4 Nashville, TN | 2.0 | 3.0 | 1100 | $2,300 | $2.09 | 21d | 1 | 1.11mi |
| 1100 Sunset Cir Nashville, TN | 1.0–3.0 | 1.0–2.5 | 1070 | $1,899 | $1.77 | 3d | 7 | 1.15mi |
| 1205 Meridian St Nashville, TN | 3.0 | 2.0 | 1152 | $2,100 | $1.82 | 7d | 1 | 1.16mi |
| 1310 Jones Ave Nashville, TN | 2.0 | 2.0 | 1200 | $1,895 | $1.58 | 17d | 1 | 1.17mi |
| 849 Cherokee Ave #12 Nashville, TN | 2.0 | 2.5 | 1330 | $2,600 | $1.95 | 24d | 1 | 1.19mi |
| 1208 Lischey Ave Nashville, TN | 2.0 | 2.0 | 1441 | $3,200 | $2.22 | 15d | 1 | 1.21mi |
| 1402 Montgomery Ave Unit B Nashville, TN | 2.0 | 1.0 | 885 | $2,250 | $2.54 | 7d | 1 | 1.22mi |
| 927 Chickasaw Ave Nashville, TN | 3.0 | 2.0 | 1223 | $2,600 | $2.13 | 17d | 1 | 1.23mi |
| 613 Youngs Ln Nashville, TN | 2.0 | 2.0 | 1056 | $1,350 | $1.28 | 7d | 1 | 1.24mi |
| 1112 Joseph Ave Unit A Nashville, TN | 3.0 | 2.0 | 1224 | $2,800 | $2.29 | 4d | 1 | 1.24mi |
| 1112 Joseph Ave Unit B Nashville, TN | 2.0 | 2.0 | 918 | $1,800 | $1.96 | 4d | 1 | 1.24mi |
| 905 Blue Ridge Dr Unit B Nashville, TN | 2.0 | 1.0 | 780 | $1,600 | $2.05 | 7d | 1 | 1.25mi |
| 901 Cherokee Ave Nashville, TN | 3.0 | 1.0–2.0 | 1457 | $3,563 | $2.45 | 2d | 12 | 1.26mi |
| 2945 Brick Church Pike Nashville, TN | 1.0–3.0 | 1.0–2.0 | 1052 | $1,652 | $1.57 | 24d | 1 | 1.32mi |
| 3100 Conviser Dr Nashville, TN | 2.0 | 1.5 | 960 | $1,600 | $1.67 | 17d | 1 | 1.33mi |
| 2323 Ilolo St Unit 1 Nashville, TN | 3.0 | 1.5 | 1116 | $1,995 | $1.79 | 24d | 1 | 1.42mi |
| 2327 Whites Creek Pike Nashville, TN | 2.0 | 2.0 | 1391 | $1,950 | $1.40 | 7d | 1 | 1.42mi |
| 2424 Inga St Nashville, TN | 3.0 | 2.0 | 1440 | $2,495 | $1.73 | 16d | 1 | 1.44mi |
| 1018 N 6th St Nashville, TN | 3.0 | 2.0 | 1476 | $2,995 | $2.03 | 15d | 1 | 1.45mi |
| 1018 N 6th St Nashville, TN | 3.0 | 2.0 | 1476 | $2,995 | $2.03 | 14d | 1 | 1.45mi |
| 131 Great Circle Rd Nashville, TN | 2.0 | 1.0–2.0 | 881 | $2,667 | $3.03 | 12d | 25 | 1.48mi |
Listing history 14 events
-
2026-06-18days on market $145,000 Active 106 DOM
-
2026-06-17days on market $145,000 Active 105 DOM
-
2026-06-16days on market $145,000 Active 104 DOM
-
2026-06-15days on market $145,000 Active 103 DOM
-
2026-06-13days on market $145,000 Active 101 DOM
-
2026-06-13days on market $145,000 Active 100 DOM
-
2026-06-09days on market $145,000 Active 97 DOM
-
2026-06-08days on market $145,000 Active 96 DOM
-
2026-06-07days on market $145,000 Active 95 DOM
-
2026-06-05days on market $145,000 Active 92 DOM
-
2026-06-03days on market $145,000 Active 91 DOM
-
2026-06-02days on market $145,000 Active 90 DOM
-
2026-06-01days on market $145,000 Active 89 DOM
-
2026-05-31days on market $145,000 Active 88 DOM
ⓘ Source: listings_history table (triggers on properties + properties_extension) + one-shot
backfill from property_details.listing_events for pre-trigger history.
Nearby sold comps map
Loading sold comps map…
Walkable amenities ~0.75 mi
Loading nearby amenities…
Taxation est. · year 1
- Rental income
- $25,886
- − Mortgage interest
- −$10,822
- − Property taxes
- −$2,898
- − Insurance
- −$966
- − Repairs & maintenance
- −$2,071
- − Management
- −$2,071
- − Depreciation
- −$5,620
- Taxable income
- $1,439
- Est. tax owed @ 24.0%
- −$345
- After-tax cash flow
- $4,084/yr
For passive investors: Depreciation is non-cash, so a rental often shows a tax loss while cash-flowing — sheltering income. Rental losses are passive: they offset passive income freely, and up to $25,000/yr can offset ordinary (W-2) income if you actively participate and your MAGI is under $100k (phasing out to $0 by $150k); unused losses carry forward. On sale, claimed depreciation is recaptured at up to 25%, and gains may owe capital-gains tax (a 1031 exchange can defer both). Figures are a year-1 estimate at your 24.0% rate — not tax advice; consult a CPA.
Schools (NCES district)
- District
- Davidson County
- NCES district ID
- 4703180
- Math proficiency
- 12% ▼ -17.00%
- Reading proficiency
- 19% ▼ -7.00%
- Median HH income
- $48,667
- Composite
- 14.03/100
- National rank
- #9472
- State rank
- #126 of 139 in TN
Livability — Nashville-Davidson metropolitan government (balance)
No livability data for this city. (Only ~50 U.S. cities are tracked.)
Census & demographics
- Census place
- Nashville-Davidson metropolitan government (balance), TN
- County
- Davidson County · 680,067 people
- City population
- 677,595
- Metro
- Nashville-Davidson--Murfreesboro--Franklin, TN
- Population (ZIP)
- 41,366
- Household income
- $61,744
- Rent vs Own
- Severe rent burden
- 1969.0
Population outlook (Davidson County) Hauer SSP2
- Today (2025)
- 808,568 people
- By 2030
- 874,489 · +8.2%
- By 2040
- 1,009,046 · +24.8%
- By 2050
- 1,147,294 · +41.9%
- By 2075
- 1,475,439 · +82.5%
- By 2100
- 1,714,101 · +112.0%
Race, ethnicity, and origin ACS 2023
- Neighborhood character
- Diverse neighborhood (Simpson 0.60)
- Race & ethnicity
- Black 57% White 24% Hispanic / Latino 13% Two or more races 8%
- Hispanic origin (detail)
- Mexican 6%
- Common ancestry
- Slovak 2% Serbian 1% Romanian 1%
- Foreign-born
- 10% · Canada, Jamaica
- Languages at home
- 88% English-only · Spanish 10%
Political lean MEDSL · Davidson
- 2024 margin
- Strong D (+27.4) · D 62.7% · R 35.3% · Other 2.0%
- 2008→2024 swing
- +6.5pp toward D · 2008: 21.0pp · 2024: 27.4pp
- All cycles
- 2024: D+27.4 2020: D+32.1 2016: D+26.0 2012: D+18.7 2008: D+21.0
Not yet ingested
- Civics
- —
Market trends
- HPI YoY
- ▼ -135.21%
- Current HPI
- 351.9628
- Rent YoY
- ▲ 1.33%
- Metro
- Nashville-Davidson--Murfreesboro--Franklin, TN
- State GDP YoY
- ▲ 2.78%
- F500 in state
- 22
Industry mix (Fortune 500 HQ in TN)
| Industry | F500 HQs | Revenue |
|---|---|---|
| Healthcare | 3 | $91B |
|
||
| Retail | 3 | $72B |
|
||
| Transportation / Logistics | 1 | $88B |
|
||
| Paper / Packaging | 1 | $19B |
|
||
| Insurance | 1 | $13B |
|
||
| Energy | 1 | $12B |
|
||
Cash-flow waterfall
monthlySold comps — $/sqft
last 12 mo · ≤1 miLoading sold comps…