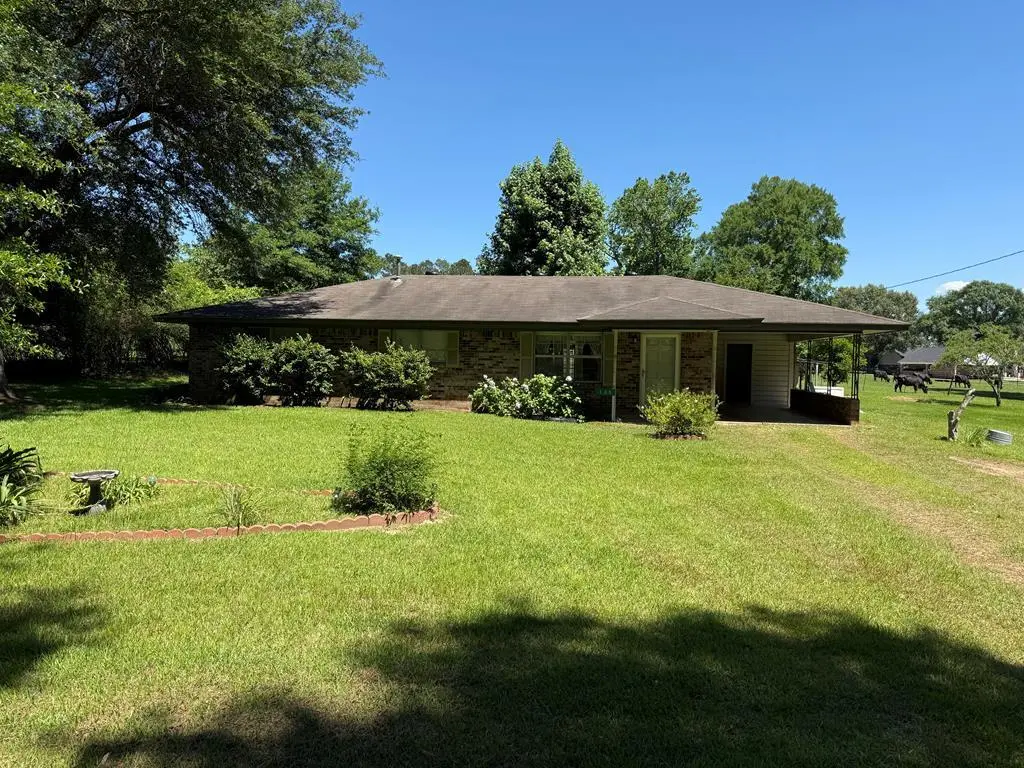
135 Pine St · Chireno, TX
Flood risk 1/10 · Minimal
- FEMA flood zone
- X (unshaded)
- Chance of flooding over 30 yrs
- 0.0%
- Est. flood insurance / yr
- $507 – $1,088
Fire risk 4/10 · Minor
- Est. fire insurance / yr
- $1,222 – $2,270
Heat risk 7/10 · Major
- Hot days now (above 111°F)
- 6 days/yr
- Hot days in 30 yrs
- 22 days/yr
Wind risk 8/10 · Major
- Chance of severe wind over 30 yrs
- 80.0%
Air-quality risk 1/10 · Minimal
- Unhealthy air days now
- 0 days/yr
- Unhealthy air days in 30 yrs
- 0 days/yr
Risk factors via First Street. Map © Google.
Why this score? — see what drove the D grade
The composite is a weighted blend of 9 inputs, each scored 0–100. Each bar is that input's sub-score; the figure is the points it added to the 100-point composite (weight × sub-score).
- Cash flow +12.1/30.0
- ARV discount +7.5/15.0
- Appreciation +5.9/10.0
- DSCR +3.6/10.0
- Schools +3.1/10.0
- 1% rule +2.9/10.0
- Livability +2.9/5.0
- Rent growth +2.5/5.0
- Condition / age +2.5/5.0
$138,500
🖨 Deal sheet (PDF) 📄 Offer letter ✓ Due diligence
Listing remarks MLS
Very Well taken care of brick home in the quaint community of Chireno that is move in ready. This is a one owner home that is very well built with a nice layout of large bedrooms, open concept kitchen, dining and living room. Other features include wood floors, spacious bathroom. All of this sitting on a 3 lots that is 1.07 acres with all types of fruit trees (plum, fig, orange, peach). 12 X 16 storage building with a leanto.
Key facts
- Extra outdoor space
- Updated electrical
- 3 lots
Tags
Property features AI
Exterior
- Parking: Attached garage
- Utilities: Public water
- Home design: Single-family residence; Residential property; Not in a subdivision
- Construction: Brick and wood siding exterior; Composition roof; Slab foundation; Built on a 1.06-acre lot
- Exterior features: Fenced yard; Shed(s)
Interior
- Kitchen: Refrigerator; Freezer; Microwave
- Flooring: Tile; Wood
- Bathrooms: 1 full bathroom
- Heating & cooling: Central heating; Central air conditioning
- Interior features: Walk-in closet(s); Smoke detector(s)
- Laundry & utility: Washer; Dryer
Neighborhood map
What this means for you Summary
Snapshot
- This is a 3-bed/1.0-bath single-family listed at $138k.
Deal economics
- At list price, monthly cash flow is $-31 ($-374/yr) — negative.
- To cash-flow at today's rent, offer at most $133k (4.0% below list).
- To meet the 1% rule (rent ≥ 1% of price), the offer needs to be $110k (20.7% below list).
- Recommended offer: $110k (20.7% below list) — sets the bar for 1% rule.
Location & tenants
- Location reads 58/100 on livability (#1,228 in TX) — a working-class tenant base; expect higher turnover. Strengths: cost of living A+, housing A+; Watch: crime F, amenities F, commute F.
- Chireno ISD (rural): math 33% / reading 40% proficiency, ranked #490 of 826 in TX (top 59%) — families likely to look elsewhere, expect single-tenant / working-renter base with shorter leases; 74% free/reduced lunch — lower-income household profile, screen leases tightly.
- Zoned schools: Chireno El (math 32% / reading 37%, grade F, #1,995 of 4,322 statewide, top 50%, 274 students, 74% FRL); Chireno H S (math 50% / reading 70%, grade C+, #275 of 1,632 statewide, top 19%, 130 students, 50% FRL).
- Market conditions: 6 active listings in the ZIP; 35 units permitted in Nacogdoches County in 2024 (0 in 5+ unit buildings).
Forward outlook
- In year one you build about $4k of equity ($958 loan paydown + $3k appreciation (1.9% local appreciation)).
- At projected returns (1.9% appreciation + 3.0% rent growth), your $39k cash investment doubles in ~9 years — after that, you're playing with house money.
- By year 9, paydown + projected appreciation supports a ~$30k cash-out refi (75% LTV) — recoverable capital for the next deal without selling this one.
Negotiation context
- It's been on market 17 days — a 2% lower offer ($136k) is reasonable based on typical stale-listing flexibility.
- 2 sale attempts since 8y ago with the ask held roughly flat each time — persistent listings suggest the price (not the market) is what's stuck; bring a comps-based counter.
Risks & watch-outs
- Climate carrying-cost: severe wind risk, 80% chance of damaging wind over 30y; extreme-heat days projected 6→22/yr by 2055 (HVAC capex compounding) — expect insurance premiums to compound above CPI over the hold.
Questions for the listing agent
- What do current leases actually rent for vs. the listed asking? Can we see a recent rent roll and the last 12 months of T-12 income?
- Is there a deadline driving the sale (1031 exchange, divorce, estate, relocation)? That informs how much negotiation room exists.
- Schools are D-rated, which usually means shorter tenancies and higher turnover. Who's the typical renter profile here, and what's been the actual vacancy rate?
- Crime grade is F in this area — have there been break-ins, vandalism, or insurance claims at this property in the last 3 years? What carrier currently insures it and at what premium?
- The area grade is low — what's the realistic commute time and amenity access for the typical tenant pool here? Any planned neighborhood developments (good or bad) we should know about?
- What's the average days-on-market for RENTAL listings here right now (not sales)? A rising rental-DOM trend means longer vacancies and softer asking-rent achievability than the comps imply.
- What's the recent tenant-quality profile in this submarket — average credit score on applications, eviction rate, late-payment / NSF rate, and stable-employment percentage? A property-management company in the area should have these aggregated.
- How much new for-sale + rental construction is in the pipeline within 1–3 miles? Heavy new supply typically softens prices + rents 12–24 months out; constrained supply supports both.
Investment metrics
- 1% rule
- 0.79% ✗
- Cap rate
- 6.02%
- Cash-on-cash
- -0.96%
- DSCR
- 0.96
- GRM
- 10.5
CMA / ARV
No comps found within radius.
Projected returns pro-forma
1.85% appreciation · 3.0% rent growth · sell at horizon
- IRR
- 3.1%
- Equity multiple
- 1.17×
- Total profit
- $6,430
- Equity at exit
- $53,497
- IRR
- 7.0%
- Equity multiple
- 1.94×
- Total profit
- $36,432
- Equity at exit
- $76,177
Cash invested: $38,780 (down + closing). Projections, not guarantees.
Landlord ↔ Tenant lean methodology
- Overall (STATE)
- 87 Strongly Landlord-Friendly
- State Texas
- 87 Strongly Landlord-Friendly · R+5
- County
- — inherits STATE
- City
- — inherits STATE
ZIP-level market 75937
- Home prices YoY
- 1.9%
- Active inventory
- 6
- Price-to-rent
- 10.5×
Monthly cashflow live
- Estimated rent
- $1,099 medium interval (Pro) →
- Mortgage (P&I)
- −$726
- Tax from tax record
- −$115 /mo · $1,383/yr
- Insurance
- −$58
- HOA
- −$0
- Vacancy / Maint / Mgmt
- −$231
- Net cashflow
- $-31
Break-even live
Sensitivity live
| Price | -10% $47 | -5% $8 | +0% $-31 | +5% $-70 | +10% $-110 |
|---|---|---|---|---|---|
| Rent | -10% $-118 | -5% $-75 | +0% $-31 | +5% $12 | +10% $56 |
| Rate | -1.0pp $39 | -0.5pp $4 | base $-31 | +0.5pp $-67 | +1.0pp $-104 |
UW: 25.0% down · 7.5% · 30yr · 1.5% tax · 5.0% vac · 8.0% maint · 8.0% mgmt
Financing live
Cash to close
- Down payment
- $34,625
- Closing costs
- $4,155
- Reserves months
- —
- Total cash needed
- —
Loan-product check · same deal, 3 products live
Conventional
25% down · 7.5% · 30yr
- Down + closing
- —
- Monthly P&I
- —
- Monthly cashflow
- —
- DSCR
- —
- Eligible?
- —
Personal DTI + credit; lowest rate.
DSCR
20% down · 8.5% · 30yr
- Down + closing
- —
- Monthly P&I
- —
- Monthly cashflow
- —
- DSCR
- —
- Eligible?
- —
No personal income docs; deal must DSCR.
Hard money
10% down · 12.0% · 12mo
- Down + closing
- —
- Monthly P&I
- —
- Monthly cashflow
- —
- DSCR
- —
- Eligible?
- —
Short-term bridge; refi at stabilization.
Listing history 6 events
-
2026-05-30statusdays on market $138,500 Pending 17 DOM
-
2026-05-13$138,500 Active 529-char remark
-
2018-12-17soldstatus
-
2018-12-17soldstatus
-
2018-12-13soldstatus 430-char remark
Show marketing remark (430 chars)
Very Well taken care of brick home in the quaint community of Chireno that is move in ready. This is a one owner home that is very well built with a nice layout of large bedrooms, open concept kitchen, dining and living room. Other features include wood floors, spacious bathroom. All of this sitting on a 3 lots that is 1.07 acres with all types of fruit trees (plum, fig, orange, peach). 12 X 16 storage building with a leanto.
-
2018-06-26$89,900 430-char remark
Show marketing remark (430 chars)
Very Well taken care of brick home in the quaint community of Chireno that is move in ready. This is a one owner home that is very well built with a nice layout of large bedrooms, open concept kitchen, dining and living room. Other features include wood floors, spacious bathroom. All of this sitting on a 3 lots that is 1.07 acres with all types of fruit trees (plum, fig, orange, peach). 12 X 16 storage building with a leanto.
ⓘ Source: listings_history table (triggers on properties + properties_extension) + one-shot
backfill from property_details.listing_events for pre-trigger history.
Tax reassessment forecast TX · Resets to sale price
- Current annual tax
- $1,383 · $115/mo
- Projected year-2 tax
- $2,535 · $211/mo
- Expected delta
- +$1,152/yr (+$96/mo · 83.3%)
ⓘ Screening estimate from a state-policy table — verify with the county assessor before closing.
Climate risk First Street
- Flood 1/10 Low FEMA zone X (unshaded) · 0% chance over 30 yrs
- Wildfire 4/10 Moderate
- Heat 7/10 Severe 6 d/yr ≥111°F today · 22 d/yr by 30 yrs out
- Wind 8/10 Severe 80% chance of damaging wind over 30 yrs
- Air quality 1/10 Low 0 unhealthy d/yr today · 0 by 30 yrs out
Nearby sold comps map
Loading sold comps map…
Walkable amenities ~0.75 mi
Loading nearby amenities…
Taxation est. · year 1
- Rental income
- $13,186
- − Mortgage interest
- −$7,758
- − Property taxes
- −$1,383
- − Insurance
- −$692
- − Repairs & maintenance
- −$1,055
- − Management
- −$1,055
- − Depreciation
- −$4,029
- Taxable loss
- −$2,786
- Est. tax savings @ 24.0%
- +$669
- After-tax cash flow
- $295/yr
For passive investors: Depreciation is non-cash, so a rental often shows a tax loss while cash-flowing — sheltering income. Rental losses are passive: they offset passive income freely, and up to $25,000/yr can offset ordinary (W-2) income if you actively participate and your MAGI is under $100k (phasing out to $0 by $150k); unused losses carry forward. On sale, claimed depreciation is recaptured at up to 25%, and gains may owe capital-gains tax (a 1031 exchange can defer both). Figures are a year-1 estimate at your 24.0% rate — not tax advice; consult a CPA.
Schools (NCES district)
- District
- Chireno ISD
- NCES district ID
- 4813980
- Math proficiency
- 33% ▼ -18.00%
- Reading proficiency
- 40% ▼ -4.00%
- Median HH income
- $44,632
- Composite
- 31.05/100
- National rank
- #6080
- State rank
- #490 of 826 in TX
Livability — Chireno
- Score
- 58/100
- State rank
- #1228
- US rank
- #21432
Category grades
Schools grade is shown separately in the Schools card above.
Census & demographics
- Census place
- Chireno, TX
- Population (ZIP)
- 1,179
Population outlook (Nacogdoches County) Hauer SSP2
- Today (2025)
- 66,553 people
- By 2030
- 66,920 · +0.6%
- By 2040
- 66,833 · +0.4%
- By 2050
- 66,462 · -0.1%
- By 2075
- 65,710 · -1.3%
- By 2100
- 62,321 · -6.4%
Race, ethnicity, and origin ACS 2023
- Neighborhood character
- Predominantly White (70%)
- Race & ethnicity
- White 70% Hispanic / Latino 14% Black 14% Two or more races 3%
- Hispanic origin (detail)
- Mexican 14%
- Common ancestry
- Italian 2% Serbian 2% Slovak 1%
- Foreign-born
- 6% · Canada
- Languages at home
- 88% English-only · Spanish 12%
Political lean MEDSL · Nacogdoches
- 2024 margin
- Solid R (+38.8) · D 30.2% · R 69.0%
- 2008→2024 swing
- -11.3pp toward R · 2008: -27.5pp · 2024: -38.8pp
- All cycles
- 2024: R+38.8 2020: R+31.3 2016: R+35.4 2012: R+36.2 2008: R+27.5
Not yet ingested
- Civics
- —
Market trends
- HPI YoY
- ▲ 1.85%
- Current HPI
- 99.7166
- Rent YoY
- —
- Metro
- —
- State GDP YoY
- ▲ 3.95%
- F500 in state
- 110
Industry mix (Fortune 500 HQ in TX)
| Industry | F500 HQs | Revenue |
|---|---|---|
| Energy | 16 | $1,198B |
|
||
| Technology | 5 | $198B |
|
||
| Engineering / Construction | 4 | $72B |
|
||
| Energy Services | 3 | $60B |
|
||
| Utilities | 3 | $41B |
|
||
| Healthcare | 2 | $330B |
|
||
Price history
+54.1% since first listed6 events — show timeline
- 2026-05-30 Pending — Deep East Texas MLS
- 2026-05-13 Listed $138,500 Deep East Texas MLS
- 2018-12-17 Sold (Public Records) — Public Records
- 2018-12-17 Sold (Public Records) — Public Records
- 2018-12-13 Sold (MLS) — Deep East Texas MLS
- 2018-06-26 Listed $89,900 Deep East Texas MLS
Property tax history
+1.5%/yrLatest (2025): $1,383 · +4.9% YoY. Source: county tax records.
Cash-flow waterfall
monthlySold comps — $/sqft
last 12 mo · ≤1 miLoading sold comps…