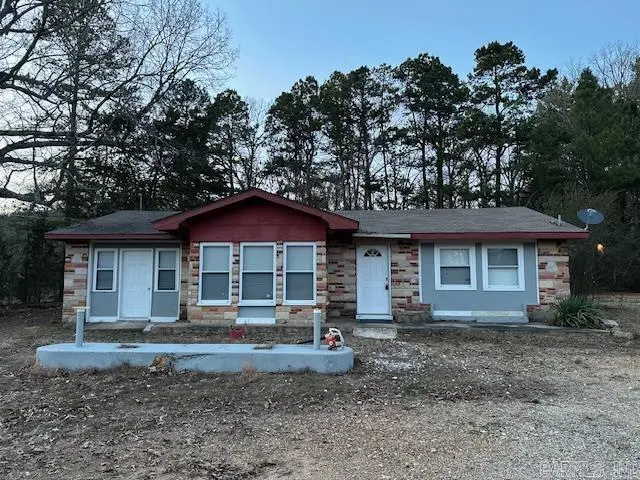
5209 E Grand Ave · Fountain Lake, AR
Flood risk 1/10 · Minimal
- FEMA flood zone
- X (unshaded)
- Chance of flooding over 30 yrs
- 0.0%
- Est. flood insurance / yr
- $507 – $1,088
Fire risk 3/10 · Minor
- Est. fire insurance / yr
- $1,499 – $2,785
Heat risk 5/10 · Moderate
- Hot days now (above 110°F)
- 7 days/yr
- Hot days in 30 yrs
- 20 days/yr
Wind risk 3/10 · Minor
- Chance of severe wind over 30 yrs
- 8.0%
Air-quality risk 2/10 · Minimal
- Unhealthy air days now
- 0 days/yr
- Unhealthy air days in 30 yrs
- 1 days/yr
Risk factors via First Street. Map © Google.
Why this score? — see what drove the D+ grade
The composite is a weighted blend of 9 inputs, each scored 0–100. Each bar is that input's sub-score; the figure is the points it added to the 100-point composite (weight × sub-score).
- Cash flow +20.8/30.0
- ARV discount +7.5/15.0
- DSCR +6.6/10.0
- 1% rule +4.6/10.0
- Livability +3.1/5.0
- Rent growth +2.5/5.0
- Condition / age +2.5/5.0
- Schools +2.4/10.0
- Appreciation +0.0/10.0
$125,900
🖨 Deal sheet 📄 Offer letter ✓ Due diligence
Listing remarks MLS
Beautiful 2-bedroom 1-bath home with just under half an acre! Thoughtful updates, including flooring, furnace, A/C unit, water heater, and well house plumbing, including a new line from the well house to the home. The property has a nice outdoor storage shed that conveys and a fully fenced-in yard with a gate for entry. Great property for first-time home buyers or an addition to an investor's portfolio.
Key facts
- Outdoor storage shed
- Fully fenced yard
- 0.48 acre lot
Tags
Neighborhood map
What this means for you Summary
Snapshot
- This is a 2-bed/1.0-bath single-family listed at $126k.
Deal economics
- At list price, monthly cash flow is $172 ($2k/yr) — positive.
- The deal already cash-flows at list — no discount required.
- To meet the 1% rule (rent ≥ 1% of price), the offer needs to be $121k (4.1% below list).
- Recommended offer: $121k (4.1% below list) — sets the bar for 1% rule.
Location & tenants
- Location reads 61/100 on livability (#256 in AR) — a middle-class / working-renter tenant base. Strengths: cost of living A+, housing A+; Watch: schools F, crime F, amenities F.
- Cutter-Morning Star School District (rural): math 27% / reading 31% proficiency, ranked #159 of 238 in AR (top 67%) — low school quality limits family demand, transient renter base, plan for 1-2y turnover.
- Market conditions: 363 active listings in the ZIP; 117 units permitted in Garland County in 2024 (24 in 5+ unit buildings).
Forward outlook
- Local home prices are declining (-3.0%/yr); year-one equity from $870 of loan paydown is wiped out by about $4k of value loss. Plan a longer hold.
- Garland County population projected at +7% by 2050 — modest demand growth; plan on rents tracking national, not racing it.
Negotiation context
- It's been on market 31 days — a 3% lower offer ($122k) is reasonable based on typical stale-listing flexibility.
- 11 sale attempts since 9y ago with the ask held roughly flat each time — persistent listings suggest the price (not the market) is what's stuck; bring a comps-based counter.
Risks & watch-outs
- Climate carrying-cost: extreme-heat days projected 7→20/yr by 2055 (HVAC capex compounding) — expect insurance premiums to compound above CPI over the hold.
Questions for the listing agent
- It's been on market 31 days. Have you received any prior offers? Is the seller open to a 4% concession, seller financing, or rate buy-down credit?
- Built in 1961 — when were the roof, HVAC, electrical panel, plumbing, and water heater last replaced?
- Is there a deadline driving the sale (1031 exchange, divorce, estate, relocation)? That informs how much negotiation room exists.
- Schools are F-rated, which usually means shorter tenancies and higher turnover. Who's the typical renter profile here, and what's been the actual vacancy rate?
- Crime grade is F in this area — have there been break-ins, vandalism, or insurance claims at this property in the last 3 years? What carrier currently insures it and at what premium?
- The area grade is low — what's the realistic commute time and amenity access for the typical tenant pool here? Any planned neighborhood developments (good or bad) we should know about?
- What's the average days-on-market for RENTAL listings here right now (not sales)? A rising rental-DOM trend means longer vacancies and softer asking-rent achievability than the comps imply.
- What's the recent tenant-quality profile in this submarket — average credit score on applications, eviction rate, late-payment / NSF rate, and stable-employment percentage? A property-management company in the area should have these aggregated.
- How much new for-sale + rental construction is in the pipeline within 1–3 miles? Heavy new supply typically softens prices + rents 12–24 months out; constrained supply supports both.
Investment metrics
- 1% rule
- 0.96% ✗
- Cap rate
- 7.93%
- Cash-on-cash
- 5.86%
- DSCR
- 1.26
- GRM
- 8.7
CMA / ARV
No comps found within radius.
Projected returns pro-forma
-3.0% appreciation · 3.0% rent growth · sell at horizon
- IRR
- -7.3%
- Equity multiple
- 0.73×
- Total profit
- $-9,475
- Equity at exit
- $18,772
- IRR
- 2.3%
- Equity multiple
- 1.16×
- Total profit
- $5,719
- Equity at exit
- $10,886
Cash invested: $35,252 (down + closing). Projections, not guarantees.
Landlord ↔ Tenant lean methodology
- Overall (STATE)
- 92 Strongly Landlord-Friendly
- State Arkansas
- 92 Strongly Landlord-Friendly · R+14
- County
- — inherits STATE
- City
- — inherits STATE
ZIP-level market 71901
- Home prices YoY
- -3.6%
- Active inventory
- 363
- Price-to-rent
- 8.7×
Monthly cashflow live
- Estimated rent
- $1,208 medium interval (Pro) →
- Mortgage (P&I)
- −$660
- Tax from tax record
- −$69 /mo · $833/yr
- Insurance
- −$52
- HOA
- −$0
- Vacancy / Maint / Mgmt
- −$254
- Net cashflow
- $172
Break-even live
UW: 25.0% down · 7.5% · 30yr · 1.5% tax · 5.0% vac · 8.0% maint · 8.0% mgmt
Financing live
Cash to close
- Down payment
- $31,475
- Closing costs
- $3,777
- Reserves months
- —
- Total cash needed
- —
Loan-product check · same deal, 3 products live
Conventional
25% down · 7.5% · 30yr
- Down + closing
- —
- Monthly P&I
- —
- Monthly cashflow
- —
- DSCR
- —
- Eligible?
- —
Personal DTI + credit; lowest rate.
DSCR
20% down · 8.5% · 30yr
- Down + closing
- —
- Monthly P&I
- —
- Monthly cashflow
- —
- DSCR
- —
- Eligible?
- —
No personal income docs; deal must DSCR.
Hard money
10% down · 12.0% · 12mo
- Down + closing
- —
- Monthly P&I
- —
- Monthly cashflow
- —
- DSCR
- —
- Eligible?
- —
Short-term bridge; refi at stabilization.
Listing history 36 events
-
2026-05-12status Under Contract 407-char remark
Show marketing remark (407 chars)
Beautiful 2-bedroom 1-bath home with just under half an acre! Thoughtful updates, including flooring, furnace, A/C unit, water heater, and well house plumbing, including a new line from the well house to the home. The property has a nice outdoor storage shed that conveys and a fully fenced-in yard with a gate for entry. Great property for first-time home buyers or an addition to an investor's portfolio.
-
2026-05-03price $125,900 407-char remark
Show marketing remark (407 chars)
Beautiful 2-bedroom 1-bath home with just under half an acre! Thoughtful updates, including flooring, furnace, A/C unit, water heater, and well house plumbing, including a new line from the well house to the home. The property has a nice outdoor storage shed that conveys and a fully fenced-in yard with a gate for entry. Great property for first-time home buyers or an addition to an investor's portfolio.
-
2026-04-11$129,900 New Listing 407-char remark
Show marketing remark (407 chars)
Beautiful 2-bedroom 1-bath home with just under half an acre! Thoughtful updates, including flooring, furnace, A/C unit, water heater, and well house plumbing, including a new line from the well house to the home. The property has a nice outdoor storage shed that conveys and a fully fenced-in yard with a gate for entry. Great property for first-time home buyers or an addition to an investor's portfolio.
-
2025-08-13historical
-
2025-07-02price $129,900
-
2025-05-29price $138,000
-
2025-04-21price $143,000
-
2025-03-23price $153,000
-
2025-02-26$159,000 New Listing
-
2023-10-20soldstatus $120,000
-
2023-10-18soldstatus $120,000
-
2023-10-18soldstatus $120,000 Sold
-
2023-10-10status Under Contract
-
2023-10-02status Take Backups
-
2023-09-30historical
-
2023-09-12historical Take Backups
-
2023-09-11$125,000
-
2023-08-02status Back on Market
-
2023-07-20historical Take Backups
-
2023-06-30$125,000 New Listing
-
2023-01-01historical
-
2022-10-03$129,000 New Listing
-
2022-10-01historical
-
2022-09-10price $139,000
-
2022-07-21status Back on Market
-
2022-06-27historical Take Backups
-
2022-06-24$149,000 New Listing
-
2022-03-29historical
-
2022-03-11historical Take Backups
-
2022-02-23price $109,000
-
2022-01-12price $129,000
-
2021-12-08$149,900 New Listing
-
2018-02-08historical
-
2017-12-04$75,000 New Listing
-
2014-03-04soldstatus $52,000
-
2007-04-18soldstatus $74,000
ⓘ Source: listings_history table (triggers on properties + properties_extension) + one-shot
backfill from property_details.listing_events for pre-trigger history.
Tax reassessment forecast AR · Resets to sale price
- Current annual tax
- $833 · $69/mo
- Projected year-2 tax
- $833 · $69/mo
- Expected delta
- $0/yr ($0/mo · 0.0%)
ⓘ Screening estimate from a state-policy table — verify with the county assessor before closing.
Climate risk First Street
- Flood 1/10 Low FEMA zone X (unshaded) · 0% chance over 30 yrs
- Wildfire 3/10 Moderate
- Heat 5/10 Major 7 d/yr ≥110°F today · 20 d/yr by 30 yrs out
- Wind 3/10 Moderate 8% chance of damaging wind over 30 yrs
- Air quality 2/10 Low 0 unhealthy d/yr today · 1 by 30 yrs out
Nearby sold comps map
Loading sold comps map…
Walkable amenities ~0.75 mi
Loading nearby amenities…
Taxation est. · year 1
- Rental income
- $14,495
- − Mortgage interest
- −$7,052
- − Property taxes
- −$833
- − Insurance
- −$630
- − Repairs & maintenance
- −$1,160
- − Management
- −$1,160
- − Depreciation
- −$3,663
- Taxable loss
- −$2
- Est. tax savings @ 24.0%
- +$0
- After-tax cash flow
- $2,066/yr
For passive investors: Depreciation is non-cash, so a rental often shows a tax loss while cash-flowing — sheltering income. Rental losses are passive: they offset passive income freely, and up to $25,000/yr can offset ordinary (W-2) income if you actively participate and your MAGI is under $100k (phasing out to $0 by $150k); unused losses carry forward. On sale, claimed depreciation is recaptured at up to 25%, and gains may owe capital-gains tax (a 1031 exchange can defer both). Figures are a year-1 estimate at your 24.0% rate — not tax advice; consult a CPA.
Schools (NCES district)
- District
- Cutter-Morning Star School District
- NCES district ID
- 0504860
- Math proficiency
- 27% ▼ -7.00%
- Reading proficiency
- 31% ▼ -3.00%
- Median HH income
- $40,404
- Composite
- 24.45/100
- National rank
- #7667
- State rank
- #159 of 238 in AR
Livability — Fountain Lake
- Score
- 61/100
- State rank
- #256
- US rank
- #18433
Category grades
Schools grade is shown separately in the Schools card above.
Census & demographics
- County
- Garland County · 76,414 people
- Metro
- Hot Springs, AR
- Population (ZIP)
- 28,937
- Household income
- $53,514
- Rent vs Own
- Severe rent burden
- 961.0
Population outlook (Garland County) Hauer SSP2
- Today (2025)
- 100,343 people
- By 2030
- 101,880 · +1.5%
- By 2040
- 104,804 · +4.4%
- By 2050
- 107,292 · +6.9%
- By 2075
- 113,182 · +12.8%
- By 2100
- 112,247 · +11.9%
Race, ethnicity, and origin ACS 2023
- Neighborhood character
- Predominantly White (71%)
- Race & ethnicity
- White 71% Black 13% Hispanic / Latino 10% Two or more races 6%
- Hispanic origin (detail)
- Mexican 7%
- Common ancestry
- Italian 2% Slovak 2% Portuguese 1%
- Foreign-born
- 5% · Canada, Vietnam
- Languages at home
- 90% English-only · Spanish 7% Vietnamese 1%
Political lean MEDSL · Garland
- 2024 margin
- Solid R (+36.2) · D 30.8% · R 67.0% · Other 2.2%
- 2008→2024 swing
- -11.3pp toward R · 2008: -25.0pp · 2024: -36.2pp
- All cycles
- 2024: R+36.2 2020: R+34.0 2016: R+34.1 2012: R+29.9 2008: R+25.0
Not yet ingested
- Civics
- —
Market trends
- HPI YoY
- ▼ -11.75%
- Current HPI
- 317.2542
- Rent YoY
- —
- Metro
- Hot Springs, AR
- State GDP YoY
- ▲ 3.80%
- F500 in state
- 10
Industry mix (Fortune 500 HQ in AR)
| Industry | F500 HQs | Revenue |
|---|---|---|
| Retail | 1 | $681B |
|
||
| Food / Agriculture | 1 | $53B |
|
||
| Retail / Energy | 1 | $22B |
|
||
| Transportation / Logistics | 1 | $12B |
|
||
| Energy | 1 | $4B |
|
||
Price history
+70.1% since first listed36 events — show timeline
- 2026-05-12 Pending — CARMLS
- 2026-05-03 Price Changed $125,900 CARMLS
- 2026-04-11 Listed $129,900 CARMLS
- 2025-08-13 Listing Removed — CARMLS
- 2025-07-02 Price Changed $129,900 CARMLS
- 2025-05-29 Price Changed $138,000 CARMLS
- 2025-04-21 Price Changed $143,000 CARMLS
- 2025-03-23 Price Changed $153,000 CARMLS
- 2025-02-26 Listed $159,000 CARMLS
- 2023-10-20 Sold (Public Records) $120,000 Public Records
- 2023-10-18 Sold (MLS) $120,000 CARMLS
- 2023-10-18 Sold (MLS) $120,000 HSBOR
- 2023-10-10 Pending — CARMLS
- 2023-10-02 Relisted — CARMLS
- 2023-09-30 Listing Removed — CARMLS
- 2023-09-12 Contingent — CARMLS
- 2023-09-11 Listed $125,000 HSBOR
- 2023-08-02 Relisted — CARMLS
- 2023-07-20 Contingent — CARMLS
- 2023-06-30 Listed $125,000 CARMLS
- 2023-01-01 Listing Removed — CARMLS
- 2022-10-03 Listed $129,000 CARMLS
- 2022-10-01 Listing Removed — CARMLS
- 2022-09-10 Price Changed $139,000 CARMLS
- 2022-07-21 Relisted — CARMLS
- 2022-06-27 Contingent — CARMLS
- 2022-06-24 Listed $149,000 CARMLS
- 2022-03-29 Listing Removed — CARMLS
- 2022-03-11 Contingent — CARMLS
- 2022-02-23 Price Changed $109,000 CARMLS
- 2022-01-12 Price Changed $129,000 CARMLS
- 2021-12-08 Listed $149,900 CARMLS
- 2018-02-08 Listing Removed — CARMLS
- 2017-12-04 Listed $75,000 CARMLS
- 2014-03-04 Sold (Public Records) $52,000 Public Records
- 2007-04-18 Sold (Public Records) $74,000 Public Records
Property tax history
+7.0%/yrLatest (2025): $833 · -1.0% YoY. Source: county tax records.
Cash-flow waterfall
monthlySold comps — $/sqft
last 12 mo · ≤1 miLoading sold comps…