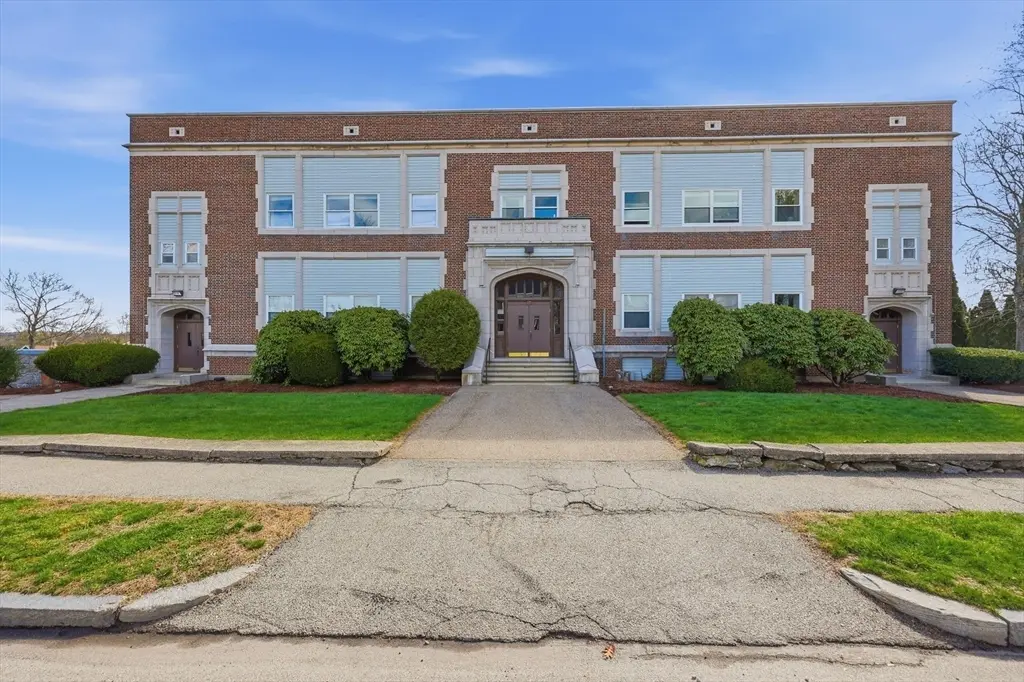
21 Middlesex Ave #305 · Worcester, MA
Flood risk 1/10 · Minimal
- FEMA flood zone
- X (unshaded)
- Chance of flooding over 30 yrs
- 0.0%
- Est. flood insurance / yr
- $507 – $1,088
Fire risk 1/10 · Minimal
- Est. fire insurance / yr
- $915 – $1,699
Heat risk 4/10 · Minor
- Hot days now (above 94°F)
- 7 days/yr
- Hot days in 30 yrs
- 16 days/yr
Wind risk 6/10 · Moderate
- Chance of severe wind over 30 yrs
- 27.0%
Air-quality risk 2/10 · Minimal
- Unhealthy air days now
- 1 days/yr
- Unhealthy air days in 30 yrs
- 2 days/yr
Risk factors via First Street. Map © Google.
Why this score? — see what drove the D grade
The composite is a weighted blend of 9 inputs, each scored 0–100. Each bar is that input's sub-score; the figure is the points it added to the 100-point composite (weight × sub-score).
- ARV discount +14.0/15.0
- Cash flow +10.2/30.0
- 1% rule +4.6/10.0
- Livability +4.4/5.0
- Rent growth +3.0/5.0
- DSCR +2.9/10.0
- Condition / age +2.5/5.0
- Schools +2.0/10.0
- Appreciation +0.0/10.0
$215,000
🖨 Deal sheet (PDF) 📄 Offer letter ✓ Due diligence
Listing remarks MLS
Welcome to Grafton Hill in Worcester! This beautifully renovated low-rise condo offers a fresh, modern feel with an inviting open layout perfect for everyday living and entertaining. The bright living room features gleaming hardwood floors, seamlessly flowing into a kitchen with dining area, complete with stainless steel appliances! Two comfortable bedrooms and a stylish full bath provide just the right amount of space, while in-unit laundry and central air add everyday convenience. Enjoy the ease of assigned and common parking, along with the added bonus of low-maintenance living—no exterior upkeep to worry about. Ideally located just moments from Quinsigamond Lake State Park, offering easy access to outdoor recreation and scenic views.
Key facts
- In-unit laundry
- Open layout
- Central air
Tags
Neighborhood map
What this means for you Summary
Snapshot
- This is a 2-bed/1.0-bath condo listed at $215k.
Deal economics
- At list price, monthly cash flow is $-121 ($-1k/yr) — negative.
- To cash-flow at today's rent, offer at most $194k (10.0% below list).
- To meet the 1% rule (rent ≥ 1% of price), the offer needs to be $206k (4.2% below list).
- Recommended offer: $194k (10.0% below list) — sets the bar for cash-flow.
- Cap rate 5.6% vs local median 4.1% in Worcester — top-decile yield for the area; either an underpriced asset or a hidden risk that comps aren't pricing in. Stress-test before assuming the spread holds.
Location & tenants
- Location reads 87/100 on livability (#9 in MA, #312 nationally) — a professional / high-income tenant draw. Strengths: crime A+, amenities A+, commute A+; Watch: cost of living D.
- Worcester (urban): math 17% / reading 30% proficiency, ranked #280 of 302 in MA (top 93%) — low school quality limits family demand, transient renter base, plan for 1-2y turnover; 66% free/reduced lunch — lower-income household profile, screen leases tightly.
- Zoned schools: Chandler Magnet (math 12% / reading 17%, grade F, #873 of 938 statewide, top 94%, 402 students, 0% FRL); Worcester East Middle (math 9% / reading 14%, grade F, #286 of 305 statewide, top 95%, 740 students, 0% FRL); North High (math 10% / reading 28%, grade F, #313 of 343 statewide, top 92%, 1,377 students, 0% FRL) — zoned schools average 0% FRL vs 66% district-wide (66 pts lower); this property's tenant base skews higher-income than the district average.
- Market conditions: Rents rising (+2.2%/yr); 65 active listings in the ZIP; 11 comparable units currently listed for rent nearby; rentals lingering (median 46d on market — plan ~5-8 weeks vacancy on turnover, expect pricing pressure); 73% of comp listings sitting > 30 days — soft ceiling on asking rent; 2,293 units permitted in Worcester County in 2024 (1,205 in 5+ unit buildings).
- This rent runs 34% of the median local income ($74k/yr) — at the standard rent-burdened threshold; future hikes will face affordability resistance.
Forward outlook
- Local home prices are declining (-3.0%/yr); year-one equity from $1k of loan paydown is wiped out by about $6k of value loss. Plan a longer hold.
Negotiation context
- It's been on market 66 days — a 6% lower offer ($202k) is reasonable based on typical stale-listing flexibility.
- 2 sale attempts since 28y ago with the ask held roughly flat each time — persistent listings suggest the price (not the market) is what's stuck; bring a comps-based counter.
- Current owner paid $54k; list at $215k implies a 302% gain — meaningful room to come down on a strong offer.
Risks & watch-outs
- Watch-outs: built in 1925 — expect roof / HVAC / electrical / plumbing capex.
- Climate carrying-cost: major wind risk, 27% chance of damaging wind over 30y — expect insurance premiums to compound above CPI over the hold.
Questions for the listing agent
- What do current leases actually rent for vs. the listed asking? Can we see a recent rent roll and the last 12 months of T-12 income?
- It's been on market 66 days. Have you received any prior offers? Is the seller open to a 10% concession, seller financing, or rate buy-down credit?
- Built in 1925 — when were the roof, HVAC, electrical panel, plumbing, and water heater last replaced?
- What does the HOA fee cover, when was the last increase, and are there any pending special assessments or reserve-fund shortfalls?
- Any open or pending special assessments — roof, HVAC, plumbing, elevator, façade? What's the per-unit balance and payoff schedule, and is the seller paying it off at close or rolling it to the buyer?
- Why hasn't it sold? Are there any deal-killer items the seller is aware of (foundation, flood, title, zoning, code violations)?
- Is there a deadline driving the sale (1031 exchange, divorce, estate, relocation)? That informs how much negotiation room exists.
- The area grade is low — what's the realistic commute time and amenity access for the typical tenant pool here? Any planned neighborhood developments (good or bad) we should know about?
- What's the average days-on-market for RENTAL listings here right now (not sales)? A rising rental-DOM trend means longer vacancies and softer asking-rent achievability than the comps imply.
- What's the recent tenant-quality profile in this submarket — average credit score on applications, eviction rate, late-payment / NSF rate, and stable-employment percentage? A property-management company in the area should have these aggregated.
- How much new apartment / multifamily construction is in the pipeline within 1–3 miles? Heavy new supply (>2% of stock underway) typically softens rents 12–24 months out; light construction supports rent growth.
Investment metrics
- 1% rule
- 0.96% ✗
- Cap rate
- 5.62%
- Cash-on-cash
- -2.42%
- DSCR
- 0.89
- GRM
- 8.7
CMA / ARV
- ARV (median comp)
- $251,500
- List price
- $215,000
- Delta
- -14.51%
- Verdict
- UNDERPRICED
- Comps
- 20 within 1.0 mi
Projected returns pro-forma
-3.0% appreciation · 2.17% rent growth · sell at horizon
- IRR
- -21.3%
- Equity multiple
- 0.27×
- Total profit
- $-44,074
- Equity at exit
- $32,057
- IRR
- -17.0%
- Equity multiple
- 0.10×
- Total profit
- $-54,425
- Equity at exit
- $18,589
Cash invested: $60,200 (down + closing). Projections, not guarantees.
Landlord ↔ Tenant lean methodology
- Overall (STATE)
- 20 Strongly Tenant-Friendly
- State Massachusetts
- 20 Strongly Tenant-Friendly · D+15
- County
- — inherits STATE
- City
- — inherits STATE
ZIP-level market 01604
- Home prices YoY
- -26.9%
- Rents YoY
- 2.2%
- Active inventory
- 65
- Price-to-rent
- 8.7×
Monthly cashflow live
- Estimated rent
- $2,061 high interval (Pro) →
- Mortgage (P&I)
- −$1,127
- Tax from tax record
- −$123 /mo · $1,476/yr
- Insurance
- −$90
- HOA
- −$409
- Vacancy / Maint / Mgmt
- −$433
- Net cashflow
- $-121
Break-even live
Sensitivity live
| Price | -10% $0 | -5% $-60 | +0% $-121 | +5% $-182 | +10% $-243 |
|---|---|---|---|---|---|
| Rent | -10% $-284 | -5% $-203 | +0% $-121 | +5% $-40 | +10% $42 |
| Rate | -1.0pp $-13 | -0.5pp $-67 | base $-121 | +0.5pp $-177 | +1.0pp $-234 |
UW: 25.0% down · 7.5% · 30yr · 1.5% tax · 5.0% vac · 8.0% maint · 8.0% mgmt
Financing live
Cash to close
- Down payment
- $53,750
- Closing costs
- $6,450
- Reserves months
- —
- Total cash needed
- —
Loan-product check · same deal, 3 products live
Conventional
25% down · 7.5% · 30yr
- Down + closing
- —
- Monthly P&I
- —
- Monthly cashflow
- —
- DSCR
- —
- Eligible?
- —
Personal DTI + credit; lowest rate.
DSCR
20% down · 8.5% · 30yr
- Down + closing
- —
- Monthly P&I
- —
- Monthly cashflow
- —
- DSCR
- —
- Eligible?
- —
No personal income docs; deal must DSCR.
Hard money
10% down · 12.0% · 12mo
- Down + closing
- —
- Monthly P&I
- —
- Monthly cashflow
- —
- DSCR
- —
- Eligible?
- —
Short-term bridge; refi at stabilization.
Rent comps 11 comps
| Address | Beds | Baths | Sqft | Rent | $/sqft | DOM | Units | Dist |
|---|---|---|---|---|---|---|---|---|
| 631 Franklin St Worcester, MA | 2.0 | 1.0 | 750 | $2,388 | $3.18 | 16d | 5 | 1.01mi |
| 29 Duncannon Ave Worcester, MA | 1.0–2.0 | 1.0 | 800 | $2,440 | $3.05 | 16d | 24 | 1.03mi |
| 383 Shrewsbury St Worcester, MA | 1.0–2.0 | 1.0–2.0 | 895 | $2,895 | $3.23 | 16d | 3 | 1.17mi |
| 70 Shrewsbury Green Dr Unit K Shrewsbury, MA | 1.0 | 1.0 | 700 | $1,800 | $2.57 | 45d | 1 | 1.18mi |
| 66 Shrewsbury Green Dr Unit J Shrewsbury, MA | 1.0 | 1.0 | 685 | $1,800 | $2.63 | 45d | 1 | 1.21mi |
| 46 Shrewsbury Green Dr Unit B Shrewsbury, MA | 1.0 | 1.0 | 675 | $1,725 | $2.56 | 45d | 1 | 1.23mi |
| 42 Shrewsbury Green Dr Unit F Shrewsbury, MA | 1.0 | 1.0 | 685 | $1,750 | $2.55 | 45d | 1 | 1.24mi |
| 54 Shrewsbury Green Dr Unit L Shrewsbury, MA | 1.0 | 1.0 | 685 | $1,800 | $2.63 | 45d | 1 | 1.24mi |
| 52J Shrewsbury Green Dr Unit 52J Shrewsbury, MA | 1.0 | 1.0 | 685 | $2,000 | $2.92 | 45d | 1 | 1.24mi |
| 12 Shrewsbury Green Dr Unit G Shrewsbury, MA | 1.0 | 1.0 | 685 | $1,800 | $2.63 | 45d | 1 | 1.26mi |
| 36 Shrewsbury Green Dr Unit G Shrewsbury, MA | 1.0 | 1.0 | 655 | $1,800 | $2.75 | 45d | 1 | 1.29mi |
HOA detail condo
- Monthly dues
- $409 · $4,908/yr
- Assessments
- None detected in remarks — confirm with the listing agent.
Listing history 21 events
-
2026-06-22days on market $215,000 Active 66 DOM
-
2026-06-18days on market $215,000 Active 63 DOM
-
2026-06-17days on market $215,000 Active 62 DOM
-
2026-06-16days on market $215,000 Active 61 DOM
-
2026-06-15days on market $215,000 Active 60 DOM
-
2026-06-14days on market $215,000 Active 58 DOM
-
2026-06-10days on market $215,000 Active 55 DOM
-
2026-06-09days on market $215,000 Active 54 DOM
-
2026-06-08days on market $215,000 Active 53 DOM
-
2026-06-07days on market $215,000 Active 52 DOM
-
2026-06-05days on market $215,000 Active 49 DOM
-
2026-06-03days on market $215,000 Active 48 DOM
-
2026-06-02statusdays on market $215,000 Active 47 DOM
-
2026-06-01days on market $215,000 Price Changed 46 DOM
-
2026-05-31days on market $215,000 Price Changed 45 DOM
-
2026-05-31pricestatusdays on market $215,000 Price Changed 44 DOM
-
2026-04-16$220,000 New 753-char remark
Show marketing remark (753 chars)
Welcome to Grafton Hill in Worcester! This beautifully renovated low-rise condo offers a fresh, modern feel with an inviting open layout perfect for everyday living and entertaining. The bright living room features gleaming hardwood floors, seamlessly flowing into a kitchen with dining area, complete with stainless steel appliances! Two comfortable bedrooms and a stylish full bath provide just the right amount of space, while in-unit laundry and central air add everyday convenience. Enjoy the ease of assigned and common parking, along with the added bonus of low-maintenance living—no exterior upkeep to worry about. Ideally located just moments from Quinsigamond Lake State Park, offering easy access to outdoor recreation and scenic views.
-
1999-02-12soldstatus $53,500 179-char remark
Show marketing remark (179 chars)
MIDDLESEX SCHOOL CONDO BUILDING. MINT ! HARDWOODS AND CERAMIC FLOORS IN LIV/DIN RM. OAK KITCHEN. CENTRAL AC LOW CONDO FEE WITH OWNERS IN CHARGE. PLENTY OF STORAGE. DEEDED PARKING
-
1999-02-02soldstatus $53,400
-
1998-12-09historical 179-char remark
Show marketing remark (179 chars)
MIDDLESEX SCHOOL CONDO BUILDING. MINT ! HARDWOODS AND CERAMIC FLOORS IN LIV/DIN RM. OAK KITCHEN. CENTRAL AC LOW CONDO FEE WITH OWNERS IN CHARGE. PLENTY OF STORAGE. DEEDED PARKING
-
1998-11-16$54,900 179-char remark
Show marketing remark (179 chars)
MIDDLESEX SCHOOL CONDO BUILDING. MINT ! HARDWOODS AND CERAMIC FLOORS IN LIV/DIN RM. OAK KITCHEN. CENTRAL AC LOW CONDO FEE WITH OWNERS IN CHARGE. PLENTY OF STORAGE. DEEDED PARKING
ⓘ Source: listings_history table (triggers on properties + properties_extension) + one-shot
backfill from property_details.listing_events for pre-trigger history.
Tax reassessment forecast MA · Partial reset (capped growth)
- Current annual tax
- $1,476 · $123/mo
- Projected year-2 tax
- $2,060 · $172/mo
- Expected delta
- +$584/yr (+$49/mo · 39.6%)
ⓘ Screening estimate from a state-policy table — verify with the county assessor before closing.
Climate risk First Street
- Flood 1/10 Low FEMA zone X (unshaded) · 0% chance over 30 yrs
- Wildfire 1/10 Low
- Heat 4/10 Moderate 7 d/yr ≥94°F today · 16 d/yr by 30 yrs out
- Wind 6/10 Major 27% chance of damaging wind over 30 yrs
- Air quality 2/10 Low 1 unhealthy d/yr today · 2 by 30 yrs out
Nearby sold comps map
Loading sold comps map…
Walkable amenities ~0.75 mi
Loading nearby amenities…
Taxation est. · year 1
- Rental income
- $24,727
- − Mortgage interest
- −$12,043
- − Property taxes
- −$1,476
- − Insurance
- −$1,075
- − Repairs & maintenance
- −$1,978
- − Management
- −$1,978
- − HOA
- −$4,908
- − Depreciation
- −$6,255
- Taxable loss
- −$4,986
- Est. tax savings @ 24.0%
- +$1,197
- After-tax cash flow
- $-258/yr
For passive investors: Depreciation is non-cash, so a rental often shows a tax loss while cash-flowing — sheltering income. Rental losses are passive: they offset passive income freely, and up to $25,000/yr can offset ordinary (W-2) income if you actively participate and your MAGI is under $100k (phasing out to $0 by $150k); unused losses carry forward. On sale, claimed depreciation is recaptured at up to 25%, and gains may owe capital-gains tax (a 1031 exchange can defer both). Figures are a year-1 estimate at your 24.0% rate — not tax advice; consult a CPA.
Schools (NCES district)
- District
- Worcester
- NCES district ID
- 2513230
- Math proficiency
- 17% ▼ -15.00%
- Reading proficiency
- 30% ▼ -8.00%
- Median HH income
- $45,063
- Composite
- 20.3/100
- National rank
- #8615
- State rank
- #280 of 302 in MA
Livability — Worcester
- Score
- 87/100
- State rank
- #9
- US rank
- #312
Category grades
Schools grade is shown separately in the Schools card above.
Census & demographics
- Census place
- Worcester, MA
- County
- Worcester County · 487,911 people
- City population
- 207,324
- Metro
- Worcester, MA-CT
- Population (ZIP)
- 39,812
- Household income
- $73,505
- Rent vs Own
- Severe rent burden
- 2232.0
Population outlook (Worcester County) Hauer SSP2
- Today (2025)
- 850,858 people
- By 2030
- 860,403 · +1.1%
- By 2040
- 869,902 · +2.2%
- By 2050
- 869,110 · +2.1%
- By 2075
- 870,120 · +2.3%
- By 2100
- 829,703 · -2.5%
Race, ethnicity, and origin ACS 2023
- Neighborhood character
- Diverse neighborhood (Simpson 0.68)
- Race & ethnicity
- White 51% Hispanic / Latino 19% Black 14% Two or more races 12% Asian 7%
- Hispanic origin (detail)
- Puerto Rican 10% Dominican 3%
- Common ancestry
- Lithuanian 6% Estonian 6% Romanian 4%
- Foreign-born
- 27% · Canada, Vietnam, China
- Languages at home
- 62% English-only · Spanish 13% Other Indo-European 10% Vietnamese 3%
Political lean MEDSL · Worcester
- 2024 margin
- D (+10.0) · D 53.9% · R 43.9% · Other 2.2%
- 2008→2024 swing
- -3.8pp toward R · 2008: 13.8pp · 2024: 10.0pp
- All cycles
- 2024: D+10.0 2020: D+17.8 2016: D+10.5 2012: D+9.2 2008: D+13.8
Not yet ingested
- Civics
- —
Market trends
- HPI YoY
- ▼ -108.38%
- Current HPI
- 295.03
- Rent YoY
- ▲ 2.17%
- Metro
- Worcester, MA-CT
- State GDP YoY
- ▲ 2.28%
- F500 in state
- 38
Industry mix (Fortune 500 HQ in MA)
| Industry | F500 HQs | Revenue |
|---|---|---|
| Technology | 3 | $17B |
|
||
| Insurance | 2 | $84B |
|
||
| Retail | 2 | $76B |
|
||
| Life Sciences | 1 | $43B |
|
||
| Energy Technology | 1 | $31B |
|
||
| Aerospace / Defense | 1 | $18B |
|
||
Price history
+300.7% since first listed5 events — show timeline
- 2026-04-16 Listed $220,000 MLS PIN
- 1999-02-12 Sold (MLS) $53,500 MLS PIN
- 1999-02-02 Sold (Public Records) $53,400 Public Records
- 1998-12-09 Listing Removed — MLS PIN
- 1998-11-16 Listed $54,900 MLS PIN
Property tax history
+0.1%/yrLatest (2023): $1,476 · -6.6% YoY. Source: county tax records.
Cash-flow waterfall
monthlySold comps — $/sqft
last 12 mo · ≤1 miLoading sold comps…