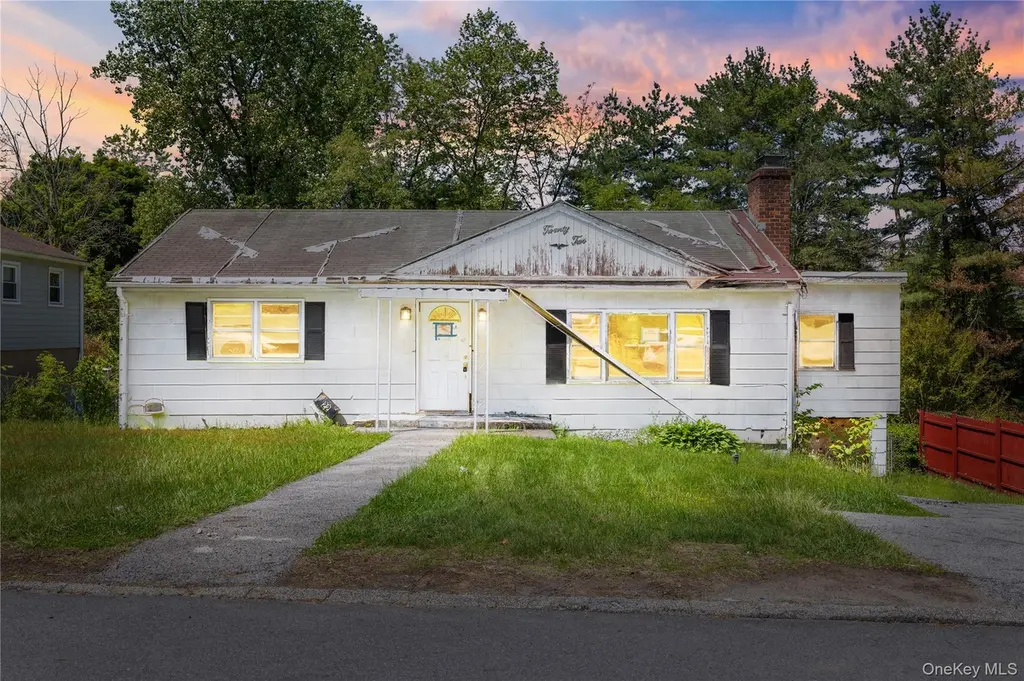
22 N Lawrence Ave · Elmsford, NY
Flood risk 6/10 · Moderate
- FEMA flood zone
- X (unshaded)
- Chance of flooding over 30 yrs
- 0.73%
- Est. flood insurance / yr
- $473 – $860
Fire risk 3/10 · Minor
- Est. fire insurance / yr
- $691 – $1,283
Heat risk 5/10 · Moderate
- Hot days now (above 98°F)
- 7 days/yr
- Hot days in 30 yrs
- 14 days/yr
Wind risk 6/10 · Moderate
- Chance of severe wind over 30 yrs
- 27.0%
Air-quality risk 4/10 · Minor
- Unhealthy air days now
- 4 days/yr
- Unhealthy air days in 30 yrs
- 6 days/yr
Risk factors via First Street. Map © Google.
Why this score? — see what drove the C grade
The composite is a weighted blend of 9 inputs, each scored 0–100. Each bar is that input's sub-score; the figure is the points it added to the 100-point composite (weight × sub-score).
- Cash flow +21.5/30.0
- ARV discount +7.5/15.0
- 1% rule +7.2/10.0
- DSCR +6.9/10.0
- Schools +4.2/10.0
- Rent growth +3.8/5.0
- Livability +3.4/5.0
- Condition / age +2.5/5.0
- Appreciation +0.0/10.0
$299,900
🖨 Deal sheet 📄 Offer letter ✓ Due diligence
Listing remarks
Welcome to this three bedroom, one bathroom ranch located in Elmsford, New York in Westchester County. This eleven hundred seventy two square foot home sits on a nice flat yard and features a walkout basement and an attached one car garage. Conveniently situated just five minutes from White Plains with easy access to the Saw Mill River Parkway, this property offers excellent proximity to restaurants, shops, public transportation, and schools. Please note the property is being sold as-is with no repairs by the seller. The house has been condemned with possible code violations. Cash offers, hard money financing, and renovation loans will be considered. This property does not qualify for conve
Key facts
- Walkout basement
- Flat yard
- 7,405 sq ft lot
Tags
Property features AI
Exterior
- Parking: Attached garage; 1 garage space; No carport
- Utilities: Public sewer; Cable available
- Home design: Single family residence
- Construction: Frame construction
- Exterior features: Frame construction; Not waterfront
Interior
- Bedrooms: Bedroom on the first floor
- Bathrooms: 1 full bathroom
- Heating & cooling: Baseboard heating; No central cooling
- Interior features: First-floor bedroom; First-floor full bathroom; Unfinished walk-out basement; Pull-down attic stairs; 6 total rooms
- Laundry & utility: Oil water heater
Neighborhood map
What this means for you Summary
Snapshot
- This is a 3-bed/1.0-bath single-family listed at $300k.
Deal economics
- At list price, monthly cash flow is $452 ($5k/yr) — positive.
- The deal already cash-flows at list — no discount required.
- Meets the 1% rule at list price ($4k rent vs $300k).
- Recommended offer: $295k (1.5% below list) — sets the bar for market timing.
Location & tenants
- Location reads 68/100 on livability (#521 in NY) — a middle-class / working-renter tenant base. Strengths: commute A+, employment A+, housing A+; Watch: amenities F, cost of living F, health & safety F.
- Elmsford Union Free School District (suburban): math 38% / reading 52% proficiency, ranked #397 of 590 in NY (top 67%) — families likely to look elsewhere, expect single-tenant / working-renter base with shorter leases.
- Zoned schools: Alice E Grady Elementary School (math 27% / reading 57%, grade F, #1,361 of 2,108 statewide, top 67%, 383 students, 0% FRL); Alexander Hamilton High School (math 52% / reading 47%, grade D, #974 of 1,100 statewide, top 91%, 485 students, 53% FRL).
- Market conditions: Rents rising fast (+5.1%/yr); 16 active listings in the ZIP; 8 comparable units currently listed for rent nearby; rentals at typical pace (median 19d on market — plan ~3-4 weeks tenant-placement turnaround); high-income renter base; 954 units permitted in Westchester County in 2024 (649 in 5+ unit buildings).
- This rent runs 37% of the median local income ($118k/yr) — at the standard rent-burdened threshold; future hikes will face affordability resistance.
Forward outlook
- Local home prices are declining (-3.0%/yr); year-one equity from $2k of loan paydown is wiped out by about $9k of value loss. Plan a longer hold.
- Westchester County population projected at +10% by 2050 — modest demand growth; plan on rents tracking national, not racing it.
- At projected returns (-3.0% appreciation + 5.1% rent growth), your $84k cash investment doubles in ~10 years — after that, you're playing with house money.
Negotiation context
- It's been on market 27 days — a 2% lower offer ($295k) is reasonable based on typical stale-listing flexibility.
- 3 sale attempts since 20y ago with the ask held roughly flat each time — persistent listings suggest the price (not the market) is what's stuck; bring a comps-based counter.
- Current owner paid $126k; list at $300k implies a 138% gain — meaningful room to come down on a strong offer.
Risks & watch-outs
- Watch-outs: property tax is 3.0% of price.
- Climate carrying-cost: major flood risk; major wind risk, 27% chance of damaging wind over 30y; extreme-heat days projected 7→14/yr by 2055 (HVAC capex compounding) — expect insurance premiums to compound above CPI over the hold.
Questions for the listing agent
- Built in 1961 — when were the roof, HVAC, electrical panel, plumbing, and water heater last replaced?
- Property tax is high relative to price — has the assessment been appealed recently, and will the sale trigger a re-assessment?
- Is there a deadline driving the sale (1031 exchange, divorce, estate, relocation)? That informs how much negotiation room exists.
- What's the average days-on-market for RENTAL listings here right now (not sales)? A rising rental-DOM trend means longer vacancies and softer asking-rent achievability than the comps imply.
- What's the recent tenant-quality profile in this submarket — average credit score on applications, eviction rate, late-payment / NSF rate, and stable-employment percentage? A property-management company in the area should have these aggregated.
- How much new for-sale + rental construction is in the pipeline within 1–3 miles? Heavy new supply typically softens prices + rents 12–24 months out; constrained supply supports both.
Investment metrics
- 1% rule
- 1.22% ✓
- Cap rate
- 8.10%
- Cash-on-cash
- 6.46%
- DSCR
- 1.29
- GRM
- 6.8
CMA / ARV
- ARV (on-the-fly)
- $638,740
- Comps found
- 4
Show comp detail 4 sales within ~0.75 mi
| Address | Dist | Beds/Ba | Sqft | Sold | Price | $/sf | Match |
|---|---|---|---|---|---|---|---|
| 67 Sears Ave | 0.46mi | 3/1.0 | 1,200 (+2%) | 15mo | $586,500 | $489 | 62 |
| 112 Cabot Ave | 0.27mi | 4/2.0 (+1) | 1,248 (+6%) | 8mo | $680,000 | $545 | 61 |
| 16 S Lawrence Ave | 0.19mi | 2/3.0 (-1) | 1,100 (-6%) | 11mo | $600,000 | $545 | 59 |
| 52 Sears Ave | 0.50mi | 3/2.5 | 1,344 (+15%) | 2mo | $700,000 | $521 | 44 |
Match score weights: distance 35% · size 25% · config 20% · recency 20%. Top-matched comps best support the ARV.
Projected returns pro-forma
-3.0% appreciation · 5.11% rent growth · sell at horizon
- IRR
- -3.6%
- Equity multiple
- 0.86×
- Total profit
- $-11,546
- Equity at exit
- $44,716
- IRR
- 8.7%
- Equity multiple
- 1.74×
- Total profit
- $62,308
- Equity at exit
- $25,930
Cash invested: $83,972 (down + closing). Projections, not guarantees.
Landlord ↔ Tenant lean methodology
- Overall (STATE)
- 15 Strongly Tenant-Friendly
- State New York
- 15 Strongly Tenant-Friendly · D+10
- County
- — inherits STATE
- City
- — inherits STATE
ZIP-level market 10523
- Home prices YoY
- -20.6%
- Rents YoY
- 5.1%
- Active inventory
- 16
- Price-to-rent
- 6.8×
Monthly cashflow live
- Estimated rent
- $3,673 high interval (Pro) →
- Mortgage (P&I)
- −$1,573
- Tax from tax record
- −$751 /mo · $9,018/yr
- Insurance
- −$125
- HOA
- −$0
- Vacancy / Maint / Mgmt
- −$771
- Net cashflow
- $452
Break-even live
UW: 25.0% down · 7.5% · 30yr · 1.5% tax · 5.0% vac · 8.0% maint · 8.0% mgmt
Financing live
Cash to close
- Down payment
- $74,975
- Closing costs
- $8,997
- Reserves months
- —
- Total cash needed
- —
Loan-product check · same deal, 3 products live
Conventional
25% down · 7.5% · 30yr
- Down + closing
- —
- Monthly P&I
- —
- Monthly cashflow
- —
- DSCR
- —
- Eligible?
- —
Personal DTI + credit; lowest rate.
DSCR
20% down · 8.5% · 30yr
- Down + closing
- —
- Monthly P&I
- —
- Monthly cashflow
- —
- DSCR
- —
- Eligible?
- —
No personal income docs; deal must DSCR.
Hard money
10% down · 12.0% · 12mo
- Down + closing
- —
- Monthly P&I
- —
- Monthly cashflow
- —
- DSCR
- —
- Eligible?
- —
Short-term bridge; refi at stabilization.
Rent comps 8 comps
| Address | Beds | Baths | Sqft | Rent | $/sqft | DOM | Units | Dist |
|---|---|---|---|---|---|---|---|---|
| 914 Old Country Rd Elmsford, NY | 2.0 | 1.0 | 840 | $2,700 | $3.21 | 43d | 1 | 0.35mi |
| 32 Nob Hill Dr Elmsford, NY | 1.0–3.0 | 1.0–2.0 | 978 | $4,400 | $4.50 | 1d | 14 | 1.07mi |
| 13 Granada Cres #1 White Plains, NY | 2.0 | 2.0 | 1100 | $3,500 | $3.18 | 24d | 1 | 1.08mi |
| 35 S Lawn Ave Unit 3 Elmsford, NY | 2.0 | 1.0 | 815 | $2,650 | $3.25 | 18d | 1 | 1.11mi |
| 290 E Main St Elmsford, NY | 2.0 | 2.0 | 1086 | $3,932 | $3.62 | 1d | 1 | 1.17mi |
| 58 S Stone Ave Elmsford, NY | 2.0 | 1.0 | 900 | $2,950 | $3.28 | 24d | 1 | 1.22mi |
| 846 Hartsdale Rd White Plains, NY | 3.0 | 2.5 | 1500 | $5,200 | $3.47 | 17d | 1 | 1.45mi |
| 500 Town Green Dr Elmsford, NY | 1.0–2.0 | 1.0–2.5 | 1209 | $6,410 | $5.30 | 1d | 38 | 1.47mi |
Listing history 19 events
-
2026-06-18days on market $299,900 Active 27 DOM
-
2026-06-17days on market $299,900 Active 26 DOM
-
2026-06-16days on market $299,900 Active 25 DOM
-
2026-06-15days on market $299,900 Active 24 DOM
-
2026-06-13days on market $299,900 Active 22 DOM
-
2026-06-09days on market $299,900 Active 18 DOM
-
2026-06-08days on market $299,900 Active 17 DOM
-
2026-06-07days on market $299,900 Active 16 DOM
-
2026-06-04days on market $299,900 Active 13 DOM
-
2026-06-03days on market $299,900 Active 12 DOM
-
2026-06-02days on market $299,900 Active 11 DOM
-
2026-06-01days on market $299,900 Active 10 DOM
-
2026-05-31days on market $299,900 Active 9 DOM
-
2026-05-21$299,900 Active
-
2020-04-01historical
-
2019-10-18$400,000 Active
-
2006-09-09historical
-
2006-03-09
-
1998-01-06soldstatus $126,000
ⓘ Source: listings_history table (triggers on properties + properties_extension) + one-shot
backfill from property_details.listing_events for pre-trigger history.
Tax reassessment forecast NY · Partial reset (capped growth)
- Current annual tax
- $9,018 · $751/mo
- Projected year-2 tax
- $9,018 · $751/mo
- Expected delta
- $0/yr ($0/mo · 0.0%)
ⓘ Screening estimate from a state-policy table — verify with the county assessor before closing.
Climate risk First Street
- Flood 6/10 Major FEMA zone X (unshaded) · 73% chance over 30 yrs
- Wildfire 3/10 Moderate
- Heat 5/10 Major 7 d/yr ≥98°F today · 14 d/yr by 30 yrs out
- Wind 6/10 Major 27% chance of damaging wind over 30 yrs
- Air quality 4/10 Moderate 4 unhealthy d/yr today · 6 by 30 yrs out
Nearby sold comps map
Loading sold comps map…
Walkable amenities ~0.75 mi
Loading nearby amenities…
Taxation est. · year 1
- Rental income
- $44,072
- − Mortgage interest
- −$16,799
- − Property taxes
- −$9,018
- − Insurance
- −$1,500
- − Repairs & maintenance
- −$3,526
- − Management
- −$3,526
- − Depreciation
- −$8,724
- Taxable income
- $979
- Est. tax owed @ 24.0%
- −$235
- After-tax cash flow
- $5,192/yr
For passive investors: Depreciation is non-cash, so a rental often shows a tax loss while cash-flowing — sheltering income. Rental losses are passive: they offset passive income freely, and up to $25,000/yr can offset ordinary (W-2) income if you actively participate and your MAGI is under $100k (phasing out to $0 by $150k); unused losses carry forward. On sale, claimed depreciation is recaptured at up to 25%, and gains may owe capital-gains tax (a 1031 exchange can defer both). Figures are a year-1 estimate at your 24.0% rate — not tax advice; consult a CPA.
Schools (NCES district)
- District
- Elmsford Union Free School District
- NCES district ID
- 3610650
- Math proficiency
- 38% ▼ -9.00%
- Reading proficiency
- 52% ▲ 2.00%
- Median HH income
- $87,488
- Composite
- 42.17/100
- National rank
- #3295
- State rank
- #397 of 590 in NY
Livability — Elmsford
- Score
- 68/100
- State rank
- #521
- US rank
- #9232
Category grades
Schools grade is shown separately in the Schools card above.
Census & demographics
- County
- Westchester County · 709,332 people
- City population
- 9,450
- Metro
- New York-Newark-Jersey City, NY-NJ-PA
- Population (ZIP)
- 9,450
- Household income
- $118,438
- Rent vs Own
- Severe rent burden
- 413.0
Population outlook (Westchester County) Hauer SSP2
- Today (2025)
- 1,028,035 people
- By 2030
- 1,051,636 · +2.3%
- By 2040
- 1,098,520 · +6.9%
- By 2050
- 1,136,044 · +10.5%
- By 2075
- 1,196,925 · +16.4%
- By 2100
- 1,175,147 · +14.3%
Race, ethnicity, and origin ACS 2023
- Neighborhood character
- Highly diverse neighborhood (Simpson 0.72)
- Race & ethnicity
- Hispanic / Latino 40% White 27% Black 20% Two or more races 12% Asian 11%
- Hispanic origin (detail)
- Mexican 4% Puerto Rican 6% Dominican 4%
- Common ancestry
- Lithuanian 2% Romanian 2% Italian 1%
- Foreign-born
- 30% · Canada, Jamaica, Dominican Republic
- Languages at home
- 59% English-only · Spanish 29% Other Asian/Pacific 4% Other Indo-European 3%
Political lean MEDSL · Westchester
- 2024 margin
- Strong D (+26.3) · D 63.1% · R 36.9%
- 2008→2024 swing
- -1.3pp toward R · 2008: 27.6pp · 2024: 26.3pp
- All cycles
- 2024: D+26.3 2020: D+36.3 2016: D+32.8 2012: D+22.2 2008: D+27.6
Not yet ingested
- Civics
- —
Market trends
- HPI YoY
- ▼ -65.00%
- Current HPI
- 251.3188
- Rent YoY
- ▲ 5.11%
- Metro
- New York-Newark-Jersey City, NY-NJ-PA
- State GDP YoY
- ▲ 2.60%
- F500 in state
- 92
Industry mix (Fortune 500 HQ in NY)
| Industry | F500 HQs | Revenue |
|---|---|---|
| Financial Services | 10 | $950B |
|
||
| Consumer Goods | 9 | $162B |
|
||
| Insurance | 4 | $225B |
|
||
| Telecommunications | 2 | $144B |
|
||
| Pharmaceuticals | 2 | $112B |
|
||
| Media / Entertainment | 2 | $69B |
|
||
Price history
+138.0% since first listed6 events — show timeline
- 2026-05-21 Listed $299,900 OneKey® MLS as Distributed by MLS Grid
- 2020-04-01 Listing Removed — OneKey® MLS as Distributed by MLS Grid
- 2019-10-18 Listed $400,000 OneKey® MLS as Distributed by MLS Grid
- 2006-09-09 Delisted — HGMLS
- 2006-03-09 Listed — HGMLS
- 1998-01-06 Sold (Public Records) $126,000 Public Records
Property tax history
-1.4%/yrLatest (2025): $9,018 · -7.8% YoY. Source: county tax records.
Cash-flow waterfall
monthlySold comps — $/sqft
last 12 mo · ≤1 miLoading sold comps…