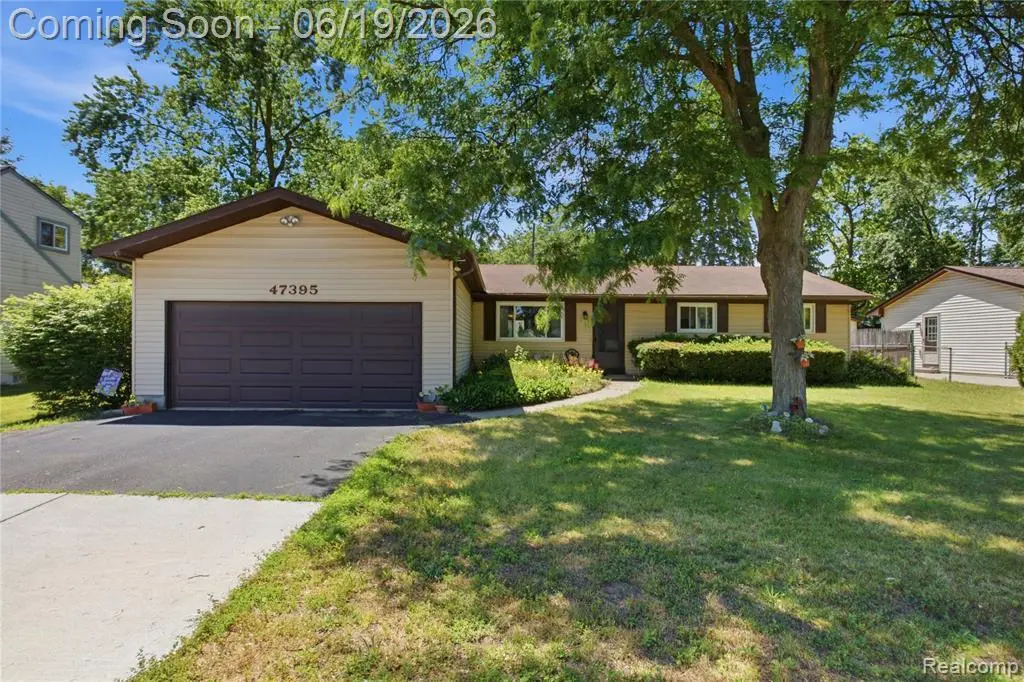
47395 Dequindre Rd · Rochester Hills, MI
Flood risk 1/10 · Minimal
- FEMA flood zone
- X (unshaded)
- Chance of flooding over 30 yrs
- 0.0%
- Est. flood insurance / yr
- $507 – $1,088
Fire risk 1/10 · Minimal
- Est. fire insurance / yr
- $784 – $1,456
Heat risk 3/10 · Minor
- Hot days now (above 97°F)
- 7 days/yr
- Hot days in 30 yrs
- 15 days/yr
Wind risk 2/10 · Minimal
- Chance of severe wind over 30 yrs
- —
Air-quality risk 3/10 · Minor
- Unhealthy air days now
- 3 days/yr
- Unhealthy air days in 30 yrs
- 4 days/yr
Risk factors via First Street. Map © Google.
Why this score? — see what drove the C- grade
The composite is a weighted blend of 9 inputs, each scored 0–100. Each bar is that input's sub-score; the figure is the points it added to the 100-point composite (weight × sub-score).
- ARV discount +15.0/15.0
- Cash flow +11.9/30.0
- Schools +5.9/10.0
- Appreciation +5.0/10.0
- Livability +3.9/5.0
- DSCR +3.5/10.0
- 1% rule +2.6/10.0
- Rent growth +2.5/5.0
- Condition / age +2.5/5.0
$250,000
🖨 Deal sheet 📄 Offer letter ✓ Due diligence
Listing remarks MLS
Welcome to this well-maintained 3-bedroom, 1-bath ranch offering approximately 1,560 square feet of comfortable living space. A spacious family room with a gas fireplace provides the perfect setting for everyday living, entertaining, or gathering with family and friends. The home also features a living room, an eat-in kitchen, and a practical layout designed for convenience. Outside, enjoy a fenced backyard with a patio, storage shed, and attractive landscaping featuring established perennial gardens. Additional highlights include a 2-car attached garage and a furnace updated in 2024. Conveniently located within the Rochester School District.
Key facts
- Perennial gardens
- Gas fireplace
- Storage shed
Tags
Property features AI
Exterior
- Parking: Attached 2-car garage
- Utilities: Public water (at street) and private well listed; Public sewer at street; Electric service details not specified
- Home design: Single-story residential home; Built in 1977; Facing/entry direction not specified
- Construction: Brick exterior; Crawl foundation
- Exterior features: Fenced yard; Paved street access
Interior
- Kitchen: Kitchen (Entry level) — 8 x 10; Dishwasher; Refrigerator; Gas range or cooktop not specified
- Bedrooms: Bedroom 1 (Entry level) — 11 x 10; Bedroom 2 (Entry level) — 9 x 10; Bedroom 3 (Entry level) — 10 (width listed)
- Bathrooms: 1 full bathroom (Entry level) — approx. 6 x 10
- Heating & cooling: Forced air heating; Central A/C; Natural gas fuel; Gas water heater
- Interior features: Gas fireplace; 9 total rooms
- Laundry & utility: Washer; Dryer; Laundry room (Entry level) — 4 x 10
Neighborhood map
What this means for you Summary
Snapshot
- This is a 3-bed/1.0-bath single-family listed at $250k.
Deal economics
- At list price, monthly cash flow is $-63 ($-754/yr) — negative.
- To cash-flow at today's rent, offer at most $239k (4.4% below list).
- To meet the 1% rule (rent ≥ 1% of price), the offer needs to be $190k (23.9% below list).
- Recommended offer: $190k (23.9% below list) — sets the bar for 1% rule.
- Cap rate 6.0% vs local median 3.2% in Rochester Hills — top-decile yield for the area; either an underpriced asset or a hidden risk that comps aren't pricing in. Stress-test before assuming the spread holds.
Location & tenants
- Location reads 77/100 on livability (#127 in MI, #3,163 nationally) — a middle-class / working-renter tenant base. Strengths: crime A+, employment A+, housing A+; Watch: health & safety D, amenities F, commute F.
- Rochester Community School District (suburban): math 60% / reading 69% proficiency, ranked #21 of 540 in MI (top 4%) — acceptable for families but not a draw, mixed tenant base, ~2y average lease; only 10% free/reduced lunch — higher-income household profile.
- Market conditions: 1 active listings in the ZIP; 5 comparable units currently listed for rent nearby; rentals leasing fast (median 5d on market — plan ~1-2 weeks tenant-placement turnaround); 2,614 units permitted in Oakland County in 2024 (721 in 5+ unit buildings).
Forward outlook
- In year one you build about $9k of equity ($2k loan paydown + $8k appreciation (3.0% local appreciation)).
- Oakland County population projected at +10% by 2050 — modest demand growth; plan on rents tracking national, not racing it.
- At projected returns (3.0% appreciation + 3.0% rent growth), your $70k cash investment doubles in ~7 years — after that, you're playing with house money.
- By year 4, paydown + projected appreciation supports a ~$31k cash-out refi (75% LTV) — recoverable capital for the next deal without selling this one.
Negotiation context
- Only 1 days on market — expect competitive offers; lowballing is unlikely to land.
- 20 sale attempts since 21y ago with the ask held roughly flat each time — persistent listings suggest the price (not the market) is what's stuck; bring a comps-based counter.
- Current owner paid $151k; list at $250k implies a 66% gain — meaningful room to come down on a strong offer.
Questions for the listing agent
- What do current leases actually rent for vs. the listed asking? Can we see a recent rent roll and the last 12 months of T-12 income?
- Built in 1977 — when were the roof, HVAC, electrical panel, plumbing, and water heater last replaced?
- Is there a deadline driving the sale (1031 exchange, divorce, estate, relocation)? That informs how much negotiation room exists.
- Schools are A-rated — typically a magnet for longer-tenancy family renters. What's the average tenant stay here, and is there a school-zone premium baked into asking?
- What's the average days-on-market for RENTAL listings here right now (not sales)? A rising rental-DOM trend means longer vacancies and softer asking-rent achievability than the comps imply.
- What's the recent tenant-quality profile in this submarket — average credit score on applications, eviction rate, late-payment / NSF rate, and stable-employment percentage? A property-management company in the area should have these aggregated.
- How much new for-sale + rental construction is in the pipeline within 1–3 miles? Heavy new supply typically softens prices + rents 12–24 months out; constrained supply supports both.
Investment metrics
- 1% rule
- 0.76% ✗
- Cap rate
- 5.99%
- Cash-on-cash
- -1.08%
- DSCR
- 0.95
- GRM
- 10.9
CMA / ARV
- ARV (on-the-fly)
- $318,240
- Comps found
- 12
Show comp detail 12 sales within ~0.75 mi
| Address | Dist | Beds/Ba | Sqft | Sold | Price | $/sf | Match |
|---|---|---|---|---|---|---|---|
| 2515 Melvin Ave | 0.14mi | 3/1.5 | 1,728 (+11%) | 3mo | $250,000 | $145 | 71 |
| 2552 Melvin Ave | 0.14mi | 3/2.5 | 1,478 (-5%) | 15mo | $430,000 | $291 | 66 |
| 2566 Dawes Ave | 0.40mi | 3/1.5 | 1,675 (+7%) | 1mo | $279,900 | $167 | 66 |
| 3024 Longview Ave | 0.57mi | 3/2.0 | 1,590 (+2%) | 1mo | $287,000 | $181 | 66 |
| 2875 Longview Ave | 0.42mi | 4/1.0 (+1) | 1,460 (-6%) | 1mo | $275,500 | $189 | 64 |
| 3000 Longview Ave | 0.54mi | 3/2.0 | 1,495 (-4%) | 9mo | $318,000 | $213 | 56 |
| 2420 Emmons Ave | 0.47mi | 4/2.0 (+1) | 1,664 (+7%) | 2mo | $225,000 | $135 | 56 |
| 46329 Huling St | 0.62mi | 3/1.0 | 1,365 (-12%) | 1mo | $290,000 | $212 | 50 |
| 2475 Culbertson Ave | 0.49mi | 4/2.0 (+1) | 1,420 (-9%) | 13mo | $303,500 | $214 | 42 |
| 3240 Melvin Ave | 0.60mi | 4/2.0 (+1) | 1,667 (+7%) | 11mo | $259,900 | $156 | 42 |
| 2621 Weaverton St | 0.59mi | 3/2.0 | 1,326 (-15%) | 12mo | $299,900 | $226 | 33 |
| 2784 Frankson Ave | 0.70mi | 2/2.0 (-1) | 1,400 (-10%) | 13mo | $286,000 | $204 | 30 |
Match score weights: distance 35% · size 25% · config 20% · recency 20%. Top-matched comps best support the ARV.
Projected returns pro-forma
3.0% appreciation · 3.0% rent growth · sell at horizon
- IRR
- 6.5%
- Equity multiple
- 1.37×
- Total profit
- $26,045
- Equity at exit
- $112,411
- IRR
- 9.3%
- Equity multiple
- 2.40×
- Total profit
- $98,266
- Equity at exit
- $173,238
Cash invested: $70,000 (down + closing). Projections, not guarantees.
Landlord ↔ Tenant lean methodology
- Overall (STATE)
- 62 Landlord-Friendly
- State Michigan
- 62 Landlord-Friendly · EVEN
- County
- — inherits STATE
- City
- — inherits STATE
ZIP-level market 48307 4812
- Active inventory
- 1
- Price-to-rent
- 10.9×
Monthly cashflow live
- Estimated rent
- $1,903 high interval (Pro) →
- Mortgage (P&I)
- −$1,311
- Tax from tax record
- −$151 /mo · $1,811/yr
- Insurance
- −$104
- HOA
- −$0
- Vacancy / Maint / Mgmt
- −$400
- Net cashflow
- $-63
Break-even live
Sensitivity live
| Price | -10% $79 | -5% $8 | +0% $-63 | +5% $-134 | +10% $-204 |
|---|---|---|---|---|---|
| Rent | -10% $-213 | -5% $-138 | +0% $-63 | +5% $12 | +10% $88 |
| Rate | -1.0pp $63 | -0.5pp $1 | base $-63 | +0.5pp $-128 | +1.0pp $-194 |
UW: 25.0% down · 7.5% · 30yr · 1.5% tax · 5.0% vac · 8.0% maint · 8.0% mgmt
Financing live
Cash to close
- Down payment
- $62,500
- Closing costs
- $7,500
- Reserves months
- —
- Total cash needed
- —
Loan-product check · same deal, 3 products live
Conventional
25% down · 7.5% · 30yr
- Down + closing
- —
- Monthly P&I
- —
- Monthly cashflow
- —
- DSCR
- —
- Eligible?
- —
Personal DTI + credit; lowest rate.
DSCR
20% down · 8.5% · 30yr
- Down + closing
- —
- Monthly P&I
- —
- Monthly cashflow
- —
- DSCR
- —
- Eligible?
- —
No personal income docs; deal must DSCR.
Hard money
10% down · 12.0% · 12mo
- Down + closing
- —
- Monthly P&I
- —
- Monthly cashflow
- —
- DSCR
- —
- Eligible?
- —
Short-term bridge; refi at stabilization.
Rent comps 5 comps
| Address | Beds | Baths | Sqft | Rent | $/sqft | DOM | Units | Dist |
|---|---|---|---|---|---|---|---|---|
| 2427 Partridge Dr Shelby Township, MI | 2.0 | 2.0 | 1438 | $1,920 | $1.33 | 5d | 6 | 0.51mi |
| 46280 Dequindre Rd Shelby Township, MI | 1.0–3.0 | 1.0–1.5 | 912 | $1,650 | $1.81 | 4d | 14 | 0.57mi |
| 3113 Emmons Ave Rochester Hills, MI | 2.0 | 2.0 | 1200 | $1,800 | $1.50 | 17d | 1 | 0.64mi |
| 1901 Village Green Blvd Rochester Hills, MI | 3.0 | 1.0–2.0 | 1025 | $2,509 | $2.45 | 2d | 28 | 0.80mi |
| 1750 Melville Dr Rochester Hills, MI | 1.0–2.0 | 1.0–2.0 | 875 | $1,639 | $1.87 | 3d | 1 | 1.04mi |
Listing history 2 events
-
2026-06-18remarks 650-char remark
-
2026-06-18$250,000 Coming Soon 1 DOM
ⓘ Source: listings_history table (triggers on properties + properties_extension) + one-shot
backfill from property_details.listing_events for pre-trigger history.
Tax reassessment forecast MI · Partial reset (capped growth)
- Current annual tax
- $1,811 · $151/mo
- Projected year-2 tax
- $2,831 · $236/mo
- Expected delta
- +$1,019/yr (+$85/mo · 56.3%)
ⓘ Screening estimate from a state-policy table — verify with the county assessor before closing.
Climate risk First Street
- Flood 1/10 Low FEMA zone X (unshaded) · 0% chance over 30 yrs
- Wildfire 1/10 Low
- Heat 3/10 Moderate 7 d/yr ≥97°F today · 15 d/yr by 30 yrs out
- Wind 2/10 Low
- Air quality 3/10 Moderate 3 unhealthy d/yr today · 4 by 30 yrs out
Nearby sold comps map
Loading sold comps map…
Walkable amenities ~0.75 mi
Loading nearby amenities…
Taxation est. · year 1
- Rental income
- $22,835
- − Mortgage interest
- −$14,004
- − Property taxes
- −$1,811
- − Insurance
- −$1,250
- − Repairs & maintenance
- −$1,827
- − Management
- −$1,827
- − Depreciation
- −$7,273
- Taxable loss
- −$5,156
- Est. tax savings @ 24.0%
- +$1,238
- After-tax cash flow
- $484/yr
For passive investors: Depreciation is non-cash, so a rental often shows a tax loss while cash-flowing — sheltering income. Rental losses are passive: they offset passive income freely, and up to $25,000/yr can offset ordinary (W-2) income if you actively participate and your MAGI is under $100k (phasing out to $0 by $150k); unused losses carry forward. On sale, claimed depreciation is recaptured at up to 25%, and gains may owe capital-gains tax (a 1031 exchange can defer both). Figures are a year-1 estimate at your 24.0% rate — not tax advice; consult a CPA.
Schools (NCES district)
- District
- Rochester Community School District
- NCES district ID
- 2629940
- Math proficiency
- 60% ▼ -9.00%
- Reading proficiency
- 69% ▼ -4.00%
- Median HH income
- $89,242
- Composite
- 58.53/100
- National rank
- #994
- State rank
- #21 of 540 in MI
Livability — Rochester Hills
- Score
- 77/100
- State rank
- #127
- US rank
- #3163
Category grades
Schools grade is shown separately in the Schools card above.
Census & demographics
- Census place
- Rochester Hills, MI
Population outlook (Oakland County) Hauer SSP2
- Today (2025)
- 1,335,747 people
- By 2030
- 1,375,100 · +2.9%
- By 2040
- 1,435,385 · +7.5%
- By 2050
- 1,469,250 · +10.0%
- By 2075
- 1,531,946 · +14.7%
- By 2100
- 1,450,485 · +8.6%
Not yet ingested
- Political lean
- —
- Race & ethnicity
- —
- Common origin
- —
- Civics
- —
Market trends
- HPI YoY
- —
- Current HPI
- —
- Rent YoY
- —
- Metro
- —
- State GDP YoY
- ▲ 1.37%
- F500 in state
- 28
Industry mix (Fortune 500 HQ in MI)
| Industry | F500 HQs | Revenue |
|---|---|---|
| Automotive Parts | 3 | $48B |
|
||
| Automotive | 2 | $372B |
|
||
| Chemicals | 1 | $45B |
|
||
| Automotive Retail | 1 | $29B |
|
||
| Healthcare / Medical Devices | 1 | $23B |
|
||
| Automotive Technology | 1 | $20B |
|
||
Price history
+284.6% since first listed43 events — show timeline
- 2026-06-19 Listed $250,000 MiRealSource-MiMLS
- 2026-06-19 Listed $250,000 REALCOMP
- 2026-06-18 Coming Soon $250,000 MiRealSource-MiMLS
- 2015-01-16 Listing Removed — MiRealSource-MiMLS
- 2015-01-16 Listing Removed — REALCOMP
- 2014-12-12 Listed $149,900 MiRealSource-MiMLS
- 2014-07-15 Listed $149,900 REALCOMP
- 2008-01-07 Listing Removed — REALCOMP
- 2007-12-10 Listing Removed — MiRealSource-MiMLS
- 2007-11-30 Listed $159,900 REALCOMP
- 2007-11-27 Listing Removed — REALCOMP
- 2007-11-15 Listing Removed — MiRealSource-MiMLS
- 2007-11-01 Listed $159,900 MiRealSource-MiMLS
- 2007-10-27 Listing Removed — REALCOMP
- 2007-10-27 Listed $159,900 REALCOMP
- 2007-07-27 Listing Removed — REALCOMP
- 2007-07-27 Listed $159,900 REALCOMP
- 2007-04-30 Listed $159,900 MiRealSource-MiMLS
- 2007-04-27 Listed $159,900 REALCOMP
- 2007-04-26 Listing Removed — REALCOMP
- 2007-04-26 Listing Removed — MiRealSource-MiMLS
- 2007-01-19 Listed $159,900 REALCOMP
- 2007-01-19 Listed $159,900 MiRealSource-MiMLS
- 2007-01-17 Listing Removed — MiRealSource-MiMLS
- 2007-01-16 Listing Removed — REALCOMP
- 2006-09-26 Listed $164,900 REALCOMP
- 2006-09-26 Listed $164,900 MiRealSource-MiMLS
- 2006-09-16 Listing Removed — REALCOMP
- 2006-09-16 Listing Removed — MiRealSource-MiMLS
- 2006-03-16 Listed $164,900 REALCOMP
- 2006-03-16 Listed $175,900 MiRealSource-MiMLS
- 2006-03-14 Listing Removed — MiRealSource-MiMLS
- 2006-03-14 Listing Removed — REALCOMP
- 2006-02-23 Listing Removed — REALCOMP
- 2006-02-15 Listed $175,900 REALCOMP
- 2005-12-14 Listing Removed — MiRealSource-MiMLS
- 2005-12-14 Listed $164,900 MiRealSource-MiMLS
- 2005-09-14 Listed $175,900 MiRealSource-MiMLS
- 2005-09-14 Listed $175,900 REALCOMP
- 2000-12-12 Sold (Public Records) $151,000 Public Records
- 1990-09-05 Sold (Public Records) $79,000 Public Records
- 1988-11-01 Sold (Public Records) $65,000 Public Records
- 1986-11-01 Sold (Public Records) $65,000 Public Records
Property tax history
+1.9%/yrLatest (2025): $1,811 · +4.3% YoY. Source: county tax records.
Cash-flow waterfall
monthlySold comps — $/sqft
last 12 mo · ≤1 miLoading sold comps…