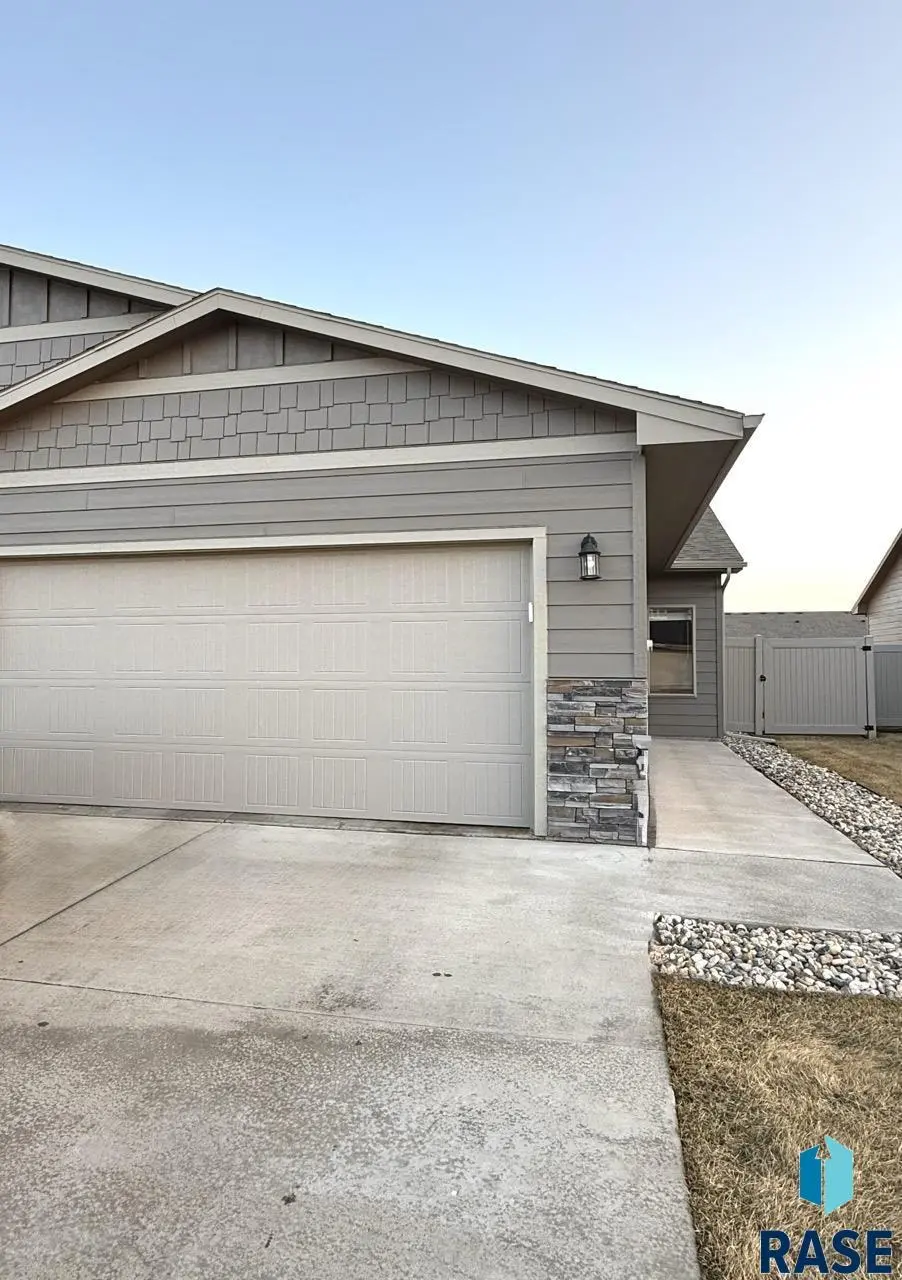
115 E Ivy Rd Rd · Tea, SD
Flood risk 1/10 · Minimal
- FEMA flood zone
- X (unshaded)
- Chance of flooding over 30 yrs
- 0.0%
- Est. flood insurance / yr
- $507 – $1,088
Fire risk 2/10 · Minimal
- Est. fire insurance / yr
- $1,342 – $2,492
Heat risk 2/10 · Minimal
- Hot days now (above 99°F)
- 7 days/yr
- Hot days in 30 yrs
- 14 days/yr
Wind risk 2/10 · Minimal
- Chance of severe wind over 30 yrs
- —
Air-quality risk 2/10 · Minimal
- Unhealthy air days now
- 1 days/yr
- Unhealthy air days in 30 yrs
- 1 days/yr
Risk factors via First Street. Map © Google.
Why this score? — see what drove the D- grade
The composite is a weighted blend of 9 inputs, each scored 0–100. Each bar is that input's sub-score; the figure is the points it added to the 100-point composite (weight × sub-score).
- ARV discount +15.0/15.0
- Schools +5.2/10.0
- Appreciation +5.0/10.0
- Cash flow +4.4/30.0
- Livability +3.7/5.0
- Rent growth +2.5/5.0
- Condition / age +2.5/5.0
- 1% rule +0.6/10.0
- DSCR +0.0/10.0
$290,000
🖨 Deal sheet 📄 Offer letter ✓ Due diligence
Listing remarks MLS
This 3-bedroom townhome features a main-floor master suite and a desirable loft-style layout. The upper level offers two additional bedrooms, a full bath, and a spacious loft ideal for an office or additional living space.
Key facts
- Custom kitchen
- Loft-style layout
- Vaulted ceilings
Tags
Neighborhood map
What this means for you Summary
Snapshot
- This is a 3-bed/2.5-bath single-family listed at $290k.
Deal economics
- At list price, monthly cash flow is $-764 ($-9k/yr) — negative.
- To cash-flow at today's rent, offer at most $155k (46.6% below list).
- To meet the 1% rule (rent ≥ 1% of price), the offer needs to be $162k (44.2% below list).
- Recommended offer: $155k (46.6% below list) — sets the bar for cash-flow.
- Cap rate 3.1% vs local median 1.7% in Tea — top-decile yield for the area; either an underpriced asset or a hidden risk that comps aren't pricing in. Stress-test before assuming the spread holds.
Location & tenants
- Location reads 74/100 on livability (#30 in SD, #4,416 nationally) — a middle-class / working-renter tenant base. Strengths: employment A+, cost of living A+, housing A+; Watch: amenities F, commute F, health & safety D-.
- Tea Area School District 41-5 (rural): math 54% / reading 63% proficiency, ranked #4 of 59 in SD (top 7%) — acceptable for families but not a draw, mixed tenant base, ~2y average lease; only 14% free/reduced lunch — higher-income household profile.
- Market conditions: 1 active listings in the ZIP; 20 comparable units currently listed for rent nearby; rentals leasing fast (median 14d on market — plan ~1-2 weeks tenant-placement turnaround); 45% of comp listings sitting > 30 days — soft ceiling on asking rent; 232 units permitted in Lincoln County in 2024 (14 in 5+ unit buildings).
Forward outlook
- In year one you build about $11k of equity ($2k loan paydown + $9k appreciation (3.0% local appreciation)).
- Lincoln County population projected at +66% by 2050 — long-run rental-demand tailwind backs the buy-and-hold thesis.
- By year 4, paydown + projected appreciation supports a ~$36k cash-out refi (75% LTV) — recoverable capital for the next deal without selling this one.
Negotiation context
- Only 7 days on market — expect competitive offers; lowballing is unlikely to land.
- 3 sale attempts; this cycle's ask has dropped $25k (8%) from the opening price — seller is motivated, your offer sets the floor, not the list.
Questions for the listing agent
- What do current leases actually rent for vs. the listed asking? Can we see a recent rent roll and the last 12 months of T-12 income?
- What does the HOA fee cover, when was the last increase, and are there any pending special assessments or reserve-fund shortfalls?
- Is there a deadline driving the sale (1031 exchange, divorce, estate, relocation)? That informs how much negotiation room exists.
- Schools are A-rated — typically a magnet for longer-tenancy family renters. What's the average tenant stay here, and is there a school-zone premium baked into asking?
- The area grade is low — what's the realistic commute time and amenity access for the typical tenant pool here? Any planned neighborhood developments (good or bad) we should know about?
- What's the average days-on-market for RENTAL listings here right now (not sales)? A rising rental-DOM trend means longer vacancies and softer asking-rent achievability than the comps imply.
- What's the recent tenant-quality profile in this submarket — average credit score on applications, eviction rate, late-payment / NSF rate, and stable-employment percentage? A property-management company in the area should have these aggregated.
- How much new for-sale + rental construction is in the pipeline within 1–3 miles? Heavy new supply typically softens prices + rents 12–24 months out; constrained supply supports both.
Investment metrics
- 1% rule
- 0.56% ✗
- Cap rate
- 3.13%
- Cash-on-cash
- -11.29%
- DSCR
- 0.50
- GRM
- 14.9
CMA / ARV
- ARV (median comp)
- $552,504
- List price
- $290,000
- Delta
- -47.51%
- Verdict
- UNDERPRICED
- Comps
- 20 within 1.0 mi
Show comp detail 12 sales within ~0.75 mi
| Address | Dist | Beds/Ba | Sqft | Sold | Price | $/sf | Match |
|---|---|---|---|---|---|---|---|
| 2310 N Lammers Ave Ave | 0.12mi | 3/2.5 | 1,768 (+6%) | 2mo | $570,000 | $322 | 83 |
| 2430 N Main Ave Ave | 0.15mi | 3/2.0 | 1,787 (+7%) | 0mo | $569,000 | $318 | 79 |
| 505 E Mary Moore Dr | 0.31mi | 3/2.0 | 1,634 (-2%) | 14mo | $550,000 | $337 | 68 |
| 1200 N Rose Ave Ave | 0.43mi | 3/2.0 | 1,750 (+5%) | 5mo | $446,500 | $255 | 66 |
| 1220 N Rose Ave Ave | 0.39mi | 3/2.0 | 1,547 (-7%) | 3mo | $441,000 | $285 | 66 |
| 2330 N Devon Ave | 0.17mi | 3/2.0 | 1,551 (-7%) | 16mo | $409,000 | $264 | 65 |
| 415 E Mary Moore Dr Dr | 0.26mi | 2/2.0 (-1) | 1,513 (-9%) | 3mo | $519,900 | $344 | 63 |
| 1215 N Rose Ave Ave | 0.42mi | 4/3.0 (+1) | 1,613 (-3%) | 8mo | $475,800 | $295 | 61 |
| 2700 N Vermillion Cir Cir | 0.70mi | 3/2.5 | 1,733 (+4%) | 2mo | $655,000 | $378 | 59 |
| 1230 N Poplar Ave Ave | 0.42mi | 2/2.0 (-1) | 1,838 (+10%) | 2mo | $394,800 | $215 | 54 |
| 1000 N Cole Ave | 0.60mi | 4/2.0 (+1) | 1,559 (-6%) | 16mo | $355,000 | $228 | 41 |
| 830 N Rose Ave | 0.72mi | 3/2.0 | 1,431 (-14%) | 22mo | $299,900 | $210 | 23 |
Match score weights: distance 35% · size 25% · config 20% · recency 20%. Top-matched comps best support the ARV.
Projected returns pro-forma
3.0% appreciation · 3.0% rent growth · sell at horizon
- IRR
- -2.9%
- Equity multiple
- 0.83×
- Total profit
- $-13,688
- Equity at exit
- $130,397
- IRR
- 1.6%
- Equity multiple
- 1.24×
- Total profit
- $19,595
- Equity at exit
- $200,957
Cash invested: $81,200 (down + closing). Projections, not guarantees.
Landlord ↔ Tenant lean methodology
- Overall (STATE)
- 83 Strongly Landlord-Friendly
- State South Dakota
- 83 Strongly Landlord-Friendly · R+16
- County
- — inherits STATE
- City
- — inherits STATE
ZIP-level market 57054-2428
- Active inventory
- 1
- Price-to-rent
- 14.9×
Monthly cashflow live
- Estimated rent
- $1,620 high interval (Pro) →
- Mortgage (P&I)
- −$1,521
- Tax from tax record
- −$292 /mo · $3,504/yr
- Insurance
- −$121
- HOA
- −$110
- Vacancy / Maint / Mgmt
- −$340
- Net cashflow
- $-764
Break-even live
UW: 25.0% down · 7.5% · 30yr · 1.5% tax · 5.0% vac · 8.0% maint · 8.0% mgmt
Financing live
Cash to close
- Down payment
- $72,500
- Closing costs
- $8,700
- Reserves months
- —
- Total cash needed
- —
Loan-product check · same deal, 3 products live
Conventional
25% down · 7.5% · 30yr
- Down + closing
- —
- Monthly P&I
- —
- Monthly cashflow
- —
- DSCR
- —
- Eligible?
- —
Personal DTI + credit; lowest rate.
DSCR
20% down · 8.5% · 30yr
- Down + closing
- —
- Monthly P&I
- —
- Monthly cashflow
- —
- DSCR
- —
- Eligible?
- —
No personal income docs; deal must DSCR.
Hard money
10% down · 12.0% · 12mo
- Down + closing
- —
- Monthly P&I
- —
- Monthly cashflow
- —
- DSCR
- —
- Eligible?
- —
Short-term bridge; refi at stabilization.
Rent comps 20 comps
| Address | Beds | Baths | Sqft | Rent | $/sqft | DOM | Units | Dist |
|---|---|---|---|---|---|---|---|---|
| 2235 N Main Ave Unit 1 Tea, SD | 3.0 | 2.0 | 1453 | $1,795 | $1.24 | 43d | 1 | 0.08mi |
| 301 E Ivy Rd Unit 1 Tea, SD | 3.0 | 2.0 | 1337 | $1,748 | $1.31 | 13d | 1 | 0.14mi |
| 2200 N Main Ave Tea, SD | 2.0 | 2.5 | 1330 | $1,361 | $1.02 | 43d | 1 | 0.14mi |
| 2112 N Main Ave Tea, SD | 1.0–3.0 | 1.0–2.5 | 1144 | $2,050 | $1.79 | 13d | 1 | 0.14mi |
| 100 Denver Pl Tea, SD | 2.0–3.0 | 1.5–2.5 | 1375 | $1,700 | $1.24 | 13d | 1 | 0.16mi |
| 2112 N Carla Ave Tea, SD | 2.0 | 2.0 | 1196 | $1,295 | $1.08 | 43d | 1 | 0.17mi |
| 2115 N Carla Ave Unit 305 Tea, SD | 2.0 | 2.0 | 1385 | $1,750 | $1.26 | 43d | 1 | 0.17mi |
| 2230 Devon Ave Tea, SD | 2.0 | 1.0 | 1050 | $1,100 | $1.05 | 13d | 1 | 0.18mi |
| N Carla Ave Tea, SD | 1.0–3.0 | 1.0–2.5 | 1083 | $1,700 | $1.57 | 13d | 11 | 0.37mi |
| 600 W Samantha St Tea, SD | 3.0 | 2.0 | 1400 | $1,775 | $1.27 | 43d | 1 | 0.44mi |
| 100 Tanner Ct Unit 100-4 Tea, SD | 3.0 | 2.0 | 1300 | $1,625 | $1.25 | 13d | 1 | 0.47mi |
| 110 Tanner Ct Tea, SD | 3.0 | 2.0 | 1400 | $1,610 | $1.15 | 43d | 1 | 0.47mi |
| 610 W Samantha St Unit 3 Tea, SD | 3.0 | 2.0 | 1400 | $1,795 | $1.28 | 43d | 1 | 0.48mi |
| 1023 Tanner Ct Tea, SD | 3.0 | 2.5 | 1350 | $1,595 | $1.18 | 43d | 1 | 0.51mi |
| 815 Prescott St Tea, SD | 1.0–3.0 | 1.0–2.0 | 1050 | $1,170 | $1.11 | 13d | 1 | 0.73mi |
| 812 E Brian St Tea, SD | 2.0–3.0 | 2.0 | 1185 | $895 | $0.76 | 43d | 1 | 0.82mi |
| 510 Morgan Ln Tea, SD | 2.0 | 1.0 | 1483 | $1,375 | $0.93 | 13d | 1 | 0.84mi |
| 200 Heritage Pkwy Tea, SD | 1.0–3.0 | 1.0–2.0 | 943 | $1,450 | $1.54 | 13d | 4 | 1.21mi |
| 300 Granite Ave Tea, SD | 1.0–3.0 | 1.0–2.0 | 1041 | $1,890 | $1.82 | 13d | 9 | 1.43mi |
| 231 W 4th St Tea, SD | 3.0 | 2.0 | 1082 | $1,299 | $1.20 | 13d | 1 | 1.44mi |
HOA detail
- Monthly dues
- $110 · $1,320/yr
Listing history 21 events
-
2026-06-18days on market $290,000 Active 7 DOM
-
2026-06-17days on market $290,000 Active 6 DOM
-
2026-06-16days on market $290,000 Active 5 DOM
-
2026-06-15days on market $290,000 Active 4 DOM
-
2026-06-14days on market $290,000 Active 2 DOM
-
2026-06-13days on market $290,000 Active 1 DOM
-
2026-06-10days on market $290,000 Active 92 DOM
-
2026-06-09days on market $290,000 Active 91 DOM
-
2026-06-08days on market $290,000 Active 90 DOM
-
2026-06-07pricedays on market $290,000 Active 89 DOM
-
2026-06-03days on market $300,000 Active 85 DOM
-
2026-06-02days on market $300,000 Active 84 DOM
-
2026-06-01days on market $300,000 Active 83 DOM
-
2026-05-31days on market $300,000 Active 82 DOM
-
2026-05-30days on market $300,000 Active 81 DOM
-
2026-04-28price $300,000 222-char remark
Show marketing remark (222 chars)
This 3-bedroom townhome features a main-floor master suite and a desirable loft-style layout. The upper level offers two additional bedrooms, a full bath, and a spacious loft ideal for an office or additional living space.
-
2026-04-22price $300,000 331-char remark
Show marketing remark (331 chars)
Join us for an Open House on April 25, 2026, from 12:30 PM to 2:00 PM. This beautifully designed 3-bedroom townhome features a convenient main-floor master suite and an open loft-style layout. The upper level includes two spacious bedrooms, a full bathroom, and a versatile loft that can be used as an office or extra living space.
-
2026-04-19price $300,000
-
2026-04-08$315,000 Active 222-char remark
Show marketing remark (222 chars)
This 3-bedroom townhome features a main-floor master suite and a desirable loft-style layout. The upper level offers two additional bedrooms, a full bath, and a spacious loft ideal for an office or additional living space.
-
2026-03-15$315,000 Active 331-char remark
Show marketing remark (331 chars)
Join us for an Open House on April 25, 2026, from 12:30 PM to 2:00 PM. This beautifully designed 3-bedroom townhome features a convenient main-floor master suite and an open loft-style layout. The upper level includes two spacious bedrooms, a full bathroom, and a versatile loft that can be used as an office or extra living space.
-
2026-03-10$315,000 Active
ⓘ Source: listings_history table (triggers on properties + properties_extension) + one-shot
backfill from property_details.listing_events for pre-trigger history.
Tax reassessment forecast SD · Resets to sale price
- Current annual tax
- $3,504 · $292/mo
- Projected year-2 tax
- $3,799 · $317/mo
- Expected delta
- +$295/yr (+$25/mo · 8.4%)
ⓘ Screening estimate from a state-policy table — verify with the county assessor before closing.
Climate risk First Street
- Flood 1/10 Low FEMA zone X (unshaded) · 0% chance over 30 yrs
- Wildfire 2/10 Low
- Heat 2/10 Low 7 d/yr ≥99°F today · 14 d/yr by 30 yrs out
- Wind 2/10 Low
- Air quality 2/10 Low 1 unhealthy d/yr today · 1 by 30 yrs out
Nearby sold comps map
Loading sold comps map…
Walkable amenities ~0.75 mi
Loading nearby amenities…
Taxation est. · year 1
- Rental income
- $19,434
- − Mortgage interest
- −$16,245
- − Property taxes
- −$3,504
- − Insurance
- −$1,450
- − Repairs & maintenance
- −$1,555
- − Management
- −$1,555
- − HOA
- −$1,320
- − Depreciation
- −$8,436
- Taxable loss
- −$14,630
- Est. tax savings @ 24.0%
- +$3,511
- After-tax cash flow
- $-5,659/yr
For passive investors: Depreciation is non-cash, so a rental often shows a tax loss while cash-flowing — sheltering income. Rental losses are passive: they offset passive income freely, and up to $25,000/yr can offset ordinary (W-2) income if you actively participate and your MAGI is under $100k (phasing out to $0 by $150k); unused losses carry forward. On sale, claimed depreciation is recaptured at up to 25%, and gains may owe capital-gains tax (a 1031 exchange can defer both). Figures are a year-1 estimate at your 24.0% rate — not tax advice; consult a CPA.
Schools (NCES district)
- District
- Tea Area School District 41-5
- NCES district ID
- 4600052
- Math proficiency
- 54% ▲ 3.00%
- Reading proficiency
- 63% ▲ 7.00%
- Median HH income
- $77,208
- Composite
- 52.4/100
- National rank
- #1578
- State rank
- #4 of 59 in SD
Livability — Tea
- Score
- 74/100
- State rank
- #30
- US rank
- #4416
Category grades
Schools grade is shown separately in the Schools card above.
Census & demographics
- Census place
- Tea, SD
Population outlook (Lincoln County) Hauer SSP2
- Today (2025)
- 70,138 people
- By 2030
- 78,929 · +12.5%
- By 2040
- 97,132 · +38.5%
- By 2050
- 116,136 · +65.6%
- By 2075
- 166,314 · +137.1%
- By 2100
- 219,430 · +212.9%
Not yet ingested
- Political lean
- —
- Race & ethnicity
- —
- Common origin
- —
- Civics
- —
Market trends
- HPI YoY
- —
- Current HPI
- —
- Rent YoY
- —
- Metro
- —
- State GDP YoY
- ▲ 0.70%
- F500 in state
- 2
Industry mix (Fortune 500 HQ in SD)
| Industry | F500 HQs | Revenue |
|---|---|---|
| Utilities | 1 | $1B |
|
||
Price history
-4.8% since first listed6 events — show timeline
- 2026-04-28 Price Changed $300,000 CSDBR
- 2026-04-22 Price Changed $300,000 MBOR
- 2026-04-19 Price Changed $300,000 REALTOR® Association of the Sioux Empire
- 2026-04-08 Listed $315,000 CSDBR
- 2026-03-15 Listed $315,000 MBOR
- 2026-03-10 Listed $315,000 REALTOR® Association of the Sioux Empire
Property tax history
+2.0%/yrLatest (2025): $3,504 · -0.2% YoY. Source: county tax records.
Cash-flow waterfall
monthlySold comps — $/sqft
last 12 mo · ≤1 miLoading sold comps…