 🏗️ New Construction
32746 Laureate Dr · Brookshire, TX
Flood risk 1/10 · Minimal
- FEMA flood zone
- X (unshaded)
- Chance of flooding over 30 yrs
- 0.0%
- Est. flood insurance / yr
- $507 – $1,088
Fire risk 5/10 · Moderate
- Est. fire insurance / yr
- $1,222 – $2,270
Heat risk 8/10 · Major
- Hot days now (above 111°F)
- 7 days/yr
- Hot days in 30 yrs
- 22 days/yr
Wind risk 9/10 · Severe
- Chance of severe wind over 30 yrs
- 99.0%
Air-quality risk 2/10 · Minimal
- Unhealthy air days now
- 1 days/yr
- Unhealthy air days in 30 yrs
- 1 days/yr
Risk factors via First Street. Map © Google.
Why this score? — see what drove the D- grade
The composite is a weighted blend of 9 inputs, each scored 0–100. Each bar is that input's sub-score; the figure is the points it added to the 100-point composite (weight × sub-score).
- Cash flow +10.7/30.0
- ARV discount +7.5/15.0
- Schools +4.6/10.0
- DSCR +3.1/10.0
- Livability +3.1/5.0
- Condition / age +2.5/5.0
- 1% rule +2.3/10.0
- Rent growth +2.2/5.0
- Appreciation +0.0/10.0
$265,900
🖨 Deal sheet 📄 Offer letter ✓ Due diligence
Listing remarks MLS
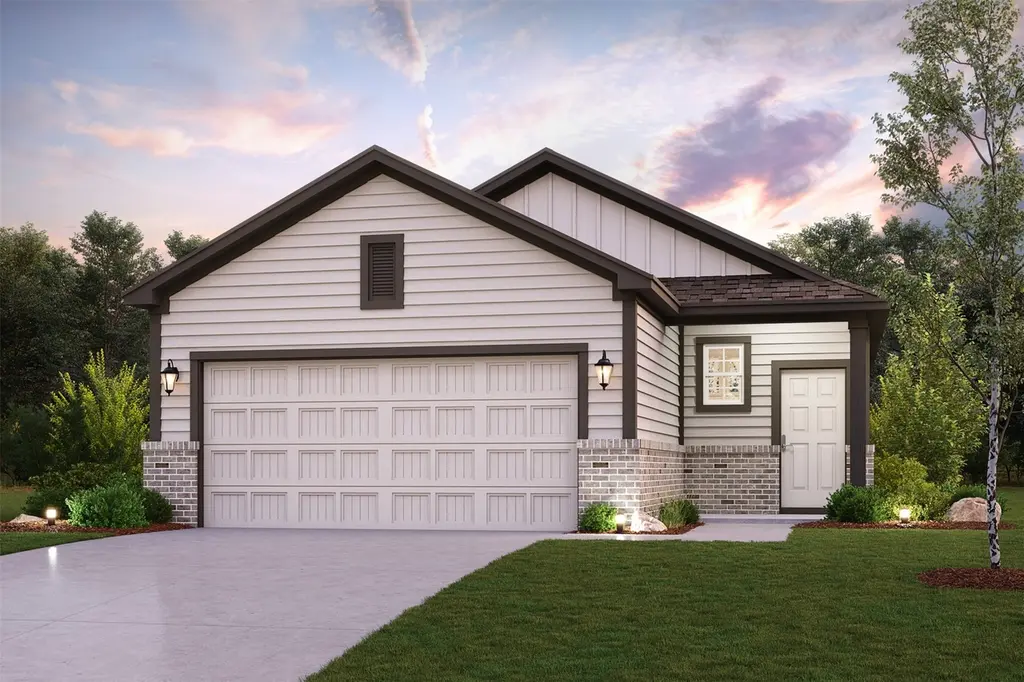
The attractive Aspen plan centers around a large open kitchen, complete with an island and a built-in pantry. An airy great room-ideal for relaxing and entertaining-is steps away, as is a dining area. There are three spacious bedrooms, including a primary suite with a walk-in closet and a private bath with dual vanities and a walk-in shower.
Key facts
- Tiled walk-in shower
- Microwave oven
- Dishwasher
Tags
Property features AI
Finance
- HOA & community: Community Solutions association; Annual association fee of $750
Exterior
- Parking: Attached garage; 2 garage spaces
- Utilities: Public water; Public sewer
- Home design: Residential property; Under construction (new construction); Slab foundation; Composition roof; Built in 2026
- Construction: Brick construction; Century Communities builder
- Exterior features: Private yard; Subdivision setting
Interior
- Kitchen: Dishwasher; Gas oven; Gas range; Microwave; Quartz counters
- Bedrooms: 3 total rooms
- Bathrooms: 2 full bathrooms
- Heating & cooling: Central heating (gas); Central electric air conditioning; Has heating; Has cooling
- Interior features: Kitchen island; Kitchen open to family room; Quartz counters; Separate shower; Tub with shower; Window treatments; Ceiling fans; Programmable thermostat; Low emissivity windows
- Laundry & utility: Washer hookup; Electric dryer hookup; Tankless water heater
Neighborhood map
What this means for you Summary
Snapshot
- This is a 3-bed/2.0-bath land listed at $266k.
Deal economics
- At list price, monthly cash flow is $-129 ($-2k/yr) — negative.
- To cash-flow at today's rent, offer at most $251k (5.6% below list).
- To meet the 1% rule (rent ≥ 1% of price), the offer needs to be $201k (24.4% below list).
- Recommended offer: $201k (24.4% below list) — sets the bar for 1% rule.
Location & tenants
- Location reads 62/100 on livability (#960 in TX) — a middle-class / working-renter tenant base. Strengths: cost of living A+, housing A+; Watch: crime D-, amenities F, commute F.
- Lamar CISD (suburban): math 50% / reading 53% proficiency, ranked #116 of 826 in TX (top 14%) — acceptable for families but not a draw, mixed tenant base, ~2y average lease.
- Zoned schools: Dean Leaman J H School (math 59% / reading 56%, grade B, #206 of 1,662 statewide, top 13%, 2,191 students, 32% FRL); Fulshear H S (math 52% / reading 70%, grade C+, #258 of 1,632 statewide, top 16%, 2,464 students, 30% FRL).
- Market conditions: Rents soft (-1.0%/yr); 997 active listings in the ZIP; solid renter incomes; 12,093 units permitted in Fort Bend County in 2024 (815 in 5+ unit buildings).
Forward outlook
- Local home prices are declining (-3.0%/yr); year-one equity from $2k of loan paydown is wiped out by about $8k of value loss. Plan a longer hold.
- Fort Bend County population projected at +75% by 2050 — long-run rental-demand tailwind backs the buy-and-hold thesis.
Negotiation context
- It's been on market 36 days — a 3% lower offer ($258k) is reasonable based on typical stale-listing flexibility.
- 2 sale attempts with the ask held roughly flat each time — persistent listings suggest the price (not the market) is what's stuck; bring a comps-based counter.
Risks & watch-outs
- Climate carrying-cost: severe wind risk, 99% chance of damaging wind over 30y; moderate wildfire risk; extreme-heat days projected 7→22/yr by 2055 (HVAC capex compounding) — expect insurance premiums to compound above CPI over the hold.
Questions for the listing agent
- What do current leases actually rent for vs. the listed asking? Can we see a recent rent roll and the last 12 months of T-12 income?
- It's been on market 36 days. Have you received any prior offers? Is the seller open to a 24% concession, seller financing, or rate buy-down credit?
- What does the HOA fee cover, when was the last increase, and are there any pending special assessments or reserve-fund shortfalls?
- Is there a deadline driving the sale (1031 exchange, divorce, estate, relocation)? That informs how much negotiation room exists.
- Schools are F-rated, which usually means shorter tenancies and higher turnover. Who's the typical renter profile here, and what's been the actual vacancy rate?
- Crime grade is D in this area — have there been break-ins, vandalism, or insurance claims at this property in the last 3 years? What carrier currently insures it and at what premium?
- The area grade is low — what's the realistic commute time and amenity access for the typical tenant pool here? Any planned neighborhood developments (good or bad) we should know about?
- What's the average days-on-market for RENTAL listings here right now (not sales)? A rising rental-DOM trend means longer vacancies and softer asking-rent achievability than the comps imply.
- What's the recent tenant-quality profile in this submarket — average credit score on applications, eviction rate, late-payment / NSF rate, and stable-employment percentage? A property-management company in the area should have these aggregated.
- How much new for-sale + rental construction is in the pipeline within 1–3 miles? Heavy new supply typically softens prices + rents 12–24 months out; constrained supply supports both.
Investment metrics
- 1% rule
- 0.73% ✗
- Cap rate
- 5.73%
- Cash-on-cash
- -2.02%
- DSCR
- 0.91
- GRM
- 11.3
CMA / ARV
- ARV (median comp)
- $273,871
- List price
- $265,900
- Delta
- -2.91%
- Verdict
- FAIR
- Comps
- 20 within 1.0 mi
Projected returns pro-forma
-3.0% appreciation · 0.0% rent growth · sell at horizon
- IRR
- -22.8%
- Equity multiple
- 0.24×
- Total profit
- $-58,571
- Equity at exit
- $40,835
- IRR
- -26.2%
- Equity multiple
- -0.10×
- Total profit
- $-84,682
- Equity at exit
- $23,679
Cash invested: $76,684 (down + closing). Projections, not guarantees.
Landlord ↔ Tenant lean methodology
- Overall (STATE)
- 87 Strongly Landlord-Friendly
- State Texas
- 87 Strongly Landlord-Friendly · R+5
- County
- — inherits STATE
- City
- — inherits STATE
ZIP-level market 77423
- Rents YoY
- -1.0%
- Active inventory
- 997
- Price-to-rent
- 11.0×
Monthly cashflow live
- Estimated rent
- $2,011 medium interval (Pro) →
- Mortgage (P&I)
- −$1,436
- Tax from tax record
- −$105 /mo · $1,258/yr
- Insurance
- −$114
- HOA
- −$63
- Vacancy / Maint / Mgmt
- −$422
- Net cashflow
- $-129
Break-even live
UW: 25.0% down · 7.5% · 30yr · 1.5% tax · 5.0% vac · 8.0% maint · 8.0% mgmt
Financing live
Cash to close
- Down payment
- $68,468
- Closing costs
- $8,216
- Reserves months
- —
- Total cash needed
- —
Loan-product check · same deal, 3 products live
Conventional
25% down · 7.5% · 30yr
- Down + closing
- —
- Monthly P&I
- —
- Monthly cashflow
- —
- DSCR
- —
- Eligible?
- —
Personal DTI + credit; lowest rate.
DSCR
20% down · 8.5% · 30yr
- Down + closing
- —
- Monthly P&I
- —
- Monthly cashflow
- —
- DSCR
- —
- Eligible?
- —
No personal income docs; deal must DSCR.
Hard money
10% down · 12.0% · 12mo
- Down + closing
- —
- Monthly P&I
- —
- Monthly cashflow
- —
- DSCR
- —
- Eligible?
- —
Short-term bridge; refi at stabilization.
HOA detail
- Monthly dues
- $63 · $756/yr
Listing history 15 events
-
2026-06-18days on market $265,900 Active 36 DOM
-
2026-06-17days on market $265,900 Active 35 DOM
-
2026-06-16days on market $265,900 Active 34 DOM
-
2026-06-15days on market $265,900 Active 33 DOM
-
2026-06-13days on market $265,900 Active 31 DOM
-
2026-06-09days on market $265,900 Active 27 DOM
-
2026-06-08days on market $265,900 Active 26 DOM
-
2026-06-07days on market $265,900 Active 25 DOM
-
2026-06-04days on market $265,900 Active 22 DOM
-
2026-06-03days on market $265,900 Active 21 DOM
-
2026-06-02days on market $265,900 Active 20 DOM
-
2026-06-01days on market $265,900 Active 19 DOM
-
2026-05-31days on market $265,900 Active 18 DOM
-
2026-05-13$265,900 Active 650-char remark
-
2026-04-29$265,900 Active 194-char remark
Show marketing remark (343 chars)
The attractive Aspen plan centers around a large open kitchen, complete with an island and a built-in pantry. An airy great room-ideal for relaxing and entertaining-is steps away, as is a dining area. There are three spacious bedrooms, including a primary suite with a walk-in closet and a private bath with dual vanities and a walk-in shower.
ⓘ Source: listings_history table (triggers on properties + properties_extension) + one-shot
backfill from property_details.listing_events for pre-trigger history.
Tax reassessment forecast TX · Resets to sale price
- Current annual tax
- $1,258 · $105/mo
- Projected year-2 tax
- $4,866 · $405/mo
- Expected delta
- +$3,608/yr (+$301/mo · 286.9%)
ⓘ Screening estimate from a state-policy table — verify with the county assessor before closing.
Climate risk First Street
- Flood 1/10 Low FEMA zone X (unshaded) · 0% chance over 30 yrs
- Wildfire 5/10 Major
- Heat 8/10 Severe 7 d/yr ≥111°F today · 22 d/yr by 30 yrs out
- Wind 9/10 Extreme 99% chance of damaging wind over 30 yrs
- Air quality 2/10 Low 1 unhealthy d/yr today · 1 by 30 yrs out
Nearby sold comps map
Loading sold comps map…
Walkable amenities ~0.75 mi
Loading nearby amenities…
Taxation est. · year 1
- Rental income
- $24,138
- − Mortgage interest
- −$15,341
- − Property taxes
- −$1,258
- − Insurance
- −$1,369
- − Repairs & maintenance
- −$1,931
- − Management
- −$1,931
- − HOA
- −$756
- − Depreciation
- −$7,967
- Taxable loss
- −$6,416
- Est. tax savings @ 24.0%
- +$1,540
- After-tax cash flow
- $-9/yr
For passive investors: Depreciation is non-cash, so a rental often shows a tax loss while cash-flowing — sheltering income. Rental losses are passive: they offset passive income freely, and up to $25,000/yr can offset ordinary (W-2) income if you actively participate and your MAGI is under $100k (phasing out to $0 by $150k); unused losses carry forward. On sale, claimed depreciation is recaptured at up to 25%, and gains may owe capital-gains tax (a 1031 exchange can defer both). Figures are a year-1 estimate at your 24.0% rate — not tax advice; consult a CPA.
Schools (NCES district)
- District
- Lamar CISD
- NCES district ID
- 4826580
- Math proficiency
- 50% ▼ -12.00%
- Reading proficiency
- 53% ▼ -4.00%
- Median HH income
- $75,213
- Composite
- 46.43/100
- National rank
- #2452
- State rank
- #116 of 826 in TX
Livability — Brookshire
- Score
- 62/100
- State rank
- #960
- US rank
- #17059
Category grades
Schools grade is shown separately in the Schools card above.
Census & demographics
- County
- Waller County · 18,767 people
- Metro
- Houston-The Woodlands-Sugar Land, TX
- Population (ZIP)
- 18,767
- Household income
- $84,490
- Rent vs Own
- Severe rent burden
- 20.0
Population outlook (Fort Bend County) Hauer SSP2
- Today (2025)
- 1,004,526 people
- By 2030
- 1,153,104 · +14.8%
- By 2040
- 1,453,718 · +44.7%
- By 2050
- 1,753,781 · +74.6%
- By 2075
- 2,455,772 · +144.5%
- By 2100
- 2,930,528 · +191.7%
Race, ethnicity, and origin ACS 2023
- Neighborhood character
- Diverse neighborhood (Simpson 0.64)
- Race & ethnicity
- Hispanic / Latino 41% White 41% Black 14% Two or more races 13% Asian 2% Native American 1%
- Hispanic origin (detail)
- Mexican 30% Cuban 2%
- Common ancestry
- Lithuanian 2% Italian 2% Slovak 1%
- Foreign-born
- 17% · Canada, China, Dominican Republic
- Languages at home
- 65% English-only · Spanish 32% French/Haitian/Cajun 1% Other Indo-European 1%
Political lean MEDSL · Fort Bend
- 2024 margin
- Toss-up / Even · D 49.5% · R 47.9% · Other 2.6%
- 2008→2024 swing
- +4.0pp toward D · 2008: -2.4pp · 2024: 1.6pp
- All cycles
- 2024: D+1.6 2020: D+10.6 2016: D+6.6 2012: R+6.8 2008: R+2.4
Not yet ingested
- Civics
- —
Market trends
- HPI YoY
- ▼ -125.28%
- Current HPI
- 204.8709
- Rent YoY
- ▼ -1.01%
- Metro
- Houston-The Woodlands-Sugar Land, TX
- State GDP YoY
- ▲ 3.95%
- F500 in state
- 110
Industry mix (Fortune 500 HQ in TX)
| Industry | F500 HQs | Revenue |
|---|---|---|
| Energy | 16 | $1,198B |
|
||
| Technology | 5 | $198B |
|
||
| Engineering / Construction | 4 | $72B |
|
||
| Energy Services | 3 | $60B |
|
||
| Utilities | 3 | $41B |
|
||
| Healthcare | 2 | $330B |
|
||
Price history
+0.0% since first listed2 events — show timeline
- 2026-05-13 Listed $265,900 HARMLS
- 2026-04-29 Listed $265,900 Zillow
Cash-flow waterfall
monthlySold comps — $/sqft
last 12 mo · ≤1 miLoading sold comps…