605 Edgar St · Marion, SC
Flood risk 7/10 · Major
- FEMA flood zone
- X (unshaded)
- Chance of flooding over 30 yrs
- 0.96%
- Est. flood insurance / yr
- $507 – $1,088
Fire risk 4/10 · Minor
- Est. fire insurance / yr
- $783 – $1,453
Heat risk 7/10 · Major
- Hot days now (above 109°F)
- 7 days/yr
- Hot days in 30 yrs
- 16 days/yr
Wind risk 8/10 · Major
- Chance of severe wind over 30 yrs
- 80.0%
Air-quality risk 2/10 · Minimal
- Unhealthy air days now
- 1 days/yr
- Unhealthy air days in 30 yrs
- 1 days/yr
Risk factors via First Street. Map © Google.
Why this score? — see what drove the B grade
The composite is a weighted blend of 9 inputs, each scored 0–100. Each bar is that input's sub-score; the figure is the points it added to the 100-point composite (weight × sub-score).
- Cash flow +30.0/30.0
- 1% rule +10.0/10.0
- DSCR +10.0/10.0
- Appreciation +7.9/10.0
- ARV discount +7.5/15.0
- Livability +2.8/5.0
- Rent growth +2.5/5.0
- Condition / age +2.5/5.0
- Schools +1.3/10.0
$50,000
🖨 Deal sheet 📄 Offer letter ✓ Due diligence
Listing remarks
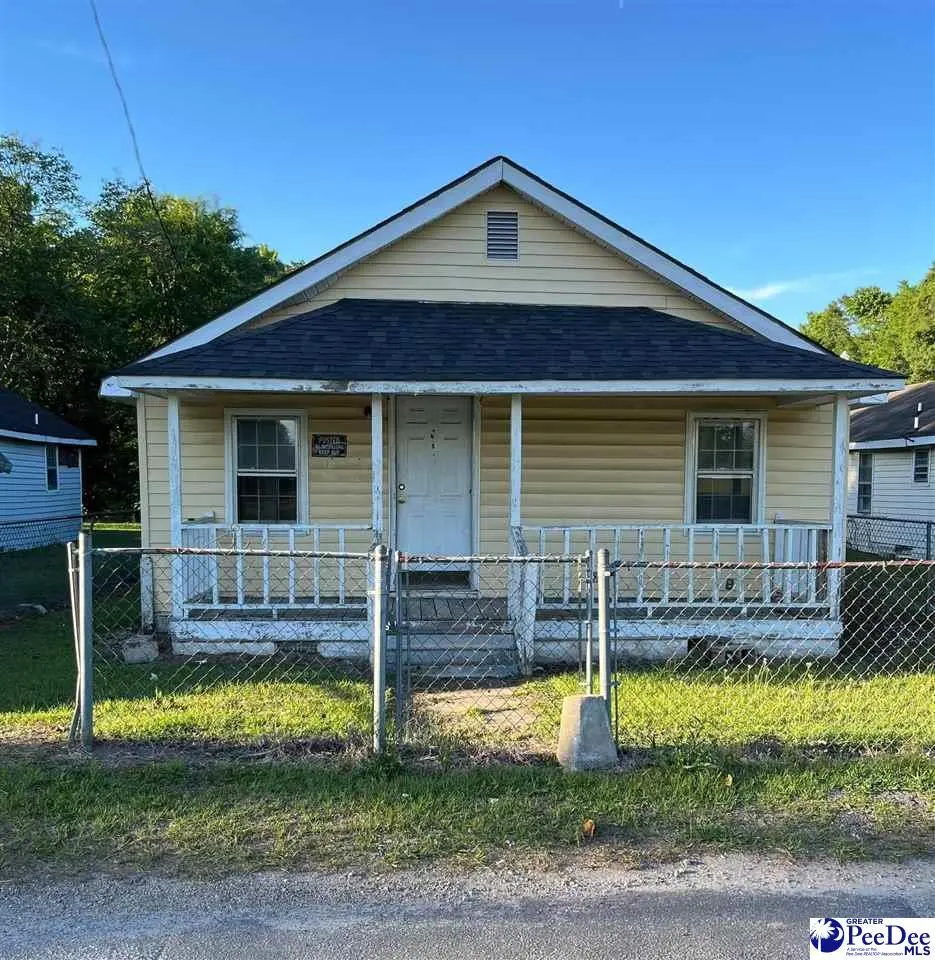
Investor special in the city limits of Marion! This approximately 2-bedroom, 1-bath home offers around 600 square feet of living space on an approximately 5,000 square foot lot. Built around 1975, this property is a true fixer-upper and is being sold as-is. The home has been vacant for over 10 years and has been stripped down, requiring significant repairs and renovation throughout. Roof was updated around 2018. Several windows are broken, and the property will need a full rehab, making it ideal for investors or buyers looking for a project. Conveniently located just minutes from downtown Marion (approximately 2 minutes away) and within close proximity to nearby restaurants, shops, and esse
Key facts
- Established area
- Full rehab
- 4,792 sq ft lot
Tags
Property features AI
Exterior
- Utilities: Public water; Public sewer
- Home design: Single-family residence; Residential property
- Construction: Vinyl siding; Shingle roof; Approximately 600 above-grade finished square feet; Built on standard foundation
- Exterior features: Porch; Fenced yard
Interior
- Flooring: Tile
- Bathrooms: 1 full bathroom
- Interior features: Tile flooring
Neighborhood map
What this means for you Summary
Snapshot
- This is a 2-bed/1.0-bath other listed at $50k.
Deal economics
- At list price, monthly cash flow is $239 ($3k/yr) — positive.
- The deal already cash-flows at list — no discount required.
- Meets the 1% rule at list price ($810 rent vs $50k).
- Recommended offer: $48k (3.0% below list) — sets the bar for market timing.
- Cap rate 13.6% vs local median 3.3% in Marion — top-decile yield for the area; either an underpriced asset or a hidden risk that comps aren't pricing in. Stress-test before assuming the spread holds.
Location & tenants
- Location reads 55/100 on livability (#306 in SC) — a working-class tenant base; expect higher turnover. Strengths: cost of living A+, health & safety A+; Watch: crime F, amenities F, commute F.
- Marion 10 (town): math 9% / reading 23% proficiency, ranked #79 of 80 in SC (top 99%) — low school quality limits family demand, transient renter base, plan for 1-2y turnover; 79% free/reduced lunch — lower-income household profile, screen leases tightly.
- Zoned schools: Johnakin Middle (math 2% / reading 16%, grade F, #224 of 229 statewide, top 98%, 456 students, 100% FRL); Marion High (math 27% / reading 67%, grade D-, #158 of 196 statewide, top 82%, 628 students, 100% FRL) — zoned schools average 100% FRL vs 79% district-wide (21 pts higher); higher-poverty schools than district average — tighter screening recommended.
- Zoned-school proficiency averages 28% at this address vs 16% district-wide (+12 pts) — the actual schools serving this property are materially stronger than the Marion 10 average implies; a family-tenant draw the district grade alone would hide.
- Market conditions: 81 active listings in the ZIP; 76 units permitted in Marion County in 2024 (0 in 5+ unit buildings).
Forward outlook
- In year one you build about $3k of equity ($346 loan paydown + $3k appreciation (5.8% local appreciation)).
- Marion County population projected at -26% by 2050 — secular population decline; favor cash flow + early exit over multi-decade hold.
- At projected returns (5.8% appreciation + 3.0% rent growth), your $14k cash investment doubles in ~3 years — after that, you're playing with house money.
- By year 10, paydown + projected appreciation supports a ~$33k cash-out refi (75% LTV) — recoverable capital for the next deal without selling this one.
Negotiation context
- It's been on market 37 days — a 3% lower offer ($48k) is reasonable based on typical stale-listing flexibility.
Risks & watch-outs
- Watch-outs: flood insurance adds $66/mo.
- Climate carrying-cost: major flood risk; severe wind risk, 80% chance of damaging wind over 30y; extreme-heat days projected 7→16/yr by 2055 (HVAC capex compounding) — expect insurance premiums to compound above CPI over the hold.
Questions for the listing agent
- It's been on market 37 days. Have you received any prior offers? Is the seller open to a 3% concession, seller financing, or rate buy-down credit?
- Built in 1975 — when were the roof, HVAC, electrical panel, plumbing, and water heater last replaced?
- What's the actual annual flood-insurance premium (NFIP or private), and is the property in a SFHA with mandatory coverage?
- Is there a deadline driving the sale (1031 exchange, divorce, estate, relocation)? That informs how much negotiation room exists.
- Schools are F-rated, which usually means shorter tenancies and higher turnover. Who's the typical renter profile here, and what's been the actual vacancy rate?
- Crime grade is F in this area — have there been break-ins, vandalism, or insurance claims at this property in the last 3 years? What carrier currently insures it and at what premium?
- What's the average days-on-market for RENTAL listings here right now (not sales)? A rising rental-DOM trend means longer vacancies and softer asking-rent achievability than the comps imply.
- What's the recent tenant-quality profile in this submarket — average credit score on applications, eviction rate, late-payment / NSF rate, and stable-employment percentage? A property-management company in the area should have these aggregated.
- How much new for-sale + rental construction is in the pipeline within 1–3 miles? Heavy new supply typically softens prices + rents 12–24 months out; constrained supply supports both.
Investment metrics
- 1% rule
- 1.62% ✓
- Cap rate
- 13.62%
- Cash-on-cash
- 26.17%
- DSCR
- 2.16
- GRM
- 5.1
CMA / ARV
No comps found within radius.
Projected returns pro-forma
5.75% appreciation · 3.0% rent growth · sell at horizon
- IRR
- 32.1%
- Equity multiple
- 3.07×
- Total profit
- $28,950
- Equity at exit
- $30,636
- IRR
- 30.1%
- Equity multiple
- 6.25×
- Total profit
- $73,543
- Equity at exit
- $54,883
Cash invested: $14,000 (down + closing). Projections, not guarantees.
Landlord ↔ Tenant lean methodology
- Overall (STATE)
- 90 Strongly Landlord-Friendly
- State South Carolina
- 90 Strongly Landlord-Friendly · R+6
- County
- — inherits STATE
- City
- — inherits STATE
ZIP-level market 29565
- Home prices YoY
- 7.4%
- Active inventory
- 81
- Price-to-rent
- 5.1×
Monthly cashflow live
- Estimated rent
- $810 medium interval (Pro) →
- Mortgage (P&I)
- −$262
- Tax from tax record
- −$52 /mo · $622/yr
- Insurance
- −$21
- Flood insurance flood zone
- −$66 /mo · $798/yr
- HOA
- −$0
- Vacancy / Maint / Mgmt
- −$170
- Net cashflow
- $239
Break-even live
UW: 25.0% down · 7.5% · 30yr · 1.5% tax · 5.0% vac · 8.0% maint · 8.0% mgmt
Financing live
Cash to close
- Down payment
- $12,500
- Closing costs
- $1,500
- Reserves months
- —
- Total cash needed
- —
Loan-product check · same deal, 3 products live
Conventional
25% down · 7.5% · 30yr
- Down + closing
- —
- Monthly P&I
- —
- Monthly cashflow
- —
- DSCR
- —
- Eligible?
- —
Personal DTI + credit; lowest rate.
DSCR
20% down · 8.5% · 30yr
- Down + closing
- —
- Monthly P&I
- —
- Monthly cashflow
- —
- DSCR
- —
- Eligible?
- —
No personal income docs; deal must DSCR.
Hard money
10% down · 12.0% · 12mo
- Down + closing
- —
- Monthly P&I
- —
- Monthly cashflow
- —
- DSCR
- —
- Eligible?
- —
Short-term bridge; refi at stabilization.
Listing history 17 events
-
2026-06-18days on market $50,000 Active 37 DOM
-
2026-06-17days on market $50,000 Active 36 DOM
-
2026-06-16days on market $50,000 Active 35 DOM
-
2026-06-15days on market $50,000 Active 34 DOM
-
2026-06-14days on market $50,000 Active 32 DOM
-
2026-06-13days on market $50,000 Active 31 DOM
-
2026-06-10days on market $50,000 Active 29 DOM
-
2026-06-09days on market $50,000 Active 28 DOM
-
2026-06-08days on market $50,000 Active 27 DOM
-
2026-06-07days on market $50,000 Active 26 DOM
-
2026-06-05days on market $50,000 Active 23 DOM
-
2026-06-03days on market $50,000 Active 22 DOM
-
2026-06-02days on market $50,000 Active 21 DOM
-
2026-06-01days on market $50,000 Active 20 DOM
-
2026-05-31days on market $50,000 Active 19 DOM
-
2026-05-30days on market $50,000 Active 18 DOM
-
2026-05-12$50,000 Active
ⓘ Source: listings_history table (triggers on properties + properties_extension) + one-shot
backfill from property_details.listing_events for pre-trigger history.
Tax reassessment forecast SC · Resets to sale price
- Current annual tax
- $622 · $52/mo
- Projected year-2 tax
- $622 · $52/mo
- Expected delta
- $0/yr ($0/mo · 0.0%)
ⓘ Screening estimate from a state-policy table — verify with the county assessor before closing.
Climate risk First Street
- Flood 7/10 Severe FEMA zone X (unshaded) · 96% chance over 30 yrs
- Wildfire 4/10 Moderate
- Heat 7/10 Severe 7 d/yr ≥109°F today · 16 d/yr by 30 yrs out
- Wind 8/10 Severe 80% chance of damaging wind over 30 yrs
- Air quality 2/10 Low 1 unhealthy d/yr today · 1 by 30 yrs out
Nearby sold comps map
Loading sold comps map…
Walkable amenities ~0.75 mi
Loading nearby amenities…
Taxation est. · year 1
- Rental income
- $9,726
- − Mortgage interest
- −$2,801
- − Property taxes
- −$622
- − Insurance
- −$1,048
- − Repairs & maintenance
- −$778
- − Management
- −$778
- − Depreciation
- −$1,455
- Taxable income
- $2,244
- Est. tax owed @ 24.0%
- −$539
- After-tax cash flow
- $2,328/yr
For passive investors: Depreciation is non-cash, so a rental often shows a tax loss while cash-flowing — sheltering income. Rental losses are passive: they offset passive income freely, and up to $25,000/yr can offset ordinary (W-2) income if you actively participate and your MAGI is under $100k (phasing out to $0 by $150k); unused losses carry forward. On sale, claimed depreciation is recaptured at up to 25%, and gains may owe capital-gains tax (a 1031 exchange can defer both). Figures are a year-1 estimate at your 24.0% rate — not tax advice; consult a CPA.
Schools (NCES district)
- District
- Marion 10
- NCES district ID
- 4503908
- Math proficiency
- 9% ▼ -9.00%
- Reading proficiency
- 23% ▲ 1.00%
- Median HH income
- $31,200
- Composite
- 12.75/100
- National rank
- #9600
- State rank
- #79 of 80 in SC
Livability — Marion
- Score
- 55/100
- State rank
- #306
- US rank
- #23400
Category grades
Schools grade is shown separately in the Schools card above.
Census & demographics
- Census place
- Marion, SC
- Population (ZIP)
- 6,460
Population outlook (Marion County) Hauer SSP2
- Today (2025)
- 29,121 people
- By 2030
- 27,539 · -5.4%
- By 2040
- 24,391 · -16.2%
- By 2050
- 21,566 · -25.9%
- By 2075
- 15,537 · -46.6%
- By 2100
- 10,680 · -63.3%
Race, ethnicity, and origin ACS 2023
- Neighborhood character
- Diverse neighborhood (Simpson 0.60)
- Race & ethnicity
- White 48% Black 41% Two or more races 8% Hispanic / Latino 1%
- Common ancestry
- Slovak 1% Portuguese 1%
- Foreign-born
- 2% · Canada
- Languages at home
- 97% English-only · Spanish 2%
Political lean MEDSL · Marion
- 2024 margin
- D (+10.5) · D 54.6% · R 44.1% · Other 1.2%
- 2008→2024 swing
- -15.2pp toward R · 2008: 25.7pp · 2024: 10.5pp
- All cycles
- 2024: D+10.5 2020: D+21.5 2016: D+21.7 2012: D+29.8 2008: D+25.7
Not yet ingested
- Civics
- —
Market trends
- HPI YoY
- ▲ 5.75%
- Current HPI
- 83.7204
- Rent YoY
- —
- Metro
- —
- State GDP YoY
- ▲ 4.51%
- F500 in state
- 2
Industry mix (Fortune 500 HQ in SC)
| Industry | F500 HQs | Revenue |
|---|---|---|
| Packaging | 1 | $7B |
|
||
Price history
1 event — show timeline
- 2026-05-12 Listed $50,000 RAGPD
Property tax history
-0.2%/yrLatest (2025): $622 · +1.5% YoY. Source: county tax records.
Cash-flow waterfall
monthlySold comps — $/sqft
last 12 mo · ≤1 miLoading sold comps…