5 Lunar Ln · Holiday Island, AR
Flood risk 1/10 · Minimal
- FEMA flood zone
- X (unshaded)
- Chance of flooding over 30 yrs
- 0.0%
- Est. flood insurance / yr
- $507 – $1,088
Fire risk 4/10 · Minor
- Est. fire insurance / yr
- $1,499 – $2,785
Heat risk 4/10 · Minor
- Hot days now (above 105°F)
- 7 days/yr
- Hot days in 30 yrs
- 21 days/yr
Wind risk 2/10 · Minimal
- Chance of severe wind over 30 yrs
- 1.0%
Air-quality risk 1/10 · Minimal
- Unhealthy air days now
- 0 days/yr
- Unhealthy air days in 30 yrs
- 0 days/yr
Risk factors via First Street. Map © Google.
Why this score? — see what drove the B grade
The composite is a weighted blend of 9 inputs, each scored 0–100. Each bar is that input's sub-score; the figure is the points it added to the 100-point composite (weight × sub-score).
- Cash flow +29.3/30.0
- DSCR +10.0/10.0
- Appreciation +8.7/10.0
- ARV discount +7.5/15.0
- 1% rule +7.0/10.0
- Schools +3.5/10.0
- Livability +3.4/5.0
- Rent growth +2.5/5.0
- Condition / age +2.5/5.0
$92,000
🖨 Deal sheet (PDF) 📄 Offer letter ✓ Due diligence
Listing remarks MLS
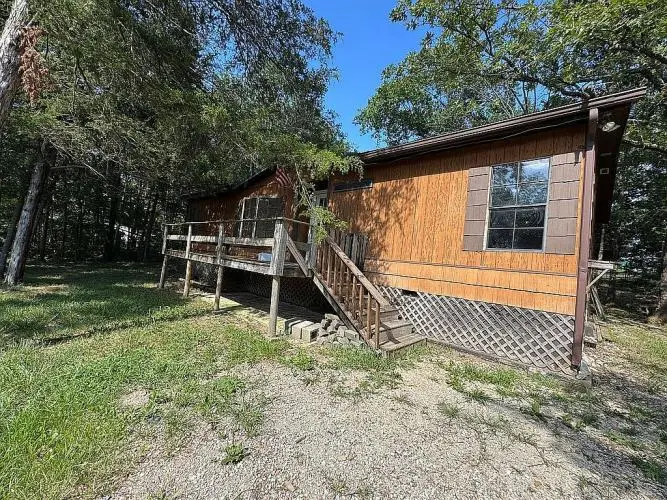
Priced for a quick sale! This 3-bedroom, 2-bath mobile home offers 1,152 square feet of opportunity for the right buyer. Remodeling was started but not completed, making this the perfect project for someone looking to finish it their own way and build instant equity. The living room features large bay windows, filling the space with natural light and creating an open, welcoming feel. Outside, you’ll find a spacious yard with plenty of room for outdoor living, pets, or future improvements. The property also includes a shed with electricity, ideal for storage, a workshop, or hobby space. Whether you’re an investor, renovator, or buyer looking for an affordable home to customize, this property offers strong potential at a great value. Being sold as-is and priced to move — bring your vision and make it yours!
Key facts
- Spacious yard
- Built 1984
- Listed 103 days
Tags
Neighborhood map
What this means for you Summary
Snapshot
- This is a 3-bed/2.0-bath manufactured listed at $92k.
Deal economics
- At list price, monthly cash flow is $324 ($4k/yr) — positive.
- The deal already cash-flows at list — no discount required.
- Meets the 1% rule at list price ($1k rent vs $92k).
- Recommended offer: $84k (9.0% below list) — sets the bar for market timing.
- Cap rate 10.5% vs local median 2.2% in Holiday Island — top-decile yield for the area; either an underpriced asset or a hidden risk that comps aren't pricing in. Stress-test before assuming the spread holds.
Location & tenants
- Location reads 67/100 on livability (#104 in AR) — a middle-class / working-renter tenant base. Strengths: crime A+, cost of living A+, housing A+; Watch: health & safety C-, schools D, amenities F.
- Eureka Springs School District (rural): math 37% / reading 46% proficiency, ranked #61 of 238 in AR (top 26%) — families likely to look elsewhere, expect single-tenant / working-renter base with shorter leases.
- Market conditions: 372 active listings in the ZIP; 1 comparable units currently listed for rent nearby; 30 units permitted in Carroll County in 2024 (0 in 5+ unit buildings).
Forward outlook
- In year one you build about $7k of equity ($636 loan paydown + $7k appreciation (7.3% local appreciation)).
- Carroll County population projected at +4% by 2050 — modest demand growth; plan on rents tracking national, not racing it.
- At projected returns (7.3% appreciation + 3.0% rent growth), your $26k cash investment doubles in ~3 years — after that, you're playing with house money.
- By year 5, paydown + projected appreciation supports a ~$33k cash-out refi (75% LTV) — recoverable capital for the next deal without selling this one.
Negotiation context
- It's been on market 103 days — a 9% lower offer ($84k) is reasonable based on typical stale-listing flexibility.
- Current owner paid $72k; 28% above their basis — modest negotiation headroom, anchor on the comps not their cost.
Questions for the listing agent
- It's been on market 103 days. Have you received any prior offers? Is the seller open to a 9% concession, seller financing, or rate buy-down credit?
- Why hasn't it sold? Are there any deal-killer items the seller is aware of (foundation, flood, title, zoning, code violations)?
- Is there a deadline driving the sale (1031 exchange, divorce, estate, relocation)? That informs how much negotiation room exists.
- Schools are D-rated, which usually means shorter tenancies and higher turnover. Who's the typical renter profile here, and what's been the actual vacancy rate?
- What's the average days-on-market for RENTAL listings here right now (not sales)? A rising rental-DOM trend means longer vacancies and softer asking-rent achievability than the comps imply.
- What's the recent tenant-quality profile in this submarket — average credit score on applications, eviction rate, late-payment / NSF rate, and stable-employment percentage? A property-management company in the area should have these aggregated.
- How much new for-sale + rental construction is in the pipeline within 1–3 miles? Heavy new supply typically softens prices + rents 12–24 months out; constrained supply supports both.
Investment metrics
- 1% rule
- 1.20% ✓
- Cap rate
- 10.52%
- Cash-on-cash
- 15.09%
- DSCR
- 1.67
- GRM
- 7.0
CMA / ARV
- ARV (median comp)
- $196,732
- List price
- $92,000
- Delta
- -53.24%
- Verdict
- UNDERPRICED
- Comps
- 13 within 1.0 mi
Show comp detail 2 sales within ~0.75 mi
| Address | Dist | Beds/Ba | Sqft | Sold | Price | $/sf | Match |
|---|---|---|---|---|---|---|---|
| 40 Venus Ave | 0.27mi | 2/2.0 (-1) | 1,120 (-3%) | 16mo | $120,000 | $107 | 65 |
| 19 Skyview Ln | 0.42mi | 3/2.0 | 1,248 (+8%) | 22mo | $134,000 | $107 | 48 |
Match score weights: distance 35% · size 25% · config 20% · recency 20%. Top-matched comps best support the ARV.
Projected returns pro-forma
7.31% appreciation · 3.0% rent growth · sell at horizon
- IRR
- 30.5%
- Equity multiple
- 3.12×
- Total profit
- $54,484
- Equity at exit
- $65,629
- IRR
- 27.5%
- Equity multiple
- 6.54×
- Total profit
- $142,705
- Equity at exit
- $126,403
Cash invested: $25,760 (down + closing). Projections, not guarantees.
Landlord ↔ Tenant lean methodology
- Overall (STATE)
- 92 Strongly Landlord-Friendly
- State Arkansas
- 92 Strongly Landlord-Friendly · R+14
- County
- — inherits STATE
- City
- — inherits STATE
ZIP-level market 72631
- Home prices YoY
- 2.9%
- Active inventory
- 372
- Price-to-rent
- 7.0×
Monthly cashflow live
- Estimated rent
- $1,100 medium interval (Pro) →
- Mortgage (P&I)
- −$482
- Tax from tax record
- −$24 /mo · $291/yr
- Insurance
- −$38
- HOA
- −$0
- Vacancy / Maint / Mgmt
- −$231
- Net cashflow
- $324
Break-even live
Sensitivity live
| Price | -10% $376 | -5% $350 | +0% $324 | +5% $298 | +10% $272 |
|---|---|---|---|---|---|
| Rent | -10% $237 | -5% $281 | +0% $324 | +5% $367 | +10% $411 |
| Rate | -1.0pp $370 | -0.5pp $347 | base $324 | +0.5pp $300 | +1.0pp $276 |
UW: 25.0% down · 7.5% · 30yr · 1.5% tax · 5.0% vac · 8.0% maint · 8.0% mgmt
Financing live
Cash to close
- Down payment
- $23,000
- Closing costs
- $2,760
- Reserves months
- —
- Total cash needed
- —
Loan-product check · same deal, 3 products live
Conventional
25% down · 7.5% · 30yr
- Down + closing
- —
- Monthly P&I
- —
- Monthly cashflow
- —
- DSCR
- —
- Eligible?
- —
Personal DTI + credit; lowest rate.
DSCR
20% down · 8.5% · 30yr
- Down + closing
- —
- Monthly P&I
- —
- Monthly cashflow
- —
- DSCR
- —
- Eligible?
- —
No personal income docs; deal must DSCR.
Hard money
10% down · 12.0% · 12mo
- Down + closing
- —
- Monthly P&I
- —
- Monthly cashflow
- —
- DSCR
- —
- Eligible?
- —
Short-term bridge; refi at stabilization.
Rent comps 1 comps
| Address | Beds | Baths | Sqft | Rent | $/sqft | DOM | Units | Dist |
|---|---|---|---|---|---|---|---|---|
| 5 Park Dr Unit 221 Holiday Island, AR | 2.0 | 2.0 | 792 | $1,100 | $1.39 | 15d | 1 | 0.61mi |
Listing history 22 events
-
2026-06-21days on market $92,000 Active 103 DOM
-
2026-06-18days on market $92,000 Active 100 DOM
-
2026-06-17days on market $92,000 Active 99 DOM
-
2026-06-16days on market $92,000 Active 98 DOM
-
2026-06-15days on market $92,000 Active 97 DOM
-
2026-06-14days on market $92,000 Active 95 DOM
-
2026-06-13days on market $92,000 Active 94 DOM
-
2026-06-10days on market $92,000 Active 92 DOM
-
2026-06-09days on market $92,000 Active 91 DOM
-
2026-06-08days on market $92,000 Active 90 DOM
-
2026-06-07days on market $92,000 Active 89 DOM
-
2026-06-05days on market $92,000 Active 86 DOM
-
2026-06-03days on market $92,000 Active 85 DOM
-
2026-06-02days on market $92,000 Active 84 DOM
-
2026-06-01days on market $92,000 Active 83 DOM
-
2026-05-31days on market $92,000 Active 82 DOM
-
2026-03-09$92,000 Active 834-char remark
Show marketing remark (834 chars)
Priced for a quick sale! This 3-bedroom, 2-bath mobile home offers 1,152 square feet of opportunity for the right buyer. Remodeling was started but not completed, making this the perfect project for someone looking to finish it their own way and build instant equity. The living room features large bay windows, filling the space with natural light and creating an open, welcoming feel. Outside, you’ll find a spacious yard with plenty of room for outdoor living, pets, or future improvements. The property also includes a shed with electricity, ideal for storage, a workshop, or hobby space. Whether you’re an investor, renovator, or buyer looking for an affordable home to customize, this property offers strong potential at a great value. Being sold as-is and priced to move — bring your vision and make it yours!
-
2025-07-29soldstatus $72,000
-
2014-10-02soldstatus $39,900
-
2004-09-27soldstatus $24,000
-
1991-11-27soldstatus $27,000
-
1985-06-25soldstatus $35,000
ⓘ Source: listings_history table (triggers on properties + properties_extension) + one-shot
backfill from property_details.listing_events for pre-trigger history.
Tax reassessment forecast AR · Resets to sale price
- Current annual tax
- $291 · $24/mo
- Projected year-2 tax
- $589 · $49/mo
- Expected delta
- +$298/yr (+$25/mo · 102.5%)
ⓘ Screening estimate from a state-policy table — verify with the county assessor before closing.
Climate risk First Street
- Flood 1/10 Low FEMA zone X (unshaded) · 0% chance over 30 yrs
- Wildfire 4/10 Moderate
- Heat 4/10 Moderate 7 d/yr ≥105°F today · 21 d/yr by 30 yrs out
- Wind 2/10 Low 100% chance of damaging wind over 30 yrs
- Air quality 1/10 Low 0 unhealthy d/yr today · 0 by 30 yrs out
Nearby sold comps map
Loading sold comps map…
Walkable amenities ~0.75 mi
Loading nearby amenities…
Taxation est. · year 1
- Rental income
- $13,200
- − Mortgage interest
- −$5,153
- − Property taxes
- −$291
- − Insurance
- −$460
- − Repairs & maintenance
- −$1,056
- − Management
- −$1,056
- − Depreciation
- −$2,676
- Taxable income
- $2,507
- Est. tax owed @ 24.0%
- −$602
- After-tax cash flow
- $3,286/yr
For passive investors: Depreciation is non-cash, so a rental often shows a tax loss while cash-flowing — sheltering income. Rental losses are passive: they offset passive income freely, and up to $25,000/yr can offset ordinary (W-2) income if you actively participate and your MAGI is under $100k (phasing out to $0 by $150k); unused losses carry forward. On sale, claimed depreciation is recaptured at up to 25%, and gains may owe capital-gains tax (a 1031 exchange can defer both). Figures are a year-1 estimate at your 24.0% rate — not tax advice; consult a CPA.
Schools (NCES district)
- District
- Eureka Springs School District
- NCES district ID
- 0505970
- Math proficiency
- 37% ▼ -23.00%
- Reading proficiency
- 46% ▼ -9.00%
- Median HH income
- $37,912
- Composite
- 34.55/100
- National rank
- #5171
- State rank
- #61 of 238 in AR
Livability — Holiday Island
- Score
- 67/100
- State rank
- #104
- US rank
- #10660
Category grades
Schools grade is shown separately in the Schools card above.
Census & demographics
- Census place
- Holiday Island, AR
- Population (ZIP)
- 4,084
Population outlook (Carroll County) Hauer SSP2
- Today (2025)
- 28,014 people
- By 2030
- 28,006 · +-0.0%
- By 2040
- 28,242 · +0.8%
- By 2050
- 29,169 · +4.1%
- By 2075
- 33,935 · +21.1%
- By 2100
- 39,497 · +41.0%
Race, ethnicity, and origin ACS 2023
- Neighborhood character
- Predominantly White (91%)
- Race & ethnicity
- White 91% Two or more races 8% Hispanic / Latino 5%
- Common ancestry
- Lithuanian 7% Italian 4% Slovak 3%
- Foreign-born
- 4% · Canada
- Languages at home
- 95% English-only · Spanish 5%
Political lean MEDSL · Carroll
- 2024 margin
- Solid R (+31.7) · D 33.0% · R 64.7% · Other 2.2%
- 2008→2024 swing
- -13.6pp toward R · 2008: -18.1pp · 2024: -31.7pp
- All cycles
- 2024: R+31.7 2020: R+28.8 2016: R+32.3 2012: R+23.9 2008: R+18.1
Not yet ingested
- Civics
- —
Market trends
- HPI YoY
- ▲ 7.31%
- Current HPI
- 260.9347
- Rent YoY
- —
- Metro
- —
- State GDP YoY
- ▲ 3.80%
- F500 in state
- 10
Industry mix (Fortune 500 HQ in AR)
| Industry | F500 HQs | Revenue |
|---|---|---|
| Retail | 1 | $681B |
|
||
| Food / Agriculture | 1 | $53B |
|
||
| Retail / Energy | 1 | $22B |
|
||
| Transportation / Logistics | 1 | $12B |
|
||
| Energy | 1 | $4B |
|
||
Price history
+162.9% since first listed6 events — show timeline
- 2026-03-09 Listed $92,000 Fizber.com
- 2025-07-29 Sold (Public Records) $72,000 Public Records
- 2014-10-02 Sold (Public Records) $39,900 Public Records
- 2004-09-27 Sold (Public Records) $24,000 Public Records
- 1991-11-27 Sold (Public Records) $27,000 Public Records
- 1985-06-25 Sold (Public Records) $35,000 Public Records
Property tax history
+3.2%/yrLatest (2025): $291 · +18.5% YoY. Source: county tax records.
Cash-flow waterfall
monthlySold comps — $/sqft
last 12 mo · ≤1 miLoading sold comps…