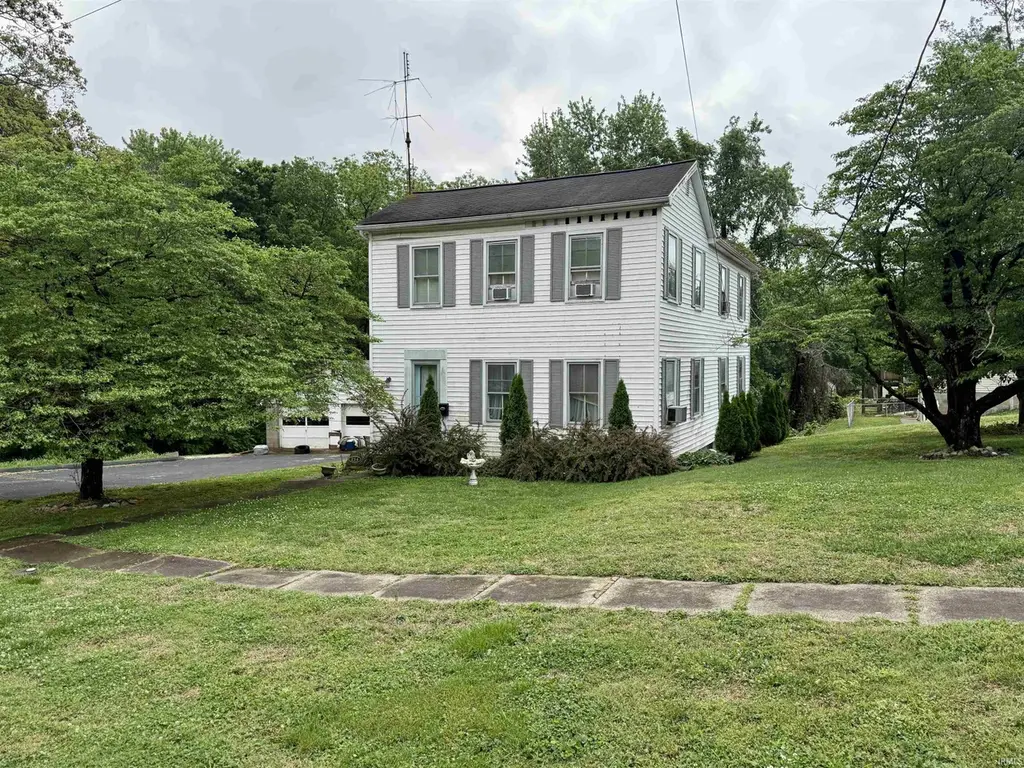
214 Seminary St · Rockport, IN
Flood risk 1/10 · Minimal
- FEMA flood zone
- X (unshaded)
- Chance of flooding over 30 yrs
- 0.0%
- Est. flood insurance / yr
- $473 – $860
Fire risk 1/10 · Minimal
- Est. fire insurance / yr
- $717 – $1,331
Heat risk 5/10 · Moderate
- Hot days now (above 107°F)
- 7 days/yr
- Hot days in 30 yrs
- 19 days/yr
Wind risk 2/10 · Minimal
- Chance of severe wind over 30 yrs
- 3.0%
Air-quality risk 2/10 · Minimal
- Unhealthy air days now
- 1 days/yr
- Unhealthy air days in 30 yrs
- 2 days/yr
Risk factors via First Street. Map © Google.
Why this score? — see what drove the B- grade
The composite is a weighted blend of 9 inputs, each scored 0–100. Each bar is that input's sub-score; the figure is the points it added to the 100-point composite (weight × sub-score).
- Cash flow +26.6/30.0
- ARV discount +10.3/15.0
- DSCR +9.1/10.0
- 1% rule +6.1/10.0
- Schools +4.2/10.0
- Livability +3.2/5.0
- Appreciation +2.5/10.0
- Rent growth +2.5/5.0
- Condition / age +2.5/5.0
$150,000
🖨 Deal sheet 📄 Offer letter ✓ Due diligence
Listing remarks
Spacious 4 Bedroom home on a large corner lot exceeding 1/2 acre in Rockport. This 2202 square feet property features a large living room, breakfast nook, and classic arched doorways. All appliances included. Additional highlights include: 1.5 baths, a 2-car detached garage, and a partial unfinished basement for extra storage. Built in 1890, the home sits on approximately 0.57 acres with plenty of outdoor space. This property is being sold in "as-is" condition.
Key facts
- 0.57 acre lot
- 2 garage spots
- Built 1890
Property features AI
Finance
- Other: Property listed by Keller Williams Elite
Exterior
- Parking: Detached 2-car garage
- Utilities: Public water; Public sewer
- Home design: Single-family residence (site-built); 2 stories
- Construction: Vinyl siding
- Exterior features: Rolling slope lot; Lot described as uneven
Interior
- Kitchen: Dishwasher; Microwave; Refrigerator; Electric range
- Bedrooms: 7 total rooms (bedroom count not specified)
- Bathrooms: 1 full bathroom; 1 half bathroom; One main-level bathroom
- Heating & cooling: Natural gas forced-air heating; Window cooling unit(s)
- Interior features: Dishwasher; Microwave; Refrigerator; Electric range; Partial unfinished basement
- Laundry & utility: Washer; Dryer; Laundry located in basement
Neighborhood map
What this means for you Summary
Snapshot
- This is a 4-bed/1.0-bath single-family listed at $150k.
Deal economics
- At list price, monthly cash flow is $400 ($5k/yr) — positive.
- The deal already cash-flows at list — no discount required.
- Meets the 1% rule at list price ($2k rent vs $150k).
- Recommended offer: $146k (3.0% below list) — sets the bar for market timing.
Location & tenants
- Location reads 64/100 on livability (#403 in IN) — a middle-class / working-renter tenant base. Strengths: crime A+, cost of living A+, housing A+; Watch: amenities F, commute F, employment D-.
- South Spencer County School Corporation (rural): math 46% / reading 54% proficiency, ranked #58 of 301 in IN (top 19%) — acceptable for families but not a draw, mixed tenant base, ~2y average lease.
- Zoned schools: Rockport-Ohio Elementary School (math 52% / reading 52%, grade C-, #237 of 994 statewide, top 26%, 318 students, 61% FRL); South Spencer Middle School (math 39% / reading 52%, grade D+, #79 of 330 statewide, top 24%, 228 students, 56% FRL); South Spencer High School (math 47% / reading 67%, grade C, #64 of 369 statewide, top 18%, 357 students, 44% FRL).
- Market conditions: 33 active listings in the ZIP; 78 units permitted in Spencer County in 2024 (0 in 5+ unit buildings).
Forward outlook
- Local home prices are declining (-3.0%/yr); year-one equity from $1k of loan paydown is wiped out by about $4k of value loss. Plan a longer hold.
- Spencer County population projected at -16% by 2050 — secular population decline; favor cash flow + early exit over multi-decade hold.
- At projected returns (-3.0% appreciation + 3.0% rent growth), your $42k cash investment doubles in ~10 years — after that, you're playing with house money.
Negotiation context
- It's been on market 49 days — a 3% lower offer ($146k) is reasonable based on typical stale-listing flexibility.
Risks & watch-outs
- Watch-outs: built in 1890 — expect roof / HVAC / electrical / plumbing capex.
- Climate carrying-cost: extreme-heat days projected 7→19/yr by 2055 (HVAC capex compounding) — expect insurance premiums to compound above CPI over the hold.
Questions for the listing agent
- It's been on market 49 days. Have you received any prior offers? Is the seller open to a 3% concession, seller financing, or rate buy-down credit?
- Built in 1890 — when were the roof, HVAC, electrical panel, plumbing, and water heater last replaced?
- Is there a deadline driving the sale (1031 exchange, divorce, estate, relocation)? That informs how much negotiation room exists.
- Schools are D-rated, which usually means shorter tenancies and higher turnover. Who's the typical renter profile here, and what's been the actual vacancy rate?
- What's the average days-on-market for RENTAL listings here right now (not sales)? A rising rental-DOM trend means longer vacancies and softer asking-rent achievability than the comps imply.
- What's the recent tenant-quality profile in this submarket — average credit score on applications, eviction rate, late-payment / NSF rate, and stable-employment percentage? A property-management company in the area should have these aggregated.
- How much new for-sale + rental construction is in the pipeline within 1–3 miles? Heavy new supply typically softens prices + rents 12–24 months out; constrained supply supports both.
Investment metrics
- 1% rule
- 1.11% ✓
- Cap rate
- 9.49%
- Cash-on-cash
- 11.42%
- DSCR
- 1.51
- GRM
- 7.5
CMA / ARV
- ARV (median comp)
- $160,126
- List price
- $150,000
- Delta
- -6.32%
- Verdict
- FAIR
- Comps
- 20 within 1.0 mi
Show comp detail 9 sales within ~0.75 mi
| Address | Dist | Beds/Ba | Sqft | Sold | Price | $/sf | Match |
|---|---|---|---|---|---|---|---|
| 343 S Third St | 0.11mi | 3/1.0 (-1) | 2,212 (+0%) | 6mo | $160,000 | $72 | 84 |
| 535 Seminary St | 0.25mi | 4/2.5 | 2,214 (+0%) | 12mo | $225,000 | $102 | 71 |
| 215 N Third St | 0.31mi | 3/2.0 (-1) | 2,368 (+8%) | 0mo | $144,000 | $61 | 64 |
| 650 Main St | 0.46mi | 3/1.5 (-1) | 2,176 (-1%) | 9mo | $239,500 | $110 | 62 |
| 206 Walnut St | 0.08mi | 3/2.0 (-1) | 1,883 (-14%) | 4mo | $110,000 | $58 | 60 |
| 407 Elm St | 0.29mi | 3/2.0 (-1) | 2,065 (-6%) | 10mo | $149,900 | $73 | 59 |
| 619 Williamson St | 0.49mi | 3/1.5 (-1) | 2,098 (-5%) | 9mo | $26,000 | $12 | 55 |
| 220 N 4th St | 0.32mi | 3/2.5 (-1) | 2,048 (-7%) | 12mo | $35,000 | $17 | 52 |
| 710 Elm St | 0.54mi | 3/2.0 (-1) | 2,324 (+6%) | 22mo | $221,900 | $95 | 39 |
Match score weights: distance 35% · size 25% · config 20% · recency 20%. Top-matched comps best support the ARV.
Projected returns pro-forma
-3.0% appreciation · 3.0% rent growth · sell at horizon
- IRR
- 0.7%
- Equity multiple
- 1.03×
- Total profit
- $1,106
- Equity at exit
- $22,365
- IRR
- 10.3%
- Equity multiple
- 1.80×
- Total profit
- $33,540
- Equity at exit
- $12,969
Cash invested: $42,000 (down + closing). Projections, not guarantees.
Landlord ↔ Tenant lean methodology
- Overall (STATE)
- 90 Strongly Landlord-Friendly
- State Indiana
- 90 Strongly Landlord-Friendly · R+11
- County
- — inherits STATE
- City
- — inherits STATE
ZIP-level market 47635
- Home prices YoY
- -2.4%
- Active inventory
- 33
- Price-to-rent
- 7.5×
Monthly cashflow live
- Estimated rent
- $1,659 medium interval (Pro) →
- Mortgage (P&I)
- −$787
- Tax from tax record
- −$62 /mo · $745/yr
- Insurance
- −$62
- HOA
- −$0
- Vacancy / Maint / Mgmt
- −$348
- Net cashflow
- $400
Break-even live
UW: 25.0% down · 7.5% · 30yr · 1.5% tax · 5.0% vac · 8.0% maint · 8.0% mgmt
Financing live
Cash to close
- Down payment
- $37,500
- Closing costs
- $4,500
- Reserves months
- —
- Total cash needed
- —
Loan-product check · same deal, 3 products live
Conventional
25% down · 7.5% · 30yr
- Down + closing
- —
- Monthly P&I
- —
- Monthly cashflow
- —
- DSCR
- —
- Eligible?
- —
Personal DTI + credit; lowest rate.
DSCR
20% down · 8.5% · 30yr
- Down + closing
- —
- Monthly P&I
- —
- Monthly cashflow
- —
- DSCR
- —
- Eligible?
- —
No personal income docs; deal must DSCR.
Hard money
10% down · 12.0% · 12mo
- Down + closing
- —
- Monthly P&I
- —
- Monthly cashflow
- —
- DSCR
- —
- Eligible?
- —
Short-term bridge; refi at stabilization.
Listing history 17 events
-
2026-06-18days on market $150,000 Active 49 DOM
-
2026-06-17days on market $150,000 Active 48 DOM
-
2026-06-16days on market $150,000 Active 47 DOM
-
2026-06-15days on market $150,000 Active 46 DOM
-
2026-06-14days on market $150,000 Active 44 DOM
-
2026-06-13days on market $150,000 Active 43 DOM
-
2026-06-10days on market $150,000 Active 41 DOM
-
2026-06-09days on market $150,000 Active 40 DOM
-
2026-06-08days on market $150,000 Active 39 DOM
-
2026-06-07days on market $150,000 Active 38 DOM
-
2026-06-05days on market $150,000 Active 35 DOM
-
2026-06-03days on market $150,000 Active 34 DOM
-
2026-06-02days on market $150,000 Active 33 DOM
-
2026-06-01days on market $150,000 Active 32 DOM
-
2026-05-31days on market $150,000 Active 31 DOM
-
2026-05-30days on market $150,000 Active 30 DOM
-
2026-04-30$150,000 Active 476-char remark
ⓘ Source: listings_history table (triggers on properties + properties_extension) + one-shot
backfill from property_details.listing_events for pre-trigger history.
Tax reassessment forecast IN · Partial reset (capped growth)
- Current annual tax
- $745 · $62/mo
- Projected year-2 tax
- $1,010 · $84/mo
- Expected delta
- +$265/yr (+$22/mo · 35.6%)
ⓘ Screening estimate from a state-policy table — verify with the county assessor before closing.
Climate risk First Street
- Flood 1/10 Low FEMA zone X (unshaded) · 0% chance over 30 yrs
- Wildfire 1/10 Low
- Heat 5/10 Major 7 d/yr ≥107°F today · 19 d/yr by 30 yrs out
- Wind 2/10 Low 3% chance of damaging wind over 30 yrs
- Air quality 2/10 Low 1 unhealthy d/yr today · 2 by 30 yrs out
Nearby sold comps map
Loading sold comps map…
Walkable amenities ~0.75 mi
Loading nearby amenities…
Taxation est. · year 1
- Rental income
- $19,914
- − Mortgage interest
- −$8,402
- − Property taxes
- −$745
- − Insurance
- −$750
- − Repairs & maintenance
- −$1,593
- − Management
- −$1,593
- − Depreciation
- −$4,364
- Taxable income
- $2,467
- Est. tax owed @ 24.0%
- −$592
- After-tax cash flow
- $4,206/yr
For passive investors: Depreciation is non-cash, so a rental often shows a tax loss while cash-flowing — sheltering income. Rental losses are passive: they offset passive income freely, and up to $25,000/yr can offset ordinary (W-2) income if you actively participate and your MAGI is under $100k (phasing out to $0 by $150k); unused losses carry forward. On sale, claimed depreciation is recaptured at up to 25%, and gains may owe capital-gains tax (a 1031 exchange can defer both). Figures are a year-1 estimate at your 24.0% rate — not tax advice; consult a CPA.
Schools (NCES district)
- District
- South Spencer County School Corporation
- NCES district ID
- 1810560
- Math proficiency
- 46% ▼ -6.00%
- Reading proficiency
- 54% ▼ -2.00%
- Median HH income
- $47,220
- Composite
- 42.49/100
- National rank
- #3208
- State rank
- #58 of 301 in IN
Livability — Rockport
- Score
- 64/100
- State rank
- #403
- US rank
- #14750
Category grades
Schools grade is shown separately in the Schools card above.
Census & demographics
- Census place
- Rockport, IN
- Population (ZIP)
- 5,578
Population outlook (Spencer County) Hauer SSP2
- Today (2025)
- 20,394 people
- By 2030
- 19,912 · -2.4%
- By 2040
- 18,592 · -8.8%
- By 2050
- 17,051 · -16.4%
- By 2075
- 14,010 · -31.3%
- By 2100
- 10,869 · -46.7%
Race, ethnicity, and origin ACS 2023
- Neighborhood character
- Predominantly White (93%)
- Race & ethnicity
- White 93% Two or more races 3% Hispanic / Latino 2% Black 1%
- Common ancestry
- Italian 3% Scottish 2% Iranian 2%
- Foreign-born
- 1% · China, Canada
- Languages at home
- 99% English-only · Spanish 1%
Political lean MEDSL · Spencer
- 2024 margin
- Solid R (+43.3) · D 27.4% · R 70.6% · Other 2.0%
- 2008→2024 swing
- -43.6pp toward R · 2008: 0.4pp · 2024: -43.3pp
- All cycles
- 2024: R+43.3 2020: R+38.5 2016: R+37.3 2012: R+15.3 2008: D+0.4
Not yet ingested
- Civics
- —
Market trends
- HPI YoY
- ▼ -4.91%
- Current HPI
- 199.6703
- Rent YoY
- —
- Metro
- —
- State GDP YoY
- ▲ 2.90%
- F500 in state
- 18
Industry mix (Fortune 500 HQ in IN)
| Industry | F500 HQs | Revenue |
|---|---|---|
| Industrial Machinery | 2 | $37B |
|
||
| Healthcare | 1 | $177B |
|
||
| Pharmaceuticals | 1 | $45B |
|
||
| Metals / Steel | 1 | $18B |
|
||
| Agriculture | 1 | $17B |
|
||
| Packaging | 1 | $12B |
|
||
Price history
1 event — show timeline
- 2026-04-30 Listed $150,000 IRMLS
Property tax history
-7.0%/yrLatest (2024): $745 · +53.3% YoY. Source: county tax records.
Cash-flow waterfall
monthlySold comps — $/sqft
last 12 mo · ≤1 miLoading sold comps…