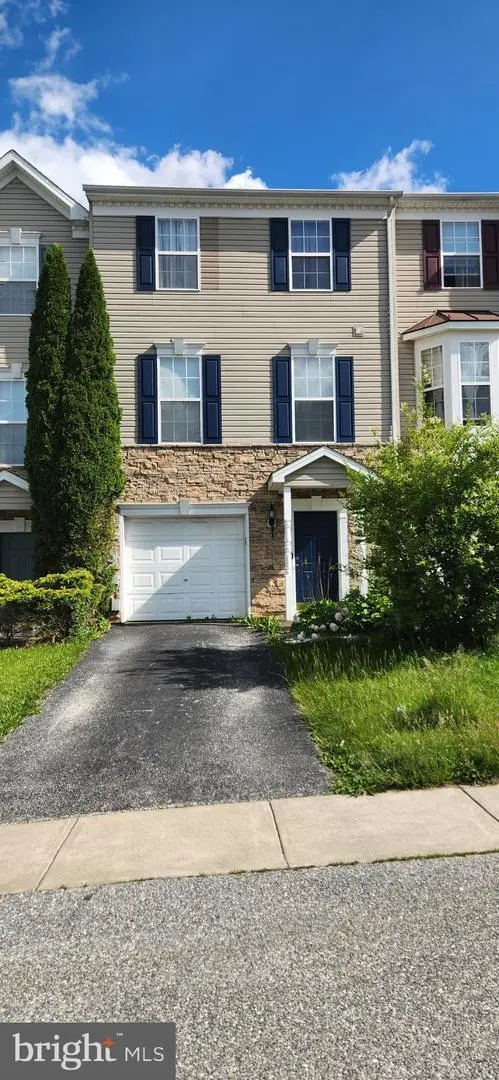
3887 Cannon Ct #3887 · North Codorus, PA
Flood risk 1/10 · Minimal
- FEMA flood zone
- X (unshaded)
- Chance of flooding over 30 yrs
- 0.0%
- Est. flood insurance / yr
- $473 – $860
Fire risk 3/10 · Minor
- Est. fire insurance / yr
- $511 – $949
Heat risk 5/10 · Moderate
- Hot days now (above 102°F)
- 7 days/yr
- Hot days in 30 yrs
- 15 days/yr
Wind risk 4/10 · Minor
- Chance of severe wind over 30 yrs
- 11.0%
Air-quality risk 3/10 · Minor
- Unhealthy air days now
- 2 days/yr
- Unhealthy air days in 30 yrs
- 4 days/yr
Risk factors via First Street. Map © Google.
Why this score? — see what drove the B+ grade
The composite is a weighted blend of 9 inputs, each scored 0–100. Each bar is that input's sub-score; the figure is the points it added to the 100-point composite (weight × sub-score).
- Cash flow +30.0/30.0
- ARV discount +15.0/15.0
- 1% rule +10.0/10.0
- DSCR +10.0/10.0
- Schools +4.8/10.0
- Rent growth +2.5/5.0
- Livability +2.5/5.0
- Condition / age +1.0/5.0
- Appreciation +0.0/10.0
$135,000
🖨 Deal sheet 📄 Offer letter ✓ Due diligence
Listing remarks MLS
Enjoy this Beautiful Townhome in a Quite neighborhood at Colonial Crossings. Featuring 3 Bedrooms and 2 1/2 Bathrooms this home is located in the Spring Grove School District. Kitchen with New Stainless Steel Appliances, Kitchen Island that's great for Entertaining and a Window overtop of the sink with views of the Rear of the house. New Luxury Vinyl Flooring that flow into the Dining Room and an Extra Room that would be perfect for a Office Space. Living Room and Renovated Bathroom also on Main Level. Upstairs is where the Bedrooms are, all with New Carpet. Master Bedroom has Vaulted Ceiling. Attached oversized 2 Car Garage. First floor is where the Laundry Room is located with ample amount of storage space. Professional photos coming soon, schedule your showing today!
Key facts
- $85 HOA
- 2 garage spots
- Built 2005
Property features AI
Finance
- HOA & community: Monthly HOA/condo fee of $85; Professionally managed off-site; HOA fee includes common area maintenance, snow removal, insurance, management, lawn maintenance and other services
Exterior
- Parking: Attached front-entry 2-car garage with inside access, garage door opener and additional storage; Asphalt driveway; On-street, off-street and driveway parking available
- Utilities: Public water; Public sewer; Natural gas available; Natural gas hot water; 200+ amp electric service; Municipal trash service
- Home design: Interior townhouse/rowhouse; Fee simple ownership; Below average condition
- Construction: Vinyl siding; Architectural shingle roof; Permanent foundation; Originally built (year source: assessor)
- Exterior features: Not in a federal flood zone; HOA-maintained roads; Blacktop road surface
Interior
- Kitchen: Kitchen with island
- Bedrooms: Three bedrooms on the upper level
- Flooring: Carpet; Vinyl
- Bathrooms: Two full bathrooms (upper level); One half bathroom (upper level)
- Heating & cooling: Forced air heating; Central air conditioning
- Interior features: Built-ins; Ceiling fans; Combination kitchen/dining area; Combination dining/living area; Dining area; Traditional floor plan; Kitchen island; Master bath; Soaking tub; Tub with shower; Walk-in closets; Drywall walls and ceilings
Neighborhood map
What this means for you Summary
Snapshot
- This is a 3-bed/2.5-bath townhouse listed at $135k. Condition is rated poor.
Deal economics
- At list price, monthly cash flow is $902 ($11k/yr) — positive.
- The deal already cash-flows at list — no discount required.
- Meets the 1% rule at list price ($2k rent vs $135k).
- Recommended offer: $133k (1.5% below list) — sets the bar for market timing.
Location & tenants
- Location reads: area grade B — affects rentability + tenant quality, not the cash-flow math above.
- Spring Grove Area SD (suburban): math 45% / reading 65% proficiency, ranked #98 of 539 in PA (top 18%) — acceptable for families but not a draw, mixed tenant base, ~2y average lease.
- Zoned schools: Spring Grove Area Hs (math 71%, 1,166 students, 32% FRL).
- Market conditions: 146 active listings in the ZIP; 2 comparable units currently listed for rent nearby; solid renter incomes; 1,328 units permitted in York County in 2024 (338 in 5+ unit buildings).
- This rent runs 31% of the median local income ($95k/yr) — at the standard rent-burdened threshold; future hikes will face affordability resistance.
Forward outlook
- Local home prices are declining (-3.0%/yr); year-one equity from $933 of loan paydown is wiped out by about $4k of value loss. Plan a longer hold.
- At projected returns (-3.0% appreciation + 3.0% rent growth), your $38k cash investment doubles in ~5 years — after that, you're playing with house money.
Negotiation context
- It's been on market 15 days — a 2% lower offer ($133k) is reasonable based on typical stale-listing flexibility.
- 3 sale attempts since 4y ago with the ask held roughly flat each time — persistent listings suggest the price (not the market) is what's stuck; bring a comps-based counter.
Risks & watch-outs
- Climate carrying-cost: extreme-heat days projected 7→15/yr by 2055 (HVAC capex compounding) — expect insurance premiums to compound above CPI over the hold.
Questions for the listing agent
- Have any recent inspections been done? Can we get a copy of the seller's disclosures and any deferred-maintenance estimates?
- What does the HOA fee cover, when was the last increase, and are there any pending special assessments or reserve-fund shortfalls?
- Is there a deadline driving the sale (1031 exchange, divorce, estate, relocation)? That informs how much negotiation room exists.
- What's the average days-on-market for RENTAL listings here right now (not sales)? A rising rental-DOM trend means longer vacancies and softer asking-rent achievability than the comps imply.
- What's the recent tenant-quality profile in this submarket — average credit score on applications, eviction rate, late-payment / NSF rate, and stable-employment percentage? A property-management company in the area should have these aggregated.
- How much new for-sale + rental construction is in the pipeline within 1–3 miles? Heavy new supply typically softens prices + rents 12–24 months out; constrained supply supports both.
Investment metrics
- 1% rule
- 1.80% ✓
- Cap rate
- 14.31%
- Cash-on-cash
- 28.64%
- DSCR
- 2.27
- GRM
- 4.6
CMA / ARV
- ARV (on-the-fly)
- $212,800
- Comps found
- 5
Show comp detail 5 sales within ~0.75 mi
| Address | Dist | Beds/Ba | Sqft | Sold | Price | $/sf | Match |
|---|---|---|---|---|---|---|---|
| 3892 Cannon Ct #3892 | 0.03mi | 3/2.5 | 1,600 (0%) | 2mo | $200,000 | $125 | 97 |
| 3590 Cannon Ln #3590 | 0.03mi | 3/2.5 | 1,628 (+2%) | 19mo | $230,000 | $141 | 80 |
| 3596 Cannon Ln | 0.02mi | 3/2.0 | 1,600 (0%) | 23mo | $212,000 | $133 | 78 |
| 3595 Armory Ln Unit 3595A | 0.08mi | 3/2.5 | 1,485 (-7%) | 12mo | $190,000 | $128 | 74 |
| 3709 Armory Ln #3709 | 0.16mi | 3/2.5 | 1,592 (-0%) | 21mo | $219,900 | $138 | 74 |
Match score weights: distance 35% · size 25% · config 20% · recency 20%. Top-matched comps best support the ARV.
Projected returns pro-forma
-3.0% appreciation · 3.0% rent growth · sell at horizon
- IRR
- 23.0%
- Equity multiple
- 1.94×
- Total profit
- $35,668
- Equity at exit
- $20,129
- IRR
- 31.0%
- Equity multiple
- 3.79×
- Total profit
- $105,402
- Equity at exit
- $11,672
Cash invested: $37,800 (down + closing). Projections, not guarantees.
Landlord ↔ Tenant lean methodology
- Overall (STATE)
- 62 Landlord-Friendly
- State Pennsylvania
- 62 Landlord-Friendly · EVEN
- County
- — inherits STATE
- City
- — inherits STATE
ZIP-level market 17408
- Home prices YoY
- -26.6%
- Active inventory
- 146
- Price-to-rent
- 4.6×
Monthly cashflow live
- Estimated rent
- $2,430 medium interval (Pro) →
- Mortgage (P&I)
- −$708
- Tax est. 1.5%
- −$169 /mo · $2,025/yr
- Insurance
- −$56
- HOA
- −$85
- Vacancy / Maint / Mgmt
- −$510
- Net cashflow
- $902
Break-even live
UW: 25.0% down · 7.5% · 30yr · 1.5% tax · 5.0% vac · 8.0% maint · 8.0% mgmt
Financing live
Cash to close
- Down payment
- $33,750
- Closing costs
- $4,050
- Reserves months
- —
- Total cash needed
- —
Loan-product check · same deal, 3 products live
Conventional
25% down · 7.5% · 30yr
- Down + closing
- —
- Monthly P&I
- —
- Monthly cashflow
- —
- DSCR
- —
- Eligible?
- —
Personal DTI + credit; lowest rate.
DSCR
20% down · 8.5% · 30yr
- Down + closing
- —
- Monthly P&I
- —
- Monthly cashflow
- —
- DSCR
- —
- Eligible?
- —
No personal income docs; deal must DSCR.
Hard money
10% down · 12.0% · 12mo
- Down + closing
- —
- Monthly P&I
- —
- Monthly cashflow
- —
- DSCR
- —
- Eligible?
- —
Short-term bridge; refi at stabilization.
Rent comps 2 comps
| Address | Beds | Baths | Sqft | Rent | $/sqft | DOM | Units | Dist |
|---|---|---|---|---|---|---|---|---|
| 1867 Buck Hill Dr York, PA | 4.0 | 2.5 | 2000 | $3,250 | $1.62 | 43d | 1 | 0.36mi |
| 3906 Tunnel Hill Rd York, PA | 2.0 | 1.0 | 1100 | $1,595 | $1.45 | 13d | 15 | 0.84mi |
HOA detail
- Monthly dues
- $85 · $1,020/yr
Listing history 12 events
-
2026-06-18days on market $135,000 Active 15 DOM
-
2026-06-17days on market $135,000 Active 14 DOM
-
2026-06-16days on market $135,000 Active 13 DOM
-
2026-06-15days on market $135,000 Active 12 DOM
-
2026-06-14days on market $135,000 Active 10 DOM
-
2026-06-13days on market $135,000 Active 9 DOM
-
2026-06-10days on market $135,000 Active 7 DOM
-
2026-06-09days on market $135,000 Active 6 DOM
-
2026-06-08days on market $135,000 Active 5 DOM
-
2026-06-07days on market $135,000 Active 4 DOM
-
2026-06-05remarks 312-char remark
-
2026-06-05$135,000 Active 1 DOM
ⓘ Source: listings_history table (triggers on properties + properties_extension) + one-shot
backfill from property_details.listing_events for pre-trigger history.
Climate risk First Street
- Flood 1/10 Low FEMA zone X (unshaded) · 0% chance over 30 yrs
- Wildfire 3/10 Moderate
- Heat 5/10 Major 7 d/yr ≥102°F today · 15 d/yr by 30 yrs out
- Wind 4/10 Moderate 11% chance of damaging wind over 30 yrs
- Air quality 3/10 Moderate 2 unhealthy d/yr today · 4 by 30 yrs out
Nearby sold comps map
Loading sold comps map…
Walkable amenities ~0.75 mi
Loading nearby amenities…
Taxation est. · year 1
- Rental income
- $29,165
- − Mortgage interest
- −$7,562
- − Property taxes
- −$2,025
- − Insurance
- −$675
- − Repairs & maintenance
- −$2,333
- − Management
- −$2,333
- − HOA
- −$1,020
- − Depreciation
- −$3,927
- Taxable income
- $9,289
- Est. tax owed @ 24.0%
- −$2,229
- After-tax cash flow
- $8,596/yr
For passive investors: Depreciation is non-cash, so a rental often shows a tax loss while cash-flowing — sheltering income. Rental losses are passive: they offset passive income freely, and up to $25,000/yr can offset ordinary (W-2) income if you actively participate and your MAGI is under $100k (phasing out to $0 by $150k); unused losses carry forward. On sale, claimed depreciation is recaptured at up to 25%, and gains may owe capital-gains tax (a 1031 exchange can defer both). Figures are a year-1 estimate at your 24.0% rate — not tax advice; consult a CPA.
Condition & rehab AI · 3 photos
This townhome requires extensive repairs and updates to bring it up to a livable condition. Significant investments in the exterior, interior, and systems are necessary to increase its value.
Repairs flagged
- Major siding — Severe weathering
- Major roof — Significant damage
- Major flooring — Worn carpet
- Major interior walls — Painted walls with visible wear
- Major kitchen — No appliances, no island
- Major bathrooms — No fixtures, no updates
- Major systems — No visible systems or appliances
Value-add opportunities
- Both New siding and paint — Enhances curb appeal and value
- Both New roof — Critical for long-term durability and value
- Both New flooring — Improves living space and value
- Both New kitchen appliances and island — Enhances functionality and value
- Both New bathroom fixtures and updates — Improves functionality and value
- Both New HVAC and mechanical systems — Ensures comfort and energy efficiency
Renovation cost estimate screening
| Repair item | Severity | Est. cost |
|---|---|---|
| siding · Severe weathering | Major | $15,000–50,000 |
| roof · Significant damage | Major | $15,000–50,000 |
| flooring · Worn carpet | Major | $15,000–50,000 |
| interior walls · Painted walls with visible wear | Major | $15,000–50,000 |
| kitchen · No appliances, no island | Major | $15,000–50,000 |
| bathrooms · No fixtures, no updates | Major | $15,000–50,000 |
| systems · No visible systems or appliances | Major | $15,000–50,000 |
| Total estimated repair cost · 7 items | $105,000–350,000 |
Value-add ROI direction
- Both New siding and paint — Enhances curb appeal and value ↑
- Both New roof — Critical for long-term durability and value ↑
- Both New flooring — Improves living space and value ↑
- Both New kitchen appliances and island — Enhances functionality and value ↑
- Both New bathroom fixtures and updates — Improves functionality and value ↑
- Both New HVAC and mechanical systems — Ensures comfort and energy efficiency ↑
ⓘ Cost ranges are severity-bucket heuristics (US national rule-of-thumb). Get contractor quotes + a written scope before underwriting a rehab budget.
Schools (NCES district)
- District
- Spring Grove Area SD
- NCES district ID
- 4222590
- Math proficiency
- 45% ▼ -14.00%
- Reading proficiency
- 65% ▼ -9.00%
- Median HH income
- $64,950
- Composite
- 48.28/100
- National rank
- #2155
- State rank
- #98 of 539 in PA
Livability — North Codorus
No livability data for this city. (Only ~50 U.S. cities are tracked.)
Census & demographics
- County
- York County · 278,806 people
- Metro
- York-Hanover, PA
- Population (ZIP)
- 25,431
- Household income
- $94,565
- Rent vs Own
- Severe rent burden
- 435.0
Population outlook (York County) Hauer SSP2
- Today (2025)
- 454,205 people
- By 2030
- 457,407 · +0.7%
- By 2040
- 457,529 · +0.7%
- By 2050
- 448,261 · -1.3%
- By 2075
- 427,388 · -5.9%
- By 2100
- 384,218 · -15.4%
Race, ethnicity, and origin ACS 2023
- Neighborhood character
- Predominantly White (78%)
- Race & ethnicity
- White 78% Hispanic / Latino 8% Two or more races 6% Black 5% Asian 4%
- Hispanic origin (detail)
- Mexican 1% Puerto Rican 6%
- Common ancestry
- Romanian 2% Slovak 2% Italian 1%
- Foreign-born
- 5% · Canada, Vietnam
- Languages at home
- 89% English-only · Spanish 6% Other Indo-European 2% Vietnamese 1%
Political lean MEDSL · York
- 2024 margin
- Strong R (+25.3) · D 36.9% · R 62.1%
- 2008→2024 swing
- -11.7pp toward R · 2008: -13.6pp · 2024: -25.3pp
- All cycles
- 2024: R+25.3 2020: R+24.6 2016: R+29.3 2012: R+21.2 2008: R+13.6
Not yet ingested
- Civics
- —
Market trends
- HPI YoY
- ▼ -86.74%
- Current HPI
- 239.5179
- Rent YoY
- —
- Metro
- York-Hanover, PA
- State GDP YoY
- ▲ 1.68%
- F500 in state
- 34
Industry mix (Fortune 500 HQ in PA)
| Industry | F500 HQs | Revenue |
|---|---|---|
| Healthcare | 2 | $309B |
|
||
| Insurance | 2 | $27B |
|
||
| Telecommunications / Media | 1 | $124B |
|
||
| Industrial Distribution | 1 | $22B |
|
||
| Financial Services | 1 | $20B |
|
||
| Chemicals / Materials | 1 | $18B |
|
||
Price history
-28.9% since first listed7 events — show timeline
- 2026-06-03 Listed $135,000 BRIGHT MLS
- 2022-11-30 Sold (MLS) $190,000 BRIGHT MLS
- 2022-10-15 Pending — BRIGHT MLS
- 2022-10-01 Relisted — BRIGHT MLS
- 2022-09-10 Pending — BRIGHT MLS
- 2022-09-09 Listed $189,900 BRIGHT MLS
- 2022-09-06 Coming Soon $189,900 BRIGHT MLS
Cash-flow waterfall
monthlySold comps — $/sqft
last 12 mo · ≤1 miLoading sold comps…