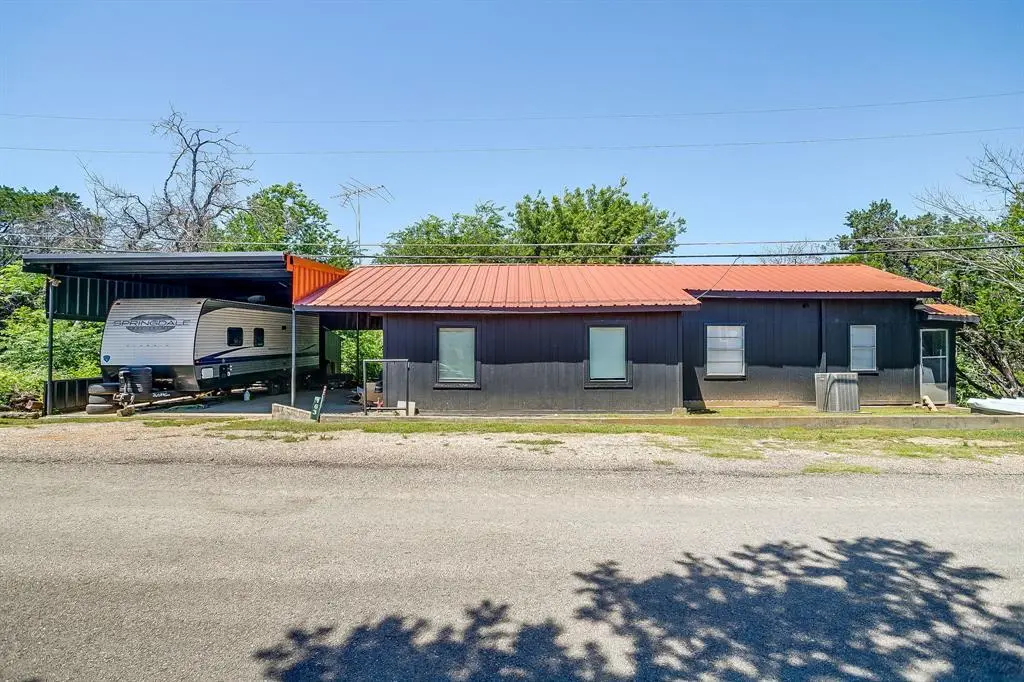
163 Giant Cedar Trl · Whitney, TX
Flood risk 1/10 · Minimal
- FEMA flood zone
- X (unshaded)
- Chance of flooding over 30 yrs
- 0.0%
- Est. flood insurance / yr
- $507 – $1,088
Fire risk 5/10 · Moderate
- Est. fire insurance / yr
- $1,222 – $2,270
Heat risk 6/10 · Moderate
- Hot days now (above 109°F)
- 7 days/yr
- Hot days in 30 yrs
- 24 days/yr
Wind risk 6/10 · Moderate
- Chance of severe wind over 30 yrs
- 27.0%
Air-quality risk 2/10 · Minimal
- Unhealthy air days now
- 1 days/yr
- Unhealthy air days in 30 yrs
- 1 days/yr
Risk factors via First Street. Map © Google.
Why this score? — see what drove the F grade
The composite is a weighted blend of 9 inputs, each scored 0–100. Each bar is that input's sub-score; the figure is the points it added to the 100-point composite (weight × sub-score).
- Cash flow +7.3/30.0
- Livability +3.6/5.0
- Schools +3.5/10.0
- Rent growth +2.5/5.0
- Condition / age +2.5/5.0
- 1% rule +1.6/10.0
- DSCR +1.5/10.0
- ARV discount +0.0/15.0
- Appreciation +0.0/10.0
$245,000
🖨 Deal sheet 📄 Offer letter ✓ Due diligence
Listing remarks MLS
This is an AS IS property! Home has a lot of potential, lake house, Air BnB. With the right buyer the possibilities are endless. You don't want to miss this one! Please use caution when walking on the back porch and stairs.
Key facts
- All new plumbing
- Two living areas
- New hvac system
Tags
Property features AI
Finance
- Financial info: Listing accepts Cash, Conventional, FHA, VA loan, and owner financing (owner will carry)
- HOA & community: No association
Exterior
- Parking: Attached carport with 2 covered spaces; RV access/parking
- Utilities: Co-op electric; Co-op water; Electricity connected; Septic; All-weather road access
- Home design: Single-family residence; Attached; Two levels; Built in 1960; Preowned
- Construction: Siding exterior; Metal roof; Slab foundation
- Exterior features: Covered deck; Covered rear porch; Deck; RV hookup; RV/boat parking; Adjacent to greenbelt; Interior lot with many trees and some trees
Interior
- Kitchen: Galley kitchen; Granite countertops; Electric range
- Bedrooms: 4 bedrooms (primary bedroom upstairs); Additional bedrooms on upper and lower levels
- Flooring: Carpet; Luxury vinyl plank
- Bathrooms: 2 full bathrooms
- Heating & cooling: Central heating (electric); Central air; Ceiling fans
- Interior features: Decorative lighting; Eat-in kitchen; Granite counters; High-speed internet available; Window coverings
- Laundry & utility: Washer hookup; Electric dryer hookup; Utility room
Neighborhood map
What this means for you Summary
Snapshot
- This is a 4-bed/2.0-bath single-family listed at $245k.
Deal economics
- At list price, monthly cash flow is $-328 ($-4k/yr) — negative.
- To cash-flow at today's rent, offer at most $187k (23.6% below list).
- To meet the 1% rule (rent ≥ 1% of price), the offer needs to be $162k (33.9% below list).
- Recommended offer: $162k (33.9% below list) — sets the bar for 1% rule.
- Cap rate 4.7% vs local median 3.0% in Whitney — top-decile yield for the area; either an underpriced asset or a hidden risk that comps aren't pricing in. Stress-test before assuming the spread holds.
Location & tenants
- Location reads 71/100 on livability (#282 in TX) — a middle-class / working-renter tenant base. Strengths: cost of living A+, housing A+, health & safety A-; Watch: amenities F, commute F, employment D-.
- Whitney ISD (rural): math 42% / reading 41% proficiency, ranked #378 of 826 in TX (top 46%) — families likely to look elsewhere, expect single-tenant / working-renter base with shorter leases.
- Zoned schools: Whitney El (393 students, 74% FRL) — zoned schools average 74% FRL vs 55% district-wide (19 pts higher); higher-poverty schools than district average — tighter screening recommended.
- Market conditions: 638 active listings in the ZIP; 65 units permitted in Hill County in 2024 (0 in 5+ unit buildings).
Forward outlook
- Local home prices are declining (-3.0%/yr); year-one equity from $2k of loan paydown is wiped out by about $7k of value loss. Plan a longer hold.
- Hill County population projected at -12% by 2050 — secular population decline; favor cash flow + early exit over multi-decade hold.
Negotiation context
- It's been on market 31 days — a 3% lower offer ($238k) is reasonable based on typical stale-listing flexibility.
- 7 sale attempts since 21y ago with the ask held roughly flat each time — persistent listings suggest the price (not the market) is what's stuck; bring a comps-based counter.
- Current owner paid $39k; list at $245k implies a 532% gain — meaningful room to come down on a strong offer.
Risks & watch-outs
- Climate carrying-cost: major wind risk, 27% chance of damaging wind over 30y; moderate wildfire risk; extreme-heat days projected 7→24/yr by 2055 (HVAC capex compounding) — expect insurance premiums to compound above CPI over the hold.
Questions for the listing agent
- What do current leases actually rent for vs. the listed asking? Can we see a recent rent roll and the last 12 months of T-12 income?
- It's been on market 31 days. Have you received any prior offers? Is the seller open to a 34% concession, seller financing, or rate buy-down credit?
- Built in 1960 — when were the roof, HVAC, electrical panel, plumbing, and water heater last replaced?
- Is there a deadline driving the sale (1031 exchange, divorce, estate, relocation)? That informs how much negotiation room exists.
- Schools are D-rated, which usually means shorter tenancies and higher turnover. Who's the typical renter profile here, and what's been the actual vacancy rate?
- The area grade is low — what's the realistic commute time and amenity access for the typical tenant pool here? Any planned neighborhood developments (good or bad) we should know about?
- What's the average days-on-market for RENTAL listings here right now (not sales)? A rising rental-DOM trend means longer vacancies and softer asking-rent achievability than the comps imply.
- What's the recent tenant-quality profile in this submarket — average credit score on applications, eviction rate, late-payment / NSF rate, and stable-employment percentage? A property-management company in the area should have these aggregated.
- How much new for-sale + rental construction is in the pipeline within 1–3 miles? Heavy new supply typically softens prices + rents 12–24 months out; constrained supply supports both.
Investment metrics
- 1% rule
- 0.66% ✗
- Cap rate
- 4.69%
- Cash-on-cash
- -5.73%
- DSCR
- 0.75
- GRM
- 12.6
CMA / ARV
- ARV (on-the-fly)
- $193,402
- Comps found
- 5
Show comp detail 5 sales within ~0.75 mi
| Address | Dist | Beds/Ba | Sqft | Sold | Price | $/sf | Match |
|---|---|---|---|---|---|---|---|
| 138 Quail Lake Dr E | 0.26mi | 3/2.0 (-1) | 1,305 (+0%) | 7mo | $245,000 | $188 | 76 |
| 112 Post Oak Bnd | 0.23mi | 3/1.0 (-1) | 1,264 (-3%) | 16mo | $177,900 | $141 | 63 |
| 103 Sulak | 0.59mi | 3/2.0 (-1) | 1,344 (+4%) | 5mo | $200,000 | $149 | 57 |
| 114 Quail Lake Dr W | 0.38mi | 3/2.0 (-1) | 1,480 (+14%) | 2mo | $299,000 | $202 | 52 |
| 109 Bluebonnet Dr | 0.56mi | 3/2.0 (-1) | 1,424 (+10%) | 1mo | $189,000 | $133 | 52 |
Match score weights: distance 35% · size 25% · config 20% · recency 20%. Top-matched comps best support the ARV.
Projected returns pro-forma
-3.0% appreciation · 3.0% rent growth · sell at horizon
- IRR
- -26.1%
- Equity multiple
- 0.12×
- Total profit
- $-60,589
- Equity at exit
- $36,530
- IRR
- -23.1%
- Equity multiple
- -0.16×
- Total profit
- $-79,738
- Equity at exit
- $21,183
Cash invested: $68,600 (down + closing). Projections, not guarantees.
Landlord ↔ Tenant lean methodology
- Overall (STATE)
- 87 Strongly Landlord-Friendly
- State Texas
- 87 Strongly Landlord-Friendly · R+5
- County
- — inherits STATE
- City
- — inherits STATE
ZIP-level market 76692
- Home prices YoY
- -6.5%
- Active inventory
- 638
- Price-to-rent
- 12.6×
Monthly cashflow live
- Estimated rent
- $1,618 medium interval (Pro) →
- Mortgage (P&I)
- −$1,285
- Tax from tax record
- −$219 /mo · $2,631/yr
- Insurance
- −$102
- HOA
- −$0
- Vacancy / Maint / Mgmt
- −$340
- Net cashflow
- $-328
Break-even live
UW: 25.0% down · 7.5% · 30yr · 1.5% tax · 5.0% vac · 8.0% maint · 8.0% mgmt
Financing live
Cash to close
- Down payment
- $61,250
- Closing costs
- $7,350
- Reserves months
- —
- Total cash needed
- —
Loan-product check · same deal, 3 products live
Conventional
25% down · 7.5% · 30yr
- Down + closing
- —
- Monthly P&I
- —
- Monthly cashflow
- —
- DSCR
- —
- Eligible?
- —
Personal DTI + credit; lowest rate.
DSCR
20% down · 8.5% · 30yr
- Down + closing
- —
- Monthly P&I
- —
- Monthly cashflow
- —
- DSCR
- —
- Eligible?
- —
No personal income docs; deal must DSCR.
Hard money
10% down · 12.0% · 12mo
- Down + closing
- —
- Monthly P&I
- —
- Monthly cashflow
- —
- DSCR
- —
- Eligible?
- —
Short-term bridge; refi at stabilization.
Listing history 39 events
-
2026-06-18days on market $245,000 Active 31 DOM
-
2026-06-17days on market $245,000 Active 30 DOM
-
2026-06-16days on market $245,000 Active 29 DOM
-
2026-06-15days on market $245,000 Active 28 DOM
-
2026-06-15days on market $245,000 Active 27 DOM
-
2026-06-13days on market $245,000 Active 26 DOM
-
2026-06-12days on market $245,000 Active 25 DOM
-
2026-06-09days on market $245,000 Active 22 DOM
-
2026-06-08days on market $245,000 Active 21 DOM
-
2026-06-08days on market $245,000 Active 20 DOM
-
2026-06-07days on market $245,000 Active 19 DOM
-
2026-06-03days on market $245,000 Active 16 DOM
-
2026-06-02pricedays on market $245,000 Active 15 DOM
-
2026-06-01days on market $249,000 Active 14 DOM
-
2026-05-31days on market $249,000 Active 13 DOM
-
2026-05-18$249,000 Active
-
2023-10-04historical
-
2023-09-06$149,000 Active
-
2022-10-18soldstatus
-
2022-10-11soldstatus Closed 224-char remark
Show marketing remark (224 chars)
This is an AS IS property! Home has a lot of potential, lake house, Air BnB. With the right buyer the possibilities are endless. You don't want to miss this one! Please use caution when walking on the back porch and stairs.
-
2022-09-12status Pending 224-char remark
Show marketing remark (224 chars)
This is an AS IS property! Home has a lot of potential, lake house, Air BnB. With the right buyer the possibilities are endless. You don't want to miss this one! Please use caution when walking on the back porch and stairs.
-
2022-09-07historical Active Option Contract 224-char remark
Show marketing remark (224 chars)
This is an AS IS property! Home has a lot of potential, lake house, Air BnB. With the right buyer the possibilities are endless. You don't want to miss this one! Please use caution when walking on the back porch and stairs.
-
2022-08-18price $112,000 224-char remark
Show marketing remark (224 chars)
This is an AS IS property! Home has a lot of potential, lake house, Air BnB. With the right buyer the possibilities are endless. You don't want to miss this one! Please use caution when walking on the back porch and stairs.
-
2022-07-11status Active 224-char remark
Show marketing remark (224 chars)
This is an AS IS property! Home has a lot of potential, lake house, Air BnB. With the right buyer the possibilities are endless. You don't want to miss this one! Please use caution when walking on the back porch and stairs.
-
2022-07-08status Pending 224-char remark
Show marketing remark (224 chars)
This is an AS IS property! Home has a lot of potential, lake house, Air BnB. With the right buyer the possibilities are endless. You don't want to miss this one! Please use caution when walking on the back porch and stairs.
-
2022-06-22$119,000 Active 224-char remark
Show marketing remark (224 chars)
This is an AS IS property! Home has a lot of potential, lake house, Air BnB. With the right buyer the possibilities are endless. You don't want to miss this one! Please use caution when walking on the back porch and stairs.
-
2022-05-06historical
-
2022-04-27price $138,000
-
2022-03-25price $140,000
-
2022-03-01price $152,000
-
2022-02-03$164,900 Active
-
2021-07-16soldstatus $38,750
-
2015-09-08soldstatus Sold
-
2015-07-14status Pending
-
2015-06-12$56,180 Active
-
2006-03-09soldstatus
-
2006-03-09soldstatus
-
2006-01-23historical
-
2005-11-01$77,500
ⓘ Source: listings_history table (triggers on properties + properties_extension) + one-shot
backfill from property_details.listing_events for pre-trigger history.
Tax reassessment forecast TX · Resets to sale price
- Current annual tax
- $2,631 · $219/mo
- Projected year-2 tax
- $4,484 · $374/mo
- Expected delta
- +$1,853/yr (+$154/mo · 70.4%)
ⓘ Screening estimate from a state-policy table — verify with the county assessor before closing.
Climate risk First Street
- Flood 1/10 Low FEMA zone X (unshaded) · 0% chance over 30 yrs
- Wildfire 5/10 Major
- Heat 6/10 Major 7 d/yr ≥109°F today · 24 d/yr by 30 yrs out
- Wind 6/10 Major 27% chance of damaging wind over 30 yrs
- Air quality 2/10 Low 1 unhealthy d/yr today · 1 by 30 yrs out
Nearby sold comps map
Loading sold comps map…
Walkable amenities ~0.75 mi
Loading nearby amenities…
Taxation est. · year 1
- Rental income
- $19,422
- − Mortgage interest
- −$13,724
- − Property taxes
- −$2,631
- − Insurance
- −$1,225
- − Repairs & maintenance
- −$1,554
- − Management
- −$1,554
- − Depreciation
- −$7,127
- Taxable loss
- −$8,393
- Est. tax savings @ 24.0%
- +$2,014
- After-tax cash flow
- $-1,916/yr
For passive investors: Depreciation is non-cash, so a rental often shows a tax loss while cash-flowing — sheltering income. Rental losses are passive: they offset passive income freely, and up to $25,000/yr can offset ordinary (W-2) income if you actively participate and your MAGI is under $100k (phasing out to $0 by $150k); unused losses carry forward. On sale, claimed depreciation is recaptured at up to 25%, and gains may owe capital-gains tax (a 1031 exchange can defer both). Figures are a year-1 estimate at your 24.0% rate — not tax advice; consult a CPA.
Schools (NCES district)
- District
- Whitney ISD
- NCES district ID
- 4845720
- Math proficiency
- 42% ▬ 0.00%
- Reading proficiency
- 41% ▲ 3.00%
- Median HH income
- $41,861
- Composite
- 34.97/100
- National rank
- #5060
- State rank
- #378 of 826 in TX
Livability — Whitney
- Score
- 71/100
- State rank
- #282
- US rank
- #6568
Category grades
Schools grade is shown separately in the Schools card above.
Census & demographics
- Population (ZIP)
- 9,662
Population outlook (Hill County) Hauer SSP2
- Today (2025)
- 34,013 people
- By 2030
- 33,289 · -2.1%
- By 2040
- 31,688 · -6.8%
- By 2050
- 30,100 · -11.5%
- By 2075
- 26,818 · -21.2%
- By 2100
- 22,918 · -32.6%
Race, ethnicity, and origin ACS 2023
- Neighborhood character
- Predominantly White (83%)
- Race & ethnicity
- White 83% Hispanic / Latino 12% Two or more races 4% Black 2%
- Hispanic origin (detail)
- Mexican 11%
- Common ancestry
- Italian 3% Lithuanian 2% Romanian 2%
- Foreign-born
- 4% · Canada, Vietnam
- Languages at home
- 90% English-only · Spanish 9%
Political lean MEDSL · Hill
- 2024 margin
- Solid R (+64.4) · D 17.5% · R 81.8%
- 2008→2024 swing
- -23.0pp toward R · 2008: -41.4pp · 2024: -64.4pp
- All cycles
- 2024: R+64.4 2020: R+60.7 2016: R+58.4 2012: R+53.0 2008: R+41.4
Not yet ingested
- Civics
- —
Market trends
- HPI YoY
- ▼ -17.72%
- Current HPI
- 252.9827
- Rent YoY
- —
- Metro
- —
- State GDP YoY
- ▲ 3.95%
- F500 in state
- 110
Industry mix (Fortune 500 HQ in TX)
| Industry | F500 HQs | Revenue |
|---|---|---|
| Energy | 16 | $1,198B |
|
||
| Technology | 5 | $198B |
|
||
| Engineering / Construction | 4 | $72B |
|
||
| Energy Services | 3 | $60B |
|
||
| Utilities | 3 | $41B |
|
||
| Healthcare | 2 | $330B |
|
||
Price history
+221.3% since first listed24 events — show timeline
- 2026-05-18 Listed $249,000 NTREIS
- 2023-10-04 Listing Removed — NTREIS
- 2023-09-06 Listed $149,000 NTREIS
- 2022-10-18 Sold (Public Records) — Public Records
- 2022-10-11 Sold (MLS) — NTREIS
- 2022-09-12 Pending — NTREIS
- 2022-09-07 Contingent — NTREIS
- 2022-08-18 Price Changed $112,000 NTREIS
- 2022-07-11 Relisted — NTREIS
- 2022-07-08 Pending — NTREIS
- 2022-06-22 Listed $119,000 NTREIS
- 2022-05-06 Listing Removed — NTREIS
- 2022-04-27 Price Changed $138,000 NTREIS
- 2022-03-25 Price Changed $140,000 NTREIS
- 2022-03-01 Price Changed $152,000 NTREIS
- 2022-02-03 Listed $164,900 NTREIS
- 2021-07-16 Sold (Public Records) $38,750 Public Records
- 2015-09-08 Sold (MLS) — NTREIS
- 2015-07-14 Pending — NTREIS
- 2015-06-12 Listed $56,180 NTREIS
- 2006-03-09 Sold (Public Records) — Public Records
- 2006-03-09 Sold (MLS) — NTREIS
- 2006-01-23 Listing Removed — NTREIS
- 2005-11-01 Listed $77,500 NTREIS
Property tax history
+4.6%/yrLatest (2025): $2,631 · +2.3% YoY. Source: county tax records.
Cash-flow waterfall
monthlySold comps — $/sqft
last 12 mo · ≤1 miLoading sold comps…