 61-Plex
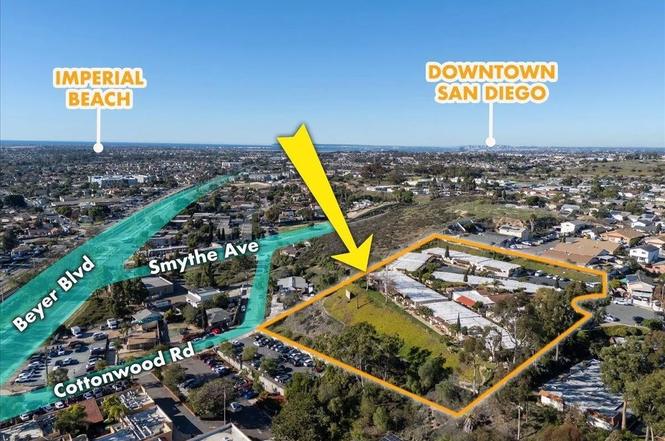
279-291 Padua Hills Pl · San Diego, CA
Flood risk 1/10 · Minimal
- FEMA flood zone
- X (unshaded)
- Chance of flooding over 30 yrs
- 0.0%
- Est. flood insurance / yr
- $507 – $1,088
Fire risk 4/10 · Minor
- Est. fire insurance / yr
- $659 – $1,223
Heat risk 4/10 · Minor
- Hot days now (above 88°F)
- 5 days/yr
- Hot days in 30 yrs
- 13 days/yr
Wind risk 1/10 · Minimal
- Chance of severe wind over 30 yrs
- —
Air-quality risk 3/10 · Minor
- Unhealthy air days now
- 3 days/yr
- Unhealthy air days in 30 yrs
- 3 days/yr
Risk factors via First Street. Map © Google.
Why this score? — see what drove the C+ grade
The composite is a weighted blend of 9 inputs, each scored 0–100. Each bar is that input's sub-score; the figure is the points it added to the 100-point composite (weight × sub-score).
- Cash flow +25.3/30.0
- DSCR +8.3/10.0
- ARV discount +7.5/15.0
- 1% rule +6.6/10.0
- Schools +3.9/10.0
- Livability +3.8/5.0
- Rent growth +2.5/5.0
- Condition / age +2.5/5.0
- Appreciation +0.0/10.0
$13,200,000
🖨 Deal sheet 📄 Offer letter ✓ Due diligence
Multi-family units
County records classify this as Multi-Family (5+ Unit). Listing-text estimate: 61 units. confirmed
5+ unit building — per-unit beds/baths from public records are typically unavailable; the breakdown below (if shown) is an estimate from the listing text.
Listing remarks
Vista Del Pacifico is a 61-unit seniors apartment complex situated on a 116,740 square foot lot in San Ysidro with 180 degree views of the Pacific Ocean, Tijuana and San Ysidro. The approximately 33,025 square feet of stucco and frame structures were built in 1978 and feature one story units. There are 40 gated parking spaces with a recently resurfaced parking lot. There are multiple storage areas, a large laundry room with 3 owned washers and 3 owned dryers as well as an onsite manager’s office and workshop. The onsite manager’s unit is a 3 Bedroom / 2 Bathroom unit with laundry hook ups and an enclosed patio. There are 6 additional buildings consisting of sixty, approximately
Key facts
- Gated parking spaces
- Large laundry room
- 180 degree views
Tags
Property features AI
Exterior
- Parking: 40 total parking spaces
- Home design: Residential income property (commercial-residential income subtype)
- Exterior features: Property sits on 2.5–5.0 acres
Interior
- Bathrooms: 62 full bathrooms
- Interior features: Unbranded virtual tour available
Neighborhood map
What this means for you Summary
Snapshot
- This is a 61 × 3-bed/2-bath units multifamily listed at $13.20M.
Deal economics
- At list price, monthly cash flow is $30k ($358k/yr) — positive. Per door: $490/mo.
- The deal already cash-flows at list — no discount required.
- Meets the 1% rule at list price ($153k rent vs $13.20M).
- Recommended offer: $11.62M (12.0% below list) — sets the bar for market timing.
- Cap rate 9.0% vs local median 2.0% in San Diego — top-decile yield for the area; either an underpriced asset or a hidden risk that comps aren't pricing in. Stress-test before assuming the spread holds.
Location & tenants
- Location reads 75/100 on livability (#123 in CA, #4,206 nationally) — a middle-class / working-renter tenant base. Strengths: amenities A+, commute A+, employment A+; Watch: health & safety C-, crime D+, cost of living F.
- Sweetwater Union High (suburban): math 36% / reading 52% proficiency, ranked #187 of 517 in CA (top 36%) — families likely to look elsewhere, expect single-tenant / working-renter base with shorter leases.
- Market conditions: 27 active listings in the ZIP; 11,759 units permitted in San Diego County in 2024 (7,244 in 5+ unit buildings).
- At $153,283/mo this rent would consume 2636% of the median local household income ($70k/yr) (locally 1542% of renters already pay >50% of income on rent) — very limited rent-growth headroom before tenants either downsize or default.
Forward outlook
- Local home prices are declining (-3.0%/yr); year-one equity from $91k of loan paydown is wiped out by about $396k of value loss. Plan a longer hold.
- San Diego County population projected at +20% by 2050 — long-run rental-demand tailwind backs the buy-and-hold thesis.
Negotiation context
- It's been on market 149 days — a 12% lower offer ($11.62M) is reasonable based on typical stale-listing flexibility.
Questions for the listing agent
- It's been on market 149 days. Have you received any prior offers? Is the seller open to a 12% concession, seller financing, or rate buy-down credit?
- Can we see the unit-by-unit rent roll, current vacancy, and any below-market leases? What's the average tenancy length?
- What capital expenditures (roof, boiler, parking lot, exteriors) have been made in the last 5 years, and what's planned in the next 2?
- Why hasn't it sold? Are there any deal-killer items the seller is aware of (foundation, flood, title, zoning, code violations)?
- Is there a deadline driving the sale (1031 exchange, divorce, estate, relocation)? That informs how much negotiation room exists.
- Schools are B-rated — typically a magnet for longer-tenancy family renters. What's the average tenant stay here, and is there a school-zone premium baked into asking?
- Crime grade is D in this area — have there been break-ins, vandalism, or insurance claims at this property in the last 3 years? What carrier currently insures it and at what premium?
- What's the average days-on-market for RENTAL listings here right now (not sales)? A rising rental-DOM trend means longer vacancies and softer asking-rent achievability than the comps imply.
- What's the recent tenant-quality profile in this submarket — average credit score on applications, eviction rate, late-payment / NSF rate, and stable-employment percentage? A property-management company in the area should have these aggregated.
- How much new apartment / multifamily construction is in the pipeline within 1–3 miles? Heavy new supply (>2% of stock underway) typically softens rents 12–24 months out; light construction supports rent growth.
Investment metrics
- 1% rule
- 1.16% ✓
- Cap rate
- 9.01%
- Cash-on-cash
- 9.70%
- DSCR
- 1.43
- GRM
- 7.2
CMA / ARV
No comps found within radius.
Projected returns pro-forma
-3.0% appreciation · 3.0% rent growth · sell at horizon
- IRR
- -1.7%
- Equity multiple
- 0.94×
- Total profit
- $-234,133
- Equity at exit
- $1,968,163
- IRR
- 8.0%
- Equity multiple
- 1.61×
- Total profit
- $2,255,319
- Equity at exit
- $1,141,295
Cash invested: $3,696,000 (down + closing). Projections, not guarantees.
Landlord ↔ Tenant lean methodology
- Overall (STATE)
- 18 Strongly Tenant-Friendly
- State California
- 18 Strongly Tenant-Friendly · D+13
- County
- — inherits STATE
- City
- — inherits STATE
ZIP-level market 92173
- Home prices YoY
- -19.0%
- Active inventory
- 27
- Price-to-rent
- 437.8×
Monthly cashflow live
- Estimated rent
- $153,283 high interval (Pro) →
- Mortgage (P&I)
- −$69,222
- Tax est. 1.5%
- −$16,500 /mo · $198,000/yr
- Insurance
- −$5,500
- HOA
- −$0
- Vacancy / Maint / Mgmt
- −$32,189
- Net cashflow
- $29,871
Break-even live
61-unit breakdown (identical units grouped — click to expand)
| Units | Beds | Baths | Est. rent |
|---|---|---|---|
| 61× units | 3 | 2 | $153,293 |
| #1 | 3 | 2 | $2,513 |
| #2 | 3 | 2 | $2,513 |
| #3 | 3 | 2 | $2,513 |
| #4 | 3 | 2 | $2,513 |
| #5 | 3 | 2 | $2,513 |
| #6 | 3 | 2 | $2,513 |
| #7 | 3 | 2 | $2,513 |
| #8 | 3 | 2 | $2,513 |
| #9 | 3 | 2 | $2,513 |
| #10 | 3 | 2 | $2,513 |
| #11 | 3 | 2 | $2,513 |
| #12 | 3 | 2 | $2,513 |
| #13 | 3 | 2 | $2,513 |
| #14 | 3 | 2 | $2,513 |
| #15 | 3 | 2 | $2,513 |
| #16 | 3 | 2 | $2,513 |
| #17 | 3 | 2 | $2,513 |
| #18 | 3 | 2 | $2,513 |
| #19 | 3 | 2 | $2,513 |
| #20 | 3 | 2 | $2,513 |
| #21 | 3 | 2 | $2,513 |
| #22 | 3 | 2 | $2,513 |
| #23 | 3 | 2 | $2,513 |
| #24 | 3 | 2 | $2,513 |
| #25 | 3 | 2 | $2,513 |
| #26 | 3 | 2 | $2,513 |
| #27 | 3 | 2 | $2,513 |
| #28 | 3 | 2 | $2,513 |
| #29 | 3 | 2 | $2,513 |
| #30 | 3 | 2 | $2,513 |
| #31 | 3 | 2 | $2,513 |
| #32 | 3 | 2 | $2,513 |
| #33 | 3 | 2 | $2,513 |
| #34 | 3 | 2 | $2,513 |
| #35 | 3 | 2 | $2,513 |
| #36 | 3 | 2 | $2,513 |
| #37 | 3 | 2 | $2,513 |
| #38 | 3 | 2 | $2,513 |
| #39 | 3 | 2 | $2,513 |
| #40 | 3 | 2 | $2,513 |
| #41 | 3 | 2 | $2,513 |
| #42 | 3 | 2 | $2,513 |
| #43 | 3 | 2 | $2,513 |
| #44 | 3 | 2 | $2,513 |
| #45 | 3 | 2 | $2,513 |
| #46 | 3 | 2 | $2,513 |
| #47 | 3 | 2 | $2,513 |
| #48 | 3 | 2 | $2,513 |
| #49 | 3 | 2 | $2,513 |
| #50 | 3 | 2 | $2,513 |
| #51 | 3 | 2 | $2,513 |
| #52 | 3 | 2 | $2,513 |
| #53 | 3 | 2 | $2,513 |
| #54 | 3 | 2 | $2,513 |
| #55 | 3 | 2 | $2,513 |
| #56 | 3 | 2 | $2,513 |
| #57 | 3 | 2 | $2,513 |
| #58 | 3 | 2 | $2,513 |
| #59 | 3 | 2 | $2,513 |
| #60 | 3 | 2 | $2,513 |
| #61 | 3 | 2 | $2,513 |
| Total (61 units) | $153,283 | ||
UW: 25.0% down · 7.5% · 30yr · 1.5% tax · 5.0% vac · 8.0% maint · 8.0% mgmt
Financing live
Cash to close
- Down payment
- $3,300,000
- Closing costs
- $396,000
- Reserves months
- —
- Total cash needed
- —
Loan-product check · same deal, 3 products live
Conventional
25% down · 7.5% · 30yr
- Down + closing
- —
- Monthly P&I
- —
- Monthly cashflow
- —
- DSCR
- —
- Eligible?
- —
Personal DTI + credit; lowest rate.
DSCR
20% down · 8.5% · 30yr
- Down + closing
- —
- Monthly P&I
- —
- Monthly cashflow
- —
- DSCR
- —
- Eligible?
- —
No personal income docs; deal must DSCR.
Hard money
10% down · 12.0% · 12mo
- Down + closing
- —
- Monthly P&I
- —
- Monthly cashflow
- —
- DSCR
- —
- Eligible?
- —
Short-term bridge; refi at stabilization.
Listing history 15 events
-
2026-06-18days on market $13,200,000 Active 149 DOM
-
2026-06-17days on market $13,200,000 Active 148 DOM
-
2026-06-16days on market $13,200,000 Active 147 DOM
-
2026-06-15days on market $13,200,000 Active 146 DOM
-
2026-06-13days on market $13,200,000 Active 144 DOM
-
2026-06-13days on market $13,200,000 Active 143 DOM
-
2026-06-09days on market $13,200,000 Active 140 DOM
-
2026-06-08days on market $13,200,000 Active 139 DOM
-
2026-06-07days on market $13,200,000 Active 138 DOM
-
2026-06-04days on market $13,200,000 Active 135 DOM
-
2026-06-03days on market $13,200,000 Active 134 DOM
-
2026-06-02days on market $13,200,000 Active 133 DOM
-
2026-06-01days on market $13,200,000 Active 132 DOM
-
2026-05-31days on market $13,200,000 Active 131 DOM
-
2025-12-15$13,200,000 Active
ⓘ Source: listings_history table (triggers on properties + properties_extension) + one-shot
backfill from property_details.listing_events for pre-trigger history.
Climate risk First Street
- Flood 1/10 Low FEMA zone X (unshaded) · 0% chance over 30 yrs
- Wildfire 4/10 Moderate
- Heat 4/10 Moderate 5 d/yr ≥88°F today · 13 d/yr by 30 yrs out
- Wind 1/10 Low
- Air quality 3/10 Moderate 3 unhealthy d/yr today · 3 by 30 yrs out
Nearby sold comps map
Loading sold comps map…
Walkable amenities ~0.75 mi
Loading nearby amenities…
Taxation est. · year 1
- Rental income
- $1,839,396
- − Mortgage interest
- −$739,405
- − Property taxes
- −$198,000
- − Insurance
- −$66,000
- − Repairs & maintenance
- −$147,152
- − Management
- −$147,152
- − Depreciation
- −$384,000
- Taxable income
- $157,687
- Est. tax owed @ 24.0%
- −$37,845
- After-tax cash flow
- $320,611/yr
For passive investors: Depreciation is non-cash, so a rental often shows a tax loss while cash-flowing — sheltering income. Rental losses are passive: they offset passive income freely, and up to $25,000/yr can offset ordinary (W-2) income if you actively participate and your MAGI is under $100k (phasing out to $0 by $150k); unused losses carry forward. On sale, claimed depreciation is recaptured at up to 25%, and gains may owe capital-gains tax (a 1031 exchange can defer both). Figures are a year-1 estimate at your 24.0% rate — not tax advice; consult a CPA.
Schools (NCES district)
- District
- Sweetwater Union High
- NCES district ID
- 0638640
- Math proficiency
- 36% ▲ 3.00%
- Reading proficiency
- 52% ▼ -2.00%
- Median HH income
- $59,051
- Composite
- 38.61/100
- National rank
- #4158
- State rank
- #187 of 517 in CA
Livability — San Diego
- Score
- 75/100
- State rank
- #123
- US rank
- #4206
Category grades
Schools grade is shown separately in the Schools card above.
Census & demographics
- Census place
- San Diego, CA
- County
- San Diego County · 3,178,799 people
- City population
- 1,397,612
- Metro
- San Diego-Chula Vista-Carlsbad, CA
- Population (ZIP)
- 27,585
- Household income
- $69,792
- Rent vs Own
- Severe rent burden
- 1542.0
Population outlook (San Diego County) Hauer SSP2
- Today (2025)
- 3,678,185 people
- By 2030
- 3,856,546 · +4.8%
- By 2040
- 4,171,407 · +13.4%
- By 2050
- 4,421,607 · +20.2%
- By 2075
- 4,831,599 · +31.4%
- By 2100
- 4,832,502 · +31.4%
Race, ethnicity, and origin ACS 2023
- Neighborhood character
- Predominantly Hispanic (93%)
- Race & ethnicity
- Hispanic / Latino 93% Two or more races 40% White 3% Asian 2% Black 1% Native American 1%
- Hispanic origin (detail)
- Mexican 91%
- Foreign-born
- 46% · Canada
- Languages at home
- 14% English-only · Spanish 84% Tagalog/Filipino 1% Other Asian/Pacific 0%
Political lean MEDSL · San Diego
- 2024 margin
- D (+16.8) · D 56.9% · R 40.1% · Other 2.9%
- 2008→2024 swing
- +6.6pp toward D · 2008: 10.2pp · 2024: 16.8pp
- All cycles
- 2024: D+16.8 2020: D+22.8 2016: D+17.8 2012: D+5.1 2008: D+10.2
Not yet ingested
- Civics
- —
Market trends
- HPI YoY
- ▼ -121.10%
- Current HPI
- 516.1421
- Rent YoY
- —
- Metro
- San Diego-Chula Vista-Carlsbad, CA
- State GDP YoY
- ▲ 3.21%
- F500 in state
- 116
Industry mix (Fortune 500 HQ in CA)
| Industry | F500 HQs | Revenue |
|---|---|---|
| Technology | 27 | $1,492B |
|
||
| Financial Services | 3 | $174B |
|
||
| Retail | 3 | $44B |
|
||
| Insurance | 3 | $26B |
|
||
| Media / Entertainment | 2 | $115B |
|
||
| Pharmaceuticals / Biotech | 2 | $62B |
|
||
Price history
1 event — show timeline
- 2025-12-15 Listed $13,200,000 SDMLS
Cash-flow waterfall
monthlySold comps — $/sqft
last 12 mo · ≤1 miLoading sold comps…