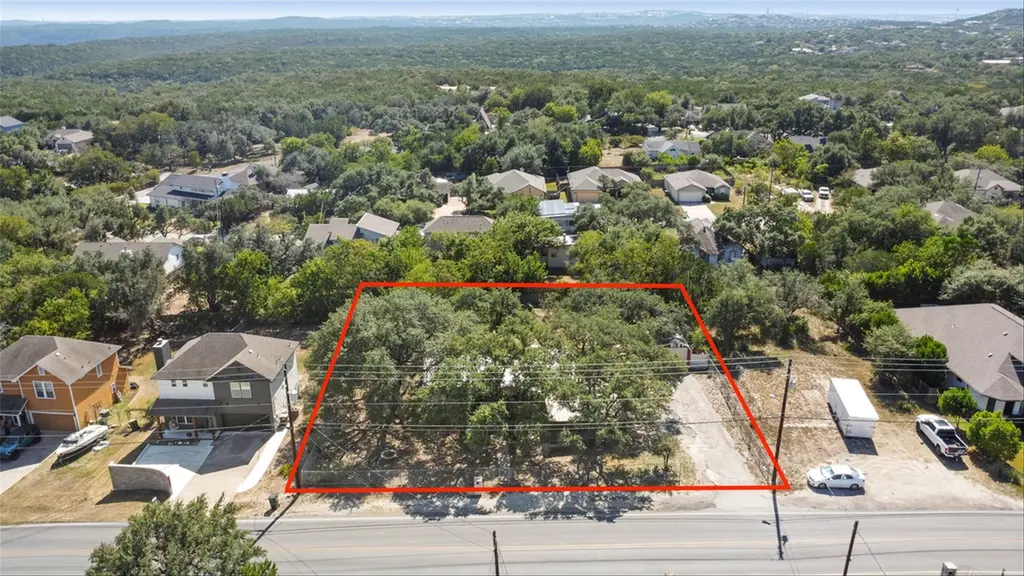
14705 Debba Dr · Lakeway, TX
Flood risk 1/10 · Minimal
- FEMA flood zone
- X (unshaded)
- Chance of flooding over 30 yrs
- 0.0%
- Est. flood insurance / yr
- $507 – $1,088
Fire risk 3/10 · Minor
- Est. fire insurance / yr
- $1,222 – $2,270
Heat risk 8/10 · Major
- Hot days now (above 108°F)
- 7 days/yr
- Hot days in 30 yrs
- 22 days/yr
Wind risk 6/10 · Moderate
- Chance of severe wind over 30 yrs
- 73.0%
Air-quality risk 2/10 · Minimal
- Unhealthy air days now
- 1 days/yr
- Unhealthy air days in 30 yrs
- 1 days/yr
Risk factors via First Street. Map © Google.
Why this score? — see what drove the D grade
The composite is a weighted blend of 9 inputs, each scored 0–100. Each bar is that input's sub-score; the figure is the points it added to the 100-point composite (weight × sub-score).
- ARV discount +15.0/15.0
- Cash flow +7.0/30.0
- Schools +5.5/10.0
- Rent growth +3.6/5.0
- Livability +3.6/5.0
- Condition / age +2.5/5.0
- 1% rule +2.0/10.0
- DSCR +1.2/10.0
- Appreciation +0.0/10.0
$379,999
🖨 Deal sheet 📄 Offer letter ✓ Due diligence
Listing remarks MLS
Welcome to 14705 Debba Drive, a rare double-lot property in the heart of Apache Shores. Set beneath a canopy of mature oak trees, this 3-bedroom home spans two combined parcels, offering exceptional flexibility for expansion, investment, or income-generating potential. The single-story layout features a welcoming front porch, a bright living area with vaulted ceilings, and warm wood flooring throughout the main spaces. The kitchen is anchored by a large picture window overlooking the backyard and flows seamlessly into the dining area. Each bedroom offers comfortable proportions with closet storage, while the full bath provides a functional layout ready to refresh or reimagine. Outdoors, the level lot creates ample opportunity for gardening, entertaining, or future projects, complete with a shaded patio and additional storage structures. Zoned to highly rated Lake Travis ISD and located within a low tax rate area, this property carries lasting value in one of Austin’s most desirable lake communities. Residents of Apache Shores enjoy private access to Lake Austin, one of the city’s most iconic recreational escapes, along with close proximity to Lakeway’s shopping, dining, and entertainment.
Key facts
- 0.43 acre lot
- 2 parking spots
- Built 1975
Neighborhood map
What this means for you Summary
Snapshot
- This is a 3-bed/1.0-bath single-family listed at $380k.
Deal economics
- At list price, monthly cash flow is $-563 ($-7k/yr) — negative.
- To cash-flow at today's rent, offer at most $281k (26.2% below list).
- To meet the 1% rule (rent ≥ 1% of price), the offer needs to be $265k (30.3% below list).
- Recommended offer: $265k (30.3% below list) — sets the bar for 1% rule.
- Cap rate 4.5% vs local median 1.7% in Lakeway — top-decile yield for the area; either an underpriced asset or a hidden risk that comps aren't pricing in. Stress-test before assuming the spread holds.
Location & tenants
- Location reads 71/100 on livability (#330 in TX) — a middle-class / working-renter tenant base. Strengths: crime A+, employment A+, housing A+; Watch: amenities F, commute F, cost of living F.
- Lake Travis ISD (rural): math 57% / reading 61% proficiency, ranked #39 of 826 in TX (top 5%) — acceptable for families but not a draw, mixed tenant base, ~2y average lease; only 15% free/reduced lunch — higher-income household profile.
- Market conditions: Rents rising fast (+4.5%/yr); 478 active listings in the ZIP; 11 comparable units currently listed for rent nearby; rentals at typical pace (median 24d on market — plan ~3-4 weeks tenant-placement turnaround); high-income renter base; 17,121 units permitted in Travis County in 2024 (11,963 in 5+ unit buildings).
Forward outlook
- Local home prices are declining (-3.0%/yr); year-one equity from $3k of loan paydown is wiped out by about $11k of value loss. Plan a longer hold.
- Travis County population projected at +60% by 2050 — long-run rental-demand tailwind backs the buy-and-hold thesis.
Negotiation context
- It's been on market 259 days — a 12% lower offer ($334k) is reasonable based on typical stale-listing flexibility.
- 4 sale attempts since 21y ago; this cycle's ask is 230% above the opening price — seller raised mid-cycle; expect resistance to lowballs.
- Current owner paid $143k; list at $380k implies a 165% gain — meaningful room to come down on a strong offer.
Risks & watch-outs
- Climate carrying-cost: major wind risk, 73% chance of damaging wind over 30y; extreme-heat days projected 7→22/yr by 2055 (HVAC capex compounding) — expect insurance premiums to compound above CPI over the hold.
Questions for the listing agent
- What do current leases actually rent for vs. the listed asking? Can we see a recent rent roll and the last 12 months of T-12 income?
- It's been on market 259 days. Have you received any prior offers? Is the seller open to a 30% concession, seller financing, or rate buy-down credit?
- Built in 1975 — when were the roof, HVAC, electrical panel, plumbing, and water heater last replaced?
- What does the HOA fee cover, when was the last increase, and are there any pending special assessments or reserve-fund shortfalls?
- Why hasn't it sold? Are there any deal-killer items the seller is aware of (foundation, flood, title, zoning, code violations)?
- Is there a deadline driving the sale (1031 exchange, divorce, estate, relocation)? That informs how much negotiation room exists.
- Schools are B-rated — typically a magnet for longer-tenancy family renters. What's the average tenant stay here, and is there a school-zone premium baked into asking?
- The area grade is low — what's the realistic commute time and amenity access for the typical tenant pool here? Any planned neighborhood developments (good or bad) we should know about?
- What's the average days-on-market for RENTAL listings here right now (not sales)? A rising rental-DOM trend means longer vacancies and softer asking-rent achievability than the comps imply.
- What's the recent tenant-quality profile in this submarket — average credit score on applications, eviction rate, late-payment / NSF rate, and stable-employment percentage? A property-management company in the area should have these aggregated.
- How much new for-sale + rental construction is in the pipeline within 1–3 miles? Heavy new supply typically softens prices + rents 12–24 months out; constrained supply supports both.
Investment metrics
- 1% rule
- 0.70% ✗
- Cap rate
- 4.51%
- Cash-on-cash
- -6.35%
- DSCR
- 0.72
- GRM
- 12.0
CMA / ARV
- ARV (median comp)
- $480,994
- List price
- $379,999
- Delta
- -21.00%
- Verdict
- UNDERPRICED
- Comps
- 20 within 1.0 mi
Show comp detail 7 sales within ~0.75 mi
| Address | Dist | Beds/Ba | Sqft | Sold | Price | $/sf | Match |
|---|---|---|---|---|---|---|---|
| 2108 Indian Creek Rd | 0.62mi | 3/2.0 | 1,320 (-0%) | 1mo | $425,000 | $322 | 66 |
| 2100 Rain Water Dr | 0.66mi | 3/2.0 | 1,343 (+2%) | 16mo | $434,000 | $323 | 49 |
| 2003 Rain Water Dr | 0.65mi | 3/2.0 | 1,475 (+12%) | 0mo | $459,000 | $311 | 46 |
| 15107 Cavalier Canyon Dr | 0.66mi | 3/2.0 | 1,422 (+8%) | 20mo | $400,000 | $281 | 36 |
| 15200 Cavalier Canyon Dr | 0.67mi | 2/2.0 (-1) | 1,245 (-6%) | 19mo | $317,000 | $255 | 34 |
| 2679 Crazyhorse Pass | 0.59mi | 3/2.0 | 1,490 (+13%) | 20mo | $439,000 | $295 | 31 |
| 15100 Sophie Dr | 0.55mi | 3/3.0 | 1,512 (+14%) | 23mo | $1,000,000 | $661 | 23 |
Match score weights: distance 35% · size 25% · config 20% · recency 20%. Top-matched comps best support the ARV.
Projected returns pro-forma
-3.0% appreciation · 4.54% rent growth · sell at horizon
- IRR
- -25.5%
- Equity multiple
- 0.12×
- Total profit
- $-93,217
- Equity at exit
- $56,659
- IRR
- -17.6%
- Equity multiple
- -0.03×
- Total profit
- $-109,467
- Equity at exit
- $32,855
Cash invested: $106,400 (down + closing). Projections, not guarantees.
Landlord ↔ Tenant lean methodology
- Overall (STATE)
- 87 Strongly Landlord-Friendly
- State Texas
- 87 Strongly Landlord-Friendly · R+5
- County
- — inherits STATE
- City
- — inherits STATE
ZIP-level market 78734
- Rents YoY
- 4.5%
- Active inventory
- 478
- Price-to-rent
- 12.0×
Monthly cashflow live
- Estimated rent
- $2,650 high interval (Pro) →
- Mortgage (P&I)
- −$1,993
- Tax from tax record
- −$499 /mo · $5,992/yr
- Insurance
- −$158
- HOA
- −$6
- Vacancy / Maint / Mgmt
- −$556
- Net cashflow
- $-563
Break-even live
UW: 25.0% down · 7.5% · 30yr · 1.5% tax · 5.0% vac · 8.0% maint · 8.0% mgmt
Financing live
Cash to close
- Down payment
- $95,000
- Closing costs
- $11,400
- Reserves months
- —
- Total cash needed
- —
Loan-product check · same deal, 3 products live
Conventional
25% down · 7.5% · 30yr
- Down + closing
- —
- Monthly P&I
- —
- Monthly cashflow
- —
- DSCR
- —
- Eligible?
- —
Personal DTI + credit; lowest rate.
DSCR
20% down · 8.5% · 30yr
- Down + closing
- —
- Monthly P&I
- —
- Monthly cashflow
- —
- DSCR
- —
- Eligible?
- —
No personal income docs; deal must DSCR.
Hard money
10% down · 12.0% · 12mo
- Down + closing
- —
- Monthly P&I
- —
- Monthly cashflow
- —
- DSCR
- —
- Eligible?
- —
Short-term bridge; refi at stabilization.
Rent comps 11 comps
| Address | Beds | Baths | Sqft | Rent | $/sqft | DOM | Units | Dist |
|---|---|---|---|---|---|---|---|---|
| 14803 Debba Dr Austin, TX | 3.0 | 2.5 | 1664 | $2,650 | $1.59 | 43d | 1 | 0.04mi |
| 14708 Foy Dr Austin, TX | 3.0 | 2.0 | 1163 | $2,095 | $1.80 | 43d | 1 | 0.09mi |
| 2012 Indian Creek Rd Austin, TX | 4.0 | 2.0 | 1788 | $3,250 | $1.82 | 43d | 1 | 0.54mi |
| 15302 Cavalier Canyon Dr Apt B Lakeway, TX | 2.0 | 2.0 | 1000 | $1,895 | $1.90 | 14d | 1 | 0.73mi |
| 2208 N FM 620 Austin, TX | 1.0–3.0 | 1.0–2.0 | 1197 | $2,700 | $2.25 | 1d | 9 | 1.10mi |
| 1104 Buffalo Gap Rd Austin, TX | 3.0 | 2.0 | 1329 | $3,500 | $2.63 | 10d | 1 | 1.16mi |
| 2709 Long Bow Trl Austin, TX | 2.0 | 2.0 | 1216 | $2,200 | $1.81 | 43d | 1 | 1.23mi |
| 15216 Kevin Ln Austin, TX | 3.0 | 2.0 | 1472 | $2,395 | $1.63 | 23d | 1 | 1.29mi |
| 3248 Brass Buttons Trl Austin, TX | 3.0 | 2.0 | 1238 | $2,200 | $1.78 | 23d | 1 | 1.35mi |
| 2918 Ranch Rd 620 N #265 Austin, TX | 2.0 | 2.0 | 1204 | $2,100 | $1.74 | 2d | 1 | 1.45mi |
| 2918 Ranch Rd 620 N Apt 272 Austin, TX | 2.0 | 2.5 | 1395 | $2,195 | $1.57 | 3d | 1 | 1.46mi |
HOA detail
- Monthly dues
- $6 · $72/yr
Listing history 25 events
-
2026-06-18days on market $379,999 Active 259 DOM
-
2026-06-17days on market $379,999 Active 258 DOM
-
2026-06-16days on market $379,999 Active 257 DOM
-
2026-06-15days on market $379,999 Active 256 DOM
-
2026-06-13days on market $379,999 Active 254 DOM
-
2026-06-09days on market $379,999 Active 250 DOM
-
2026-06-08days on market $379,999 Active 249 DOM
-
2026-06-07days on market $379,999 Active 248 DOM
-
2026-06-04days on market $379,999 Active 245 DOM
-
2026-06-03days on market $379,999 Active 244 DOM
-
2026-06-02days on market $379,999 Active 243 DOM
-
2026-06-01days on market $379,999 Active 242 DOM
-
2026-05-31days on market $379,999 Active 241 DOM
-
2026-02-23price $379,999 1225-char remark
Show marketing remark (1225 chars)
Welcome to 14705 Debba Drive, a rare double-lot property in the heart of Apache Shores. Set beneath a canopy of mature oak trees, this 3-bedroom home spans two combined parcels, offering exceptional flexibility for expansion, investment, or income-generating potential. The single-story layout features a welcoming front porch, a bright living area with vaulted ceilings, and warm wood flooring throughout the main spaces. The kitchen is anchored by a large picture window overlooking the backyard and flows seamlessly into the dining area. Each bedroom offers comfortable proportions with closet storage, while the full bath provides a functional layout ready to refresh or reimagine. Outdoors, the level lot creates ample opportunity for gardening, entertaining, or future projects, complete with a shaded patio and additional storage structures. Zoned to highly rated Lake Travis ISD and located within a low tax rate area, this property carries lasting value in one of Austin’s most desirable lake communities. Residents of Apache Shores enjoy private access to Lake Austin, one of the city’s most iconic recreational escapes, along with close proximity to Lakeway’s shopping, dining, and entertainment.
-
2025-07-15Active
-
2024-01-18Active
-
2023-11-16price
-
2023-11-03price
-
2023-09-11price
-
2023-05-17Active
-
2005-06-06soldstatus $143,490
-
2005-06-06soldstatus $143,490
-
2005-06-02soldstatus
-
2005-05-22historical
-
2005-03-01$115,000
ⓘ Source: listings_history table (triggers on properties + properties_extension) + one-shot
backfill from property_details.listing_events for pre-trigger history.
Tax reassessment forecast TX · Resets to sale price
- Current annual tax
- $5,992 · $499/mo
- Projected year-2 tax
- $6,954 · $579/mo
- Expected delta
- +$962/yr (+$80/mo · 16.1%)
ⓘ Screening estimate from a state-policy table — verify with the county assessor before closing.
Climate risk First Street
- Flood 1/10 Low FEMA zone X (unshaded) · 0% chance over 30 yrs
- Wildfire 3/10 Moderate
- Heat 8/10 Severe 7 d/yr ≥108°F today · 22 d/yr by 30 yrs out
- Wind 6/10 Major 73% chance of damaging wind over 30 yrs
- Air quality 2/10 Low 1 unhealthy d/yr today · 1 by 30 yrs out
Nearby sold comps map
Loading sold comps map…
Walkable amenities ~0.75 mi
Loading nearby amenities…
Taxation est. · year 1
- Rental income
- $31,796
- − Mortgage interest
- −$21,286
- − Property taxes
- −$5,992
- − Insurance
- −$1,900
- − Repairs & maintenance
- −$2,544
- − Management
- −$2,544
- − HOA
- −$72
- − Depreciation
- −$11,055
- Taxable loss
- −$13,595
- Est. tax savings @ 24.0%
- +$3,263
- After-tax cash flow
- $-3,495/yr
For passive investors: Depreciation is non-cash, so a rental often shows a tax loss while cash-flowing — sheltering income. Rental losses are passive: they offset passive income freely, and up to $25,000/yr can offset ordinary (W-2) income if you actively participate and your MAGI is under $100k (phasing out to $0 by $150k); unused losses carry forward. On sale, claimed depreciation is recaptured at up to 25%, and gains may owe capital-gains tax (a 1031 exchange can defer both). Figures are a year-1 estimate at your 24.0% rate — not tax advice; consult a CPA.
Schools (NCES district)
- District
- Lake Travis ISD
- NCES district ID
- 4826470
- Math proficiency
- 57% ▼ -12.00%
- Reading proficiency
- 61% ▼ -9.00%
- Median HH income
- $101,194
- Composite
- 55.13/100
- National rank
- #1283
- State rank
- #39 of 826 in TX
Livability — Lakeway
- Score
- 71/100
- State rank
- #330
- US rank
- #7227
Category grades
Schools grade is shown separately in the Schools card above.
Census & demographics
- County
- Travis County · 1,299,254 people
- City population
- 22,145
- Metro
- Austin-Round Rock-Georgetown, TX
- Population (ZIP)
- 22,145
- Household income
- $130,784
- Rent vs Own
- Severe rent burden
- 296.0
Population outlook (Travis County) Hauer SSP2
- Today (2025)
- 1,545,133 people
- By 2030
- 1,729,269 · +11.9%
- By 2040
- 2,097,596 · +35.8%
- By 2050
- 2,463,890 · +59.5%
- By 2075
- 3,249,374 · +110.3%
- By 2100
- 3,801,868 · +146.1%
Race, ethnicity, and origin ACS 2023
- Neighborhood character
- Predominantly White (76%)
- Race & ethnicity
- White 76% Hispanic / Latino 15% Two or more races 10% Asian 4% Black 1%
- Hispanic origin (detail)
- Mexican 13%
- Common ancestry
- Italian 6% Iranian 4% Slovak 3%
- Foreign-born
- 13% · Canada, China, Vietnam
- Languages at home
- 84% English-only · Spanish 10% Other Indo-European 2% Russian/Polish/Slavic 1%
Political lean MEDSL · Travis
- 2024 margin
- Solid D (+39.3) · D 68.8% · R 29.4% · Other 1.8%
- 2008→2024 swing
- +9.9pp toward D · 2008: 29.4pp · 2024: 39.3pp
- All cycles
- 2024: D+39.3 2020: D+45.0 2016: D+38.9 2012: D+23.9 2008: D+29.4
Not yet ingested
- Civics
- —
Market trends
- HPI YoY
- ▼ -227.08%
- Current HPI
- 216.0323
- Rent YoY
- ▲ 4.54%
- Metro
- Austin-Round Rock-Georgetown, TX
- State GDP YoY
- ▲ 3.95%
- F500 in state
- 110
Industry mix (Fortune 500 HQ in TX)
| Industry | F500 HQs | Revenue |
|---|---|---|
| Energy | 16 | $1,198B |
|
||
| Technology | 5 | $198B |
|
||
| Engineering / Construction | 4 | $72B |
|
||
| Energy Services | 3 | $60B |
|
||
| Utilities | 3 | $41B |
|
||
| Healthcare | 2 | $330B |
|
||
Price history
+230.4% since first listed12 events — show timeline
- 2026-02-23 Price Changed $379,999 Unlock MLS
- 2025-07-15 Listed — Unlock MLS
- 2024-01-18 Listed — Unlock MLS
- 2023-11-16 Price Changed — Unlock MLS
- 2023-11-03 Price Changed — Unlock MLS
- 2023-09-11 Price Changed — Unlock MLS
- 2023-05-17 Listed — Unlock MLS
- 2005-06-06 Sold (Public Records) $143,490 Public Records
- 2005-06-06 Sold (Public Records) $143,490 Public Records
- 2005-06-02 Sold (MLS) — Unlock MLS
- 2005-05-22 Delisted — Unlock MLS
- 2005-03-01 Listed $115,000 Unlock MLS
Property tax history
+5.2%/yrLatest (2026): $5,992 · +10.0% YoY. Source: county tax records.
Cash-flow waterfall
monthlySold comps — $/sqft
last 12 mo · ≤1 miLoading sold comps…