21711 Crest Peak Way · Houston, TX
Flood risk 7/10 · Major
- FEMA flood zone
- X (unshaded)
- Chance of flooding over 30 yrs
- 0.99%
- Est. flood insurance / yr
- $507 – $1,088
Fire risk 3/10 · Minor
- Est. fire insurance / yr
- $1,222 – $2,270
Heat risk 9/10 · Severe
- Hot days now (above 110°F)
- 7 days/yr
- Hot days in 30 yrs
- 23 days/yr
Wind risk 9/10 · Severe
- Chance of severe wind over 30 yrs
- 99.0%
Air-quality risk 2/10 · Minimal
- Unhealthy air days now
- 1 days/yr
- Unhealthy air days in 30 yrs
- 2 days/yr
Risk factors via First Street. Map © Google.
Why this score? — see what drove the D grade
The composite is a weighted blend of 9 inputs, each scored 0–100. Each bar is that input's sub-score; the figure is the points it added to the 100-point composite (weight × sub-score).
- ARV discount +11.2/15.0
- Cash flow +7.5/30.0
- Schools +5.7/10.0
- Appreciation +4.4/10.0
- Livability +3.7/5.0
- 1% rule +3.4/10.0
- Condition / age +2.5/5.0
- Rent growth +1.8/5.0
- DSCR +1.6/10.0
$283,000
🖨 Deal sheet (PDF) 📄 Offer letter ✓ Due diligence
Listing remarks
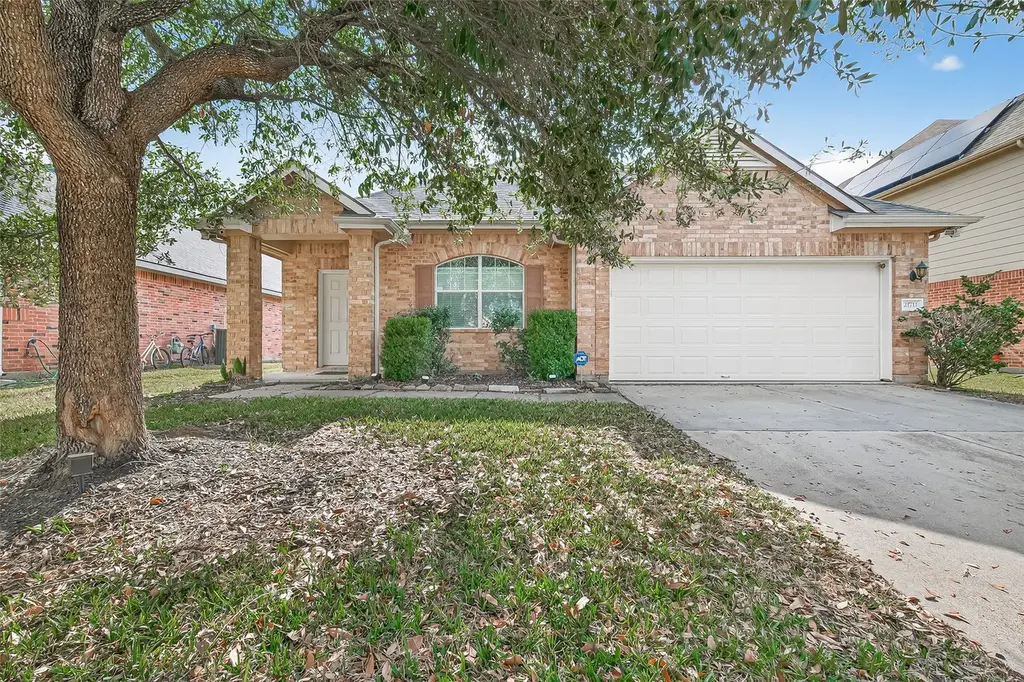
This charming one-story home features 3 bedrooms and 2 bathrooms, located in the quiet and friendly Mason Lake community. As you step inside, you’ll be welcomed by a bright and airy living area filled with natural light from large windows. The kitchen with elegant brown cabinetry creates a warm and harmonious space for everyday living. The spacious primary bedroom includes a convenient walk-in closet. The home features no carpet throughout, making it easy to maintain and keep clean. Conveniently located near SH 99 Grand Parkway and just 15 minutes from Katy Asian Town, this home is perfect for families seeking comfort, peace, and convenience. Don’t miss this opportunity—sc
Key facts
- Large windows
- Mason lake community
- Bright living area
Tags
Property features AI
Finance
- HOA & community: Mason Lakes community association; Annual association fee of $425
Exterior
- Parking: Attached garage (2 car)
- Utilities: Public water; Public sewer
- Home design: Residential property; Built in 2008; Slab foundation
- Construction: Brick construction; Composition roof
- Exterior features: Fenced backyard; Private yard; Located in a subdivision
Interior
- Kitchen: Gas oven; Gas range
- Flooring: Tile; Vinyl
- Bathrooms: 2 full bathrooms
- Heating & cooling: Central heating (Gas); Central electric air conditioning; Thermostat (programmable)
- Interior features: High ceilings; Pantry; Quartz counters; Separate shower; Ceiling fans; Programmable thermostat; 7 total rooms
- Laundry & utility: Washer hookup; Electric dryer hookup; Gas dryer hookup
Neighborhood map
What this means for you Summary
Snapshot
- This is a 3-bed/2.0-bath single-family listed at $283k.
Deal economics
- At list price, monthly cash flow is $-418 ($-5k/yr) — negative.
- To cash-flow at today's rent, offer at most $209k (26.1% below list).
- To meet the 1% rule (rent ≥ 1% of price), the offer needs to be $239k (15.6% below list).
- Recommended offer: $209k (26.1% below list) — sets the bar for cash-flow.
- Cap rate 4.8% vs local median 3.2% in Houston — top-decile yield for the area; either an underpriced asset or a hidden risk that comps aren't pricing in. Stress-test before assuming the spread holds.
Location & tenants
- Location reads 74/100 on livability (#184 in TX, #4,771 nationally) — a middle-class / working-renter tenant base. Strengths: amenities A+, cost of living A+, housing A+; Watch: crime F.
- Katy ISD (suburban): math 61% / reading 63% proficiency, ranked #29 of 826 in TX (top 4%) — acceptable for families but not a draw, mixed tenant base, ~2y average lease.
- Zoned schools: Loraine T Golbow El (math 37% / reading 39%, grade F, #1,709 of 4,322 statewide, top 40%, 959 students, 73% FRL); T H Mcdonald J H (math 42% / reading 49%, grade D+, #470 of 1,662 statewide, top 29%, 1,059 students, 74% FRL); Katy H S (math 62% / reading 74%, grade B, #150 of 1,632 statewide, top 10%, 3,330 students, 38% FRL) — zoned schools average 62% FRL vs 27% district-wide (34 pts higher); higher-poverty schools than district average — tighter screening recommended.
- Market conditions: Rents soft (-2.9%/yr); 763 active listings in the ZIP; 40 comparable units currently listed for rent nearby; rentals at typical pace (median 19d on market — plan ~3-4 weeks tenant-placement turnaround); solid renter incomes; 29,883 units permitted in Harris County in 2024 (8,621 in 5+ unit buildings).
- This rent runs 33% of the median local income ($88k/yr) — at the standard rent-burdened threshold; future hikes will face affordability resistance.
Forward outlook
- Local home prices are declining (-1.3%/yr); year-one equity from $2k of loan paydown is wiped out by about $4k of value loss. Plan a longer hold.
- Harris County population projected at +47% by 2050 — long-run rental-demand tailwind backs the buy-and-hold thesis.
Negotiation context
- It's been on market 16 days — a 2% lower offer ($279k) is reasonable based on typical stale-listing flexibility.
- 14 sale attempts since 18y ago with the ask held roughly flat each time — persistent listings suggest the price (not the market) is what's stuck; bring a comps-based counter.
Risks & watch-outs
- Watch-outs: property tax is 2.5% of price; flood insurance adds $66/mo.
- Climate carrying-cost: major flood risk; severe wind risk, 99% chance of damaging wind over 30y; extreme-heat days projected 7→23/yr by 2055 (HVAC capex compounding) — expect insurance premiums to compound above CPI over the hold.
Questions for the listing agent
- What do current leases actually rent for vs. the listed asking? Can we see a recent rent roll and the last 12 months of T-12 income?
- Property tax is high relative to price — has the assessment been appealed recently, and will the sale trigger a re-assessment?
- What's the actual annual flood-insurance premium (NFIP or private), and is the property in a SFHA with mandatory coverage?
- What does the HOA fee cover, when was the last increase, and are there any pending special assessments or reserve-fund shortfalls?
- Is there a deadline driving the sale (1031 exchange, divorce, estate, relocation)? That informs how much negotiation room exists.
- Schools are D-rated, which usually means shorter tenancies and higher turnover. Who's the typical renter profile here, and what's been the actual vacancy rate?
- Crime grade is F in this area — have there been break-ins, vandalism, or insurance claims at this property in the last 3 years? What carrier currently insures it and at what premium?
- The area grade is low — what's the realistic commute time and amenity access for the typical tenant pool here? Any planned neighborhood developments (good or bad) we should know about?
- What's the average days-on-market for RENTAL listings here right now (not sales)? A rising rental-DOM trend means longer vacancies and softer asking-rent achievability than the comps imply.
- What's the recent tenant-quality profile in this submarket — average credit score on applications, eviction rate, late-payment / NSF rate, and stable-employment percentage? A property-management company in the area should have these aggregated.
- How much new for-sale + rental construction is in the pipeline within 1–3 miles? Heavy new supply typically softens prices + rents 12–24 months out; constrained supply supports both.
Investment metrics
- 1% rule
- 0.84% ✗
- Cap rate
- 4.80%
- Cash-on-cash
- -5.32%
- DSCR
- 0.76
- GRM
- 9.9
CMA / ARV
- ARV (median comp)
- $308,422
- List price
- $283,000
- Delta
- -5.97%
- Verdict
- FAIR
- Comps
- 20 within 1.0 mi
Show comp detail 12 sales within ~0.75 mi
| Address | Dist | Beds/Ba | Sqft | Sold | Price | $/sf | Match |
|---|---|---|---|---|---|---|---|
| 21714 Crest Peak Way | 0.03mi | 3/2.0 | 2,080 (-10%) | 16mo | $299,900 | $144 | 68 |
| 21418 Vineyard Haven Ct | 0.34mi | 3/2.0 | 2,089 (-10%) | 1mo | $292,000 | $140 | 67 |
| 21610 Mid Peak Way | 0.13mi | 3/2.0 | 2,080 (-10%) | 13mo | $307,900 | $148 | 66 |
| 21419 Vineyard Haven Ct | 0.36mi | 4/2.5 (+1) | 2,445 (+6%) | 8mo | $345,000 | $141 | 60 |
| 4214 Barossa Valley Ln | 0.66mi | 4/2.5 (+1) | 2,354 (+2%) | 0mo | $278,000 | $118 | 60 |
| 4010 Mt Everest Way | 0.50mi | 3/2.0 | 2,128 (-8%) | 7mo | $259,900 | $122 | 57 |
| 21527 Bonita Vista Dr | 0.66mi | 4/2.0 (+1) | 2,322 (+0%) | 11mo | $290,000 | $125 | 55 |
| 4006 Mt Everest Way | 0.51mi | 3/2.5 | 2,100 (-9%) | 4mo | $295,000 | $140 | 55 |
| 4306 Tudor Ranch Ln | 0.32mi | 3/2.0 | 2,009 (-13%) | 13mo | $270,000 | $134 | 53 |
| 21414 Veneto Hills Ct | 0.33mi | 4/2.5 (+1) | 2,653 (+15%) | 2mo | $290,000 | $109 | 51 |
| 4342 N Vineyard Mdw Ln | 0.46mi | 4/2.5 (+1) | 2,655 (+15%) | 10mo | $320,000 | $121 | 39 |
| 21318 Pine Monte Ridge Ln | 0.56mi | 4/2.5 (+1) | 2,653 (+15%) | 14mo | $299,000 | $113 | 31 |
Match score weights: distance 35% · size 25% · config 20% · recency 20%. Top-matched comps best support the ARV.
Projected returns pro-forma
-1.27% appreciation · 0.0% rent growth · sell at horizon
- IRR
- -18.1%
- Equity multiple
- 0.27×
- Total profit
- $-58,105
- Equity at exit
- $64,652
- IRR
- -15.3%
- Equity multiple
- -0.15×
- Total profit
- $-91,344
- Equity at exit
- $64,818
Cash invested: $79,240 (down + closing). Projections, not guarantees.
Landlord ↔ Tenant lean methodology
- Overall (STATE)
- 87 Strongly Landlord-Friendly
- State Texas
- 87 Strongly Landlord-Friendly · R+5
- County
- — inherits STATE
- City
- — inherits STATE
ZIP-level market 77449
- Home prices YoY
- -0.5%
- Rents YoY
- -2.9%
- Active inventory
- 763
- Price-to-rent
- 9.9×
Monthly cashflow live
- Estimated rent
- $2,388 high interval (Pro) →
- Mortgage (P&I)
- −$1,484
- Tax from tax record
- −$601 /mo · $7,214/yr
- Insurance
- −$118
- Flood insurance flood zone
- −$66 /mo · $798/yr
- HOA
- −$35
- Vacancy / Maint / Mgmt
- −$502
- Net cashflow
- $-418
Break-even live
Sensitivity live
| Price | -10% $-258 | -5% $-338 | +0% $-418 | +5% $-498 | +10% $-578 |
|---|---|---|---|---|---|
| Rent | -10% $-606 | -5% $-512 | +0% $-418 | +5% $-323 | +10% $-229 |
| Rate | -1.0pp $-275 | -0.5pp $-346 | base $-418 | +0.5pp $-491 | +1.0pp $-566 |
UW: 25.0% down · 7.5% · 30yr · 1.5% tax · 5.0% vac · 8.0% maint · 8.0% mgmt
Financing live
Cash to close
- Down payment
- $70,750
- Closing costs
- $8,490
- Reserves months
- —
- Total cash needed
- —
Loan-product check · same deal, 3 products live
Conventional
25% down · 7.5% · 30yr
- Down + closing
- —
- Monthly P&I
- —
- Monthly cashflow
- —
- DSCR
- —
- Eligible?
- —
Personal DTI + credit; lowest rate.
DSCR
20% down · 8.5% · 30yr
- Down + closing
- —
- Monthly P&I
- —
- Monthly cashflow
- —
- DSCR
- —
- Eligible?
- —
No personal income docs; deal must DSCR.
Hard money
10% down · 12.0% · 12mo
- Down + closing
- —
- Monthly P&I
- —
- Monthly cashflow
- —
- DSCR
- —
- Eligible?
- —
Short-term bridge; refi at stabilization.
Rent comps 40 comps
| Address | Beds | Baths | Sqft | Rent | $/sqft | DOM | Units | Dist |
|---|---|---|---|---|---|---|---|---|
| 21527 N Boundary Peak Way Katy, TX | 4.0 | 3.0 | 2274 | $2,000 | $0.88 | 1d | 1 | 0.36mi |
| 3837 Banks Ridge Ln Katy, TX | 3.0 | 2.0 | 1658 | $2,350 | $1.42 | 45d | 1 | 0.69mi |
| 21919 Clay Rd Unit 3047 Katy, TX | 3.0 | 2.0 | 1608 | $2,235 | $1.39 | 13d | 1 | 0.75mi |
| 21919 Clay Rd Unit 21952 Katy, TX | 3.0 | 2.0 | 1608 | $2,184 | $1.36 | 1d | 1 | 0.75mi |
| 21106 Blackbluff Ct Katy, TX | 4.0 | 2.0 | 1865 | $1,950 | $1.05 | 7d | 1 | 0.79mi |
| 21919 Clay Rd Katy, TX | 3.0 | 2.5 | 1658 | $3,574 | $2.16 | 0d | 1 | 0.83mi |
| 21522 Violet Ridge Rd Katy, TX | 3.0 | 4.0 | 1597 | $2,200 | $1.38 | 45d | 1 | 1.11mi |
| 22611 Terrazzo Dr Katy, TX | 4.0 | 3.0 | 1865 | $2,569 | $1.38 | 45d | 1 | 1.13mi |
| 22613 Terrazzo Dr Katy, TX | 4.0 | 3.0 | 1873 | $2,569 | $1.37 | 45d | 1 | 1.13mi |
| 22615 Terrazzo Dr Katy, TX | 4.0 | 3.0 | 1865 | $2,569 | $1.38 | 45d | 1 | 1.14mi |
| 22628 Terrazzo Dr Katy, TX | 4.0 | 2.5 | 2017 | $2,659 | $1.32 | 17d | 1 | 1.16mi |
| 22614 Terrazzo Dr Katy, TX | 4.0 | 3.0 | 1873 | $2,539 | $1.36 | 14d | 1 | 1.16mi |
| 22616 Terrazzo Dr Katy, TX | 4.0 | 3.0 | 1865 | $2,539 | $1.36 | 17d | 1 | 1.17mi |
| 20811 Trenton Valley Ln Katy, TX | 4.0 | 3.0 | 2350 | $2,200 | $0.94 | 45d | 1 | 1.17mi |
| 22626 Terrazzo Dr Katy, TX | 4.0 | 2.5 | 2004 | $2,699 | $1.35 | 45d | 1 | 1.18mi |
| 22624 Terrazzo Dr Katy, TX | 4.0 | 3.0 | 1865 | $2,569 | $1.38 | 45d | 1 | 1.18mi |
| 22622 Terrazzo Dr Katy, TX | 4.0 | 3.0 | 1873 | $2,569 | $1.37 | 45d | 1 | 1.18mi |
| 22843 Castello Lakes Dr Katy, TX | 4.0 | 2.0 | 2036 | $2,148 | $1.06 | 24d | 1 | 1.18mi |
| 22713 Terrazzo Dr Katy, TX | 3.0 | 2.5 | 1667 | $2,419 | $1.45 | 14d | 1 | 1.19mi |
| 4110 Rapallo Ct Katy, TX | 4.0 | 3.0 | 2300 | $2,600 | $1.13 | 7d | 1 | 1.19mi |
| 22717 Terrazzo Dr Katy, TX | 4.0 | 2.5 | 2017 | $2,629 | $1.30 | 7d | 1 | 1.19mi |
| 22720 Terrazzo Dr Katy, TX | 4.0 | 2.5 | 2004 | $2,559 | $1.28 | 19d | 1 | 1.20mi |
| 22719 Terrazzo Dr Katy, TX | 4.0 | 2.5 | 2004 | $2,559 | $1.28 | 19d | 1 | 1.20mi |
| 22718 Terrazzo Dr Katy, TX | 4.0 | 3.0 | 1873 | $2,439 | $1.30 | 7d | 1 | 1.20mi |
| 22716 Terrazzo Dr Katy, TX | 4.0 | 3.0 | 1865 | $2,439 | $1.31 | 7d | 1 | 1.21mi |
| 22722 Terrazzo Dr Katy, TX | 4.0 | 2.5 | 2017 | $2,559 | $1.27 | 18d | 1 | 1.21mi |
| 4411 Andorno Dr Katy, TX | 4.0 | 2.0 | 2094 | $2,221 | $1.06 | 26d | 1 | 1.21mi |
| 22728 Terrazzo Dr Katy, TX | 3.0 | 2.5 | 1667 | $2,369 | $1.42 | 26d | 1 | 1.22mi |
| 3507 Banks Run Ln Katy, TX | 3.0 | 2.0 | 1951 | $1,806 | $0.93 | 7d | 1 | 1.23mi |
| 22737 Terrazzo Dr Katy, TX | 4.0 | 3.0 | 1873 | $2,649 | $1.41 | 45d | 1 | 1.23mi |
| 22738 Terrazzo Dr Katy, TX | 4.0 | 3.0 | 1873 | $2,539 | $1.36 | 21d | 1 | 1.23mi |
| 20911 Hazy Bluff Ct Katy, TX | 4.0 | 3.0 | 2940 | $2,450 | $0.83 | 45d | 1 | 1.29mi |
| 22808 Terrazzo Dr Katy, TX | 4.0 | 2.5 | 2004 | $2,499 | $1.25 | 1d | 1 | 1.29mi |
| 4535 Medrano Trl Katy, TX | 4.0 | 3.0 | 2657 | $2,600 | $0.98 | 45d | 1 | 1.32mi |
| 22851 Terazzo Dr Katy, TX | 3.0–4.0 | 2.5–3.0 | 1740 | $2,239 | $1.29 | 0d | 1 | 1.33mi |
| 22824 Frassino Pl Katy, TX | 4.0 | 2.5 | 2017 | $2,629 | $1.30 | 3d | 1 | 1.34mi |
| 22855 Terrazzo Dr Katy, TX | 3.0 | 2.5 | 1667 | $2,399 | $1.44 | 14d | 1 | 1.35mi |
| 4211 Fair Country Ln Katy, TX | 4.0 | 3.0 | 2342 | $2,275 | $0.97 | 26d | 1 | 1.37mi |
| 22865 Terrazzo Dr Katy, TX | 4.0 | 2.5 | 2017 | $2,759 | $1.37 | 17d | 1 | 1.38mi |
| 21643 Bay Palms Dr Katy, TX | 4.0 | 2.5 | 2438 | $2,200 | $0.90 | 14d | 1 | 1.41mi |
HOA detail
- Monthly dues
- $35 · $420/yr
Listing history 50 events
-
2026-06-21days on market $283,000 Active 16 DOM
-
2026-06-18days on market $283,000 Active 13 DOM
-
2026-06-17days on market $283,000 Active 12 DOM
-
2026-06-16days on market $283,000 Active 11 DOM
-
2026-06-15days on market $283,000 Active 10 DOM
-
2026-06-13days on market $283,000 Active 8 DOM
-
2026-06-09days on market $283,000 Active 4 DOM
-
2026-06-08days on market $283,000 Active 3 DOM
-
2026-06-07pricedays on market $283,000 Active 2 DOM
-
2026-06-04days on market $290,000 Active 72 DOM
-
2026-06-03days on market $290,000 Active 71 DOM
-
2026-06-02days on market $290,000 Active 70 DOM
-
2026-06-01days on market $290,000 Active 69 DOM
-
2026-05-31days on market $290,000 Active 68 DOM
-
2026-04-22$2,000
-
2026-03-24historical
-
2026-03-24$290,000 Active 722-char remark
-
2026-02-11price $289,990
-
2026-01-07$299,999 Active
-
2025-02-27historical $2,050
-
2025-01-10price $2,050
-
2024-11-23$2,100
-
2023-11-03historical $2,095
-
2023-10-24$2,095
-
2023-10-23soldstatus
-
2023-10-20soldstatus Sold
-
2023-09-05status Pending
-
2023-08-30status Option Pending
-
2023-08-27price $290,000
-
2023-08-19price $296,800
-
2023-08-17status Active
-
2023-08-11status Option Pending
-
2023-07-26$299,999 Active
-
2023-07-26historical
-
2023-07-19price $305,000
-
2023-07-13price $310,000
-
2023-06-22price $320,000
-
2023-06-15$325,000 Active
-
2023-06-15historical
-
2023-06-09price $325,000
-
2023-05-23price $330,000
-
2023-05-18status Active
-
2023-03-25historical
-
2023-03-22price $340,000
-
2023-03-09$350,000 Active
-
2015-04-07soldstatus
-
2015-04-02soldstatus Sold
-
2015-02-28status Pending
-
2015-02-23status Option Pending
-
2015-02-08status Active
ⓘ Source: listings_history table (triggers on properties + properties_extension) + one-shot
backfill from property_details.listing_events for pre-trigger history.
Tax reassessment forecast TX · Resets to sale price
- Current annual tax
- $7,214 · $601/mo
- Projected year-2 tax
- $7,214 · $601/mo
- Expected delta
- $0/yr ($0/mo · 0.0%)
ⓘ Screening estimate from a state-policy table — verify with the county assessor before closing.
Climate risk First Street
- Flood 7/10 Severe FEMA zone X (unshaded) · 99% chance over 30 yrs
- Wildfire 3/10 Moderate
- Heat 9/10 Extreme 7 d/yr ≥110°F today · 23 d/yr by 30 yrs out
- Wind 9/10 Extreme 99% chance of damaging wind over 30 yrs
- Air quality 2/10 Low 1 unhealthy d/yr today · 2 by 30 yrs out
Nearby sold comps map
Loading sold comps map…
Walkable amenities ~0.75 mi
Loading nearby amenities…
Taxation est. · year 1
- Rental income
- $28,662
- − Mortgage interest
- −$15,852
- − Property taxes
- −$7,214
- − Insurance
- −$2,212
- − Repairs & maintenance
- −$2,293
- − Management
- −$2,293
- − HOA
- −$420
- − Depreciation
- −$8,233
- Taxable loss
- −$9,856
- Est. tax savings @ 24.0%
- +$2,365
- After-tax cash flow
- $-2,648/yr
For passive investors: Depreciation is non-cash, so a rental often shows a tax loss while cash-flowing — sheltering income. Rental losses are passive: they offset passive income freely, and up to $25,000/yr can offset ordinary (W-2) income if you actively participate and your MAGI is under $100k (phasing out to $0 by $150k); unused losses carry forward. On sale, claimed depreciation is recaptured at up to 25%, and gains may owe capital-gains tax (a 1031 exchange can defer both). Figures are a year-1 estimate at your 24.0% rate — not tax advice; consult a CPA.
Schools (NCES district)
- District
- Katy ISD
- NCES district ID
- 4825170
- Math proficiency
- 61% ▼ -7.00%
- Reading proficiency
- 63% ▼ -3.00%
- Median HH income
- $90,312
- Composite
- 56.59/100
- National rank
- #1146
- State rank
- #29 of 826 in TX
Livability — Houston
- Score
- 74/100
- State rank
- #184
- US rank
- #4771
Category grades
Schools grade is shown separately in the Schools card above.
Census & demographics
- County
- Harris County · 4,702,590 people
- City population
- 3,226,434
- Metro
- Houston-The Woodlands-Sugar Land, TX
- Population (ZIP)
- 130,028
- Household income
- $87,808
- Rent vs Own
- Severe rent burden
- 3088.0
Population outlook (Harris County) Hauer SSP2
- Today (2025)
- 5,571,493 people
- By 2030
- 6,089,821 · +9.3%
- By 2040
- 7,142,806 · +28.2%
- By 2050
- 8,185,864 · +46.9%
- By 2075
- 10,574,329 · +89.8%
- By 2100
- 12,109,958 · +117.4%
Race, ethnicity, and origin ACS 2023
- Neighborhood character
- Diverse neighborhood (Simpson 0.68)
- Race & ethnicity
- Hispanic / Latino 49% Two or more races 22% Black 20% White 19% Asian 6%
- Hispanic origin (detail)
- Mexican 26% Puerto Rican 1% Cuban 4%
- Common ancestry
- Lithuanian 1% Italian 1%
- Foreign-born
- 32% · Canada, Jamaica, Vietnam
- Languages at home
- 48% English-only · Spanish 40% Other Indo-European 3% Vietnamese 1%
Political lean MEDSL · Harris
- 2024 margin
- Lean D (+5.5) · D 52.0% · R 46.4% · Other 1.6%
- 2008→2024 swing
- +3.9pp toward D · 2008: 1.6pp · 2024: 5.5pp
- All cycles
- 2024: D+5.5 2020: D+13.3 2016: D+12.4 2012: D+0.1 2008: D+1.6
Not yet ingested
- Civics
- —
Market trends
- HPI YoY
- ▼ -1.27%
- Current HPI
- 254.6622
- Rent YoY
- ▼ -2.86%
- Metro
- Houston-The Woodlands-Sugar Land, TX
- State GDP YoY
- ▲ 3.95%
- F500 in state
- 110
Industry mix (Fortune 500 HQ in TX)
| Industry | F500 HQs | Revenue |
|---|---|---|
| Energy | 16 | $1,198B |
|
||
| Technology | 5 | $198B |
|
||
| Engineering / Construction | 4 | $72B |
|
||
| Energy Services | 3 | $60B |
|
||
| Utilities | 3 | $41B |
|
||
| Healthcare | 2 | $330B |
|
||
Price history
-98.8% since first listed45 events — show timeline
- 2026-06-16 Rental Removed $1,900 HARMLS
- 2026-06-06 Price Changed $1,900 HARMLS
- 2026-06-05 Listed $283,000 HARMLS
- 2026-06-05 Listing Removed — HARMLS
- 2026-04-22 Listed for Rent $2,000 HARMLS
- 2026-03-24 Listing Removed — HARMLS
- 2026-03-24 Listed $290,000 HARMLS
- 2026-02-11 Price Changed $289,990 HARMLS
- 2026-01-07 Listed $299,999 HARMLS
- 2025-02-27 Rental Removed $2,050 HARMLS
- 2025-01-10 Price Changed $2,050 HARMLS
- 2024-11-23 Listed for Rent $2,100 HARMLS
- 2023-11-03 Rental Removed $2,095 HARMLS
- 2023-10-24 Listed for Rent $2,095 HARMLS
- 2023-10-23 Sold (Public Records) — Public Records
- 2023-10-20 Sold (MLS) — HARMLS
- 2023-09-05 Pending — HARMLS
- 2023-08-30 Pending — HARMLS
- 2023-08-27 Price Changed $290,000 HARMLS
- 2023-08-19 Price Changed $296,800 HARMLS
- 2023-08-17 Relisted — HARMLS
- 2023-08-11 Pending — HARMLS
- 2023-07-26 Listing Removed — HARMLS
- 2023-07-26 Listed $299,999 HARMLS
- 2023-07-19 Price Changed $305,000 HARMLS
- 2023-07-13 Price Changed $310,000 HARMLS
- 2023-06-22 Price Changed $320,000 HARMLS
- 2023-06-15 Listing Removed — HARMLS
- 2023-06-15 Listed $325,000 HARMLS
- 2023-06-09 Price Changed $325,000 HARMLS
- 2023-05-23 Price Changed $330,000 HARMLS
- 2023-05-18 Relisted — HARMLS
- 2023-03-25 Listing Removed — HARMLS
- 2023-03-22 Price Changed $340,000 HARMLS
- 2023-03-09 Listed $350,000 HARMLS
- 2015-04-07 Sold (Public Records) — Public Records
- 2015-04-02 Sold (MLS) — HARMLS
- 2015-02-28 Pending — HARMLS
- 2015-02-23 Pending — HARMLS
- 2015-02-08 Relisted — HARMLS
- 2015-02-05 Pending — HARMLS
- 2015-01-23 Listed $200,000 HARMLS
- 2009-03-30 Sold (MLS) — HARMLS
- 2009-02-23 Listing Removed — HARMLS
- 2008-12-11 Listed $162,100 HARMLS
Property tax history
+4.3%/yrLatest (2025): $7,214 · +1.9% YoY. Source: county tax records.
Cash-flow waterfall
monthlySold comps — $/sqft
last 12 mo · ≤1 miLoading sold comps…