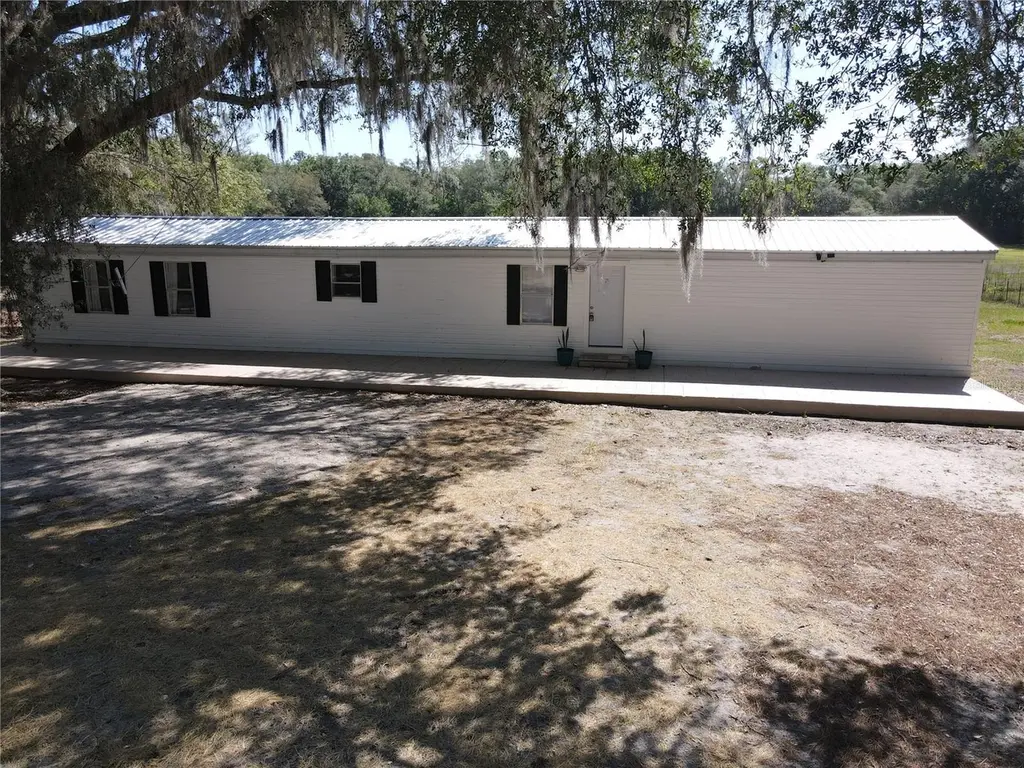
8771 NE 107th Ct · East Bronson, FL
Flood risk 9/10 · Severe
- FEMA flood zone
- X (unshaded)
- Chance of flooding over 30 yrs
- 0.99%
- Est. flood insurance / yr
- $507 – $1,088
Fire risk 6/10 · Moderate
- Est. fire insurance / yr
- $947 – $1,759
Heat risk 8/10 · Major
- Hot days now (above 107°F)
- 7 days/yr
- Hot days in 30 yrs
- 21 days/yr
Wind risk 9/10 · Severe
- Chance of severe wind over 30 yrs
- 99.0%
Air-quality risk 2/10 · Minimal
- Unhealthy air days now
- 2 days/yr
- Unhealthy air days in 30 yrs
- 2 days/yr
Risk factors via First Street. Map © Google.
Why this score? — see what drove the B- grade
The composite is a weighted blend of 9 inputs, each scored 0–100. Each bar is that input's sub-score; the figure is the points it added to the 100-point composite (weight × sub-score).
- Cash flow +25.7/30.0
- DSCR +8.6/10.0
- ARV discount +7.0/15.0
- Appreciation +6.2/10.0
- 1% rule +5.9/10.0
- Schools +3.6/10.0
- Livability +3.1/5.0
- Rent growth +2.5/5.0
- Condition / age +2.5/5.0
$150,000
🖨 Deal sheet 📄 Offer letter ✓ Due diligence
Listing remarks
Set on 1.25 beautiful acres in a peaceful country setting, this inviting 3-bedroom, 2-bath home offers the perfect blend of comfort and functionality. Inside, you’ll find luxury vinyl plank flooring, textured walls, ample storage, a versatile flex room, and a thoughtfully updated kitchen featuring beautiful concrete countertops and newer appliances. Important improvements, including a 2020 roof, 2020 HVAC, and 2023 hot water heater, add lasting value and peace of mind. Step outside to enjoy the serene surroundings from the massive concrete front porch or the lovely back deck overlooking the property. Fencing across the front with a lockable gate provides privacy and controlled access,
Key facts
- Concrete countertop
- Newer appliances
- 2020 roof
Tags
Property features AI
Finance
- Other: Furnished; Homestead exempt; One well and one septic on property
- HOA & community: No HOA; Located in the University Estates development
Exterior
- Utilities: Well water; Septic tank; Electricity connected; Broadband/high‑speed internet available
- Home design: Manufactured home (single wide); One story; Faces west; Great room
- Construction: Metal frame construction; Vinyl siding; Metal roof; Pillar/post/pier foundation; Built on one level
- Exterior features: Dirt road access; 1.25-acre lot
Interior
- Kitchen: Cooktop; Dishwasher; Microwave; Refrigerator; Stone counters; Solid wood cabinets
- Bedrooms: 3 bedrooms
- Bathrooms: 2 full bathrooms
- Heating & cooling: Central heating; Central air conditioning
- Interior features: Ceiling fans; High ceilings; Open floorplan with living room/dining room combo; Solid wood cabinets; Stone countertops; Thermostat; Vaulted ceilings
- Laundry & utility: Inside laundry; Washer; Dryer; Electric water heater
Neighborhood map
What this means for you Summary
Snapshot
- This is a 3-bed/2.0-bath manufactured listed at $150k.
Deal economics
- At list price, monthly cash flow is $293 ($4k/yr) — positive.
- The deal already cash-flows at list — no discount required.
- Meets the 1% rule at list price ($2k rent vs $150k).
- Recommended offer: $141k (6.0% below list) — sets the bar for market timing.
- Cap rate 9.2% vs local median 3.4% in East Bronson — top-decile yield for the area; either an underpriced asset or a hidden risk that comps aren't pricing in. Stress-test before assuming the spread holds.
Location & tenants
- Location reads 62/100 on livability (#768 in FL) — a middle-class / working-renter tenant base. Strengths: crime A+, cost of living A+, housing A+; Watch: health & safety D, amenities F, commute F.
- Levy (rural): math 45% / reading 43% proficiency, ranked #54 of 73 in FL (top 74%) — families likely to look elsewhere, expect single-tenant / working-renter base with shorter leases; 62% free/reduced lunch — lower-income household profile, screen leases tightly.
- Zoned schools: Williston Elementary School (math 53% / reading 52%, grade C-, #976 of 2,144 statewide, top 46%, 488 students, 71% FRL); Bronson Middle/High School (math 49% / reading 36%, grade F, #264 of 667 statewide, top 41%, 552 students, 62% FRL) — zoned schools at 67% FRL track the district average.
- Market conditions: 153 active listings in the ZIP; 199 units permitted in Levy County in 2024 (0 in 5+ unit buildings).
Forward outlook
- In year one you build about $5k of equity ($1k loan paydown + $4k appreciation (2.4% local appreciation)).
- Levy County population projected at -28% by 2050 — secular population decline; favor cash flow + early exit over multi-decade hold.
- At projected returns (2.4% appreciation + 3.0% rent growth), your $42k cash investment doubles in ~5 years — after that, you're playing with house money.
- By year 8, paydown + projected appreciation supports a ~$34k cash-out refi (75% LTV) — recoverable capital for the next deal without selling this one.
Negotiation context
- It's been on market 64 days — a 6% lower offer ($141k) is reasonable based on typical stale-listing flexibility.
Risks & watch-outs
- Watch-outs: flood insurance adds $66/mo.
- Climate carrying-cost: severe flood risk; severe wind risk, 99% chance of damaging wind over 30y; major wildfire risk; extreme-heat days projected 7→21/yr by 2055 (HVAC capex compounding) — expect insurance premiums to compound above CPI over the hold.
Questions for the listing agent
- It's been on market 64 days. Have you received any prior offers? Is the seller open to a 6% concession, seller financing, or rate buy-down credit?
- What's the actual annual flood-insurance premium (NFIP or private), and is the property in a SFHA with mandatory coverage?
- Why hasn't it sold? Are there any deal-killer items the seller is aware of (foundation, flood, title, zoning, code violations)?
- Is there a deadline driving the sale (1031 exchange, divorce, estate, relocation)? That informs how much negotiation room exists.
- Schools are F-rated, which usually means shorter tenancies and higher turnover. Who's the typical renter profile here, and what's been the actual vacancy rate?
- What's the average days-on-market for RENTAL listings here right now (not sales)? A rising rental-DOM trend means longer vacancies and softer asking-rent achievability than the comps imply.
- What's the recent tenant-quality profile in this submarket — average credit score on applications, eviction rate, late-payment / NSF rate, and stable-employment percentage? A property-management company in the area should have these aggregated.
- How much new for-sale + rental construction is in the pipeline within 1–3 miles? Heavy new supply typically softens prices + rents 12–24 months out; constrained supply supports both.
Investment metrics
- 1% rule
- 1.09% ✓
- Cap rate
- 9.17%
- Cash-on-cash
- 10.27%
- DSCR
- 1.46
- GRM
- 7.6
CMA / ARV
- ARV (on-the-fly)
- $148,200
- Comps found
- 3
Show comp detail 3 sales within ~0.75 mi
| Address | Dist | Beds/Ba | Sqft | Sold | Price | $/sf | Match |
|---|---|---|---|---|---|---|---|
| 9071 NE 105th Ave | 0.40mi | 3/2.0 | 1,248 (+10%) | 8mo | $162,000 | $130 | 59 |
| 8410 NE 102nd Ct | 0.67mi | 3/2.0 | 1,188 (+4%) | 8mo | $201,000 | $169 | 55 |
| 10430 NE 92nd Pl | 0.60mi | 2/2.0 (-1) | 1,242 (+9%) | 7mo | $125,000 | $101 | 47 |
Match score weights: distance 35% · size 25% · config 20% · recency 20%. Top-matched comps best support the ARV.
Projected returns pro-forma
2.35% appreciation · 3.0% rent growth · sell at horizon
- IRR
- 13.7%
- Equity multiple
- 1.75×
- Total profit
- $31,625
- Equity at exit
- $62,005
- IRR
- 16.0%
- Equity multiple
- 3.21×
- Total profit
- $92,988
- Equity at exit
- $91,525
Cash invested: $42,000 (down + closing). Projections, not guarantees.
Landlord ↔ Tenant lean methodology
- Overall (STATE)
- 87 Strongly Landlord-Friendly
- State Florida
- 87 Strongly Landlord-Friendly · R+3
- County
- — inherits STATE
- City
- — inherits STATE
ZIP-level market 32621
- Home prices YoY
- 0.7%
- Active inventory
- 153
- Price-to-rent
- 7.6×
Monthly cashflow live
- Estimated rent
- $1,642 medium interval (Pro) →
- Mortgage (P&I)
- −$787
- Tax from tax record
- −$88 /mo · $1,058/yr
- Insurance
- −$62
- Flood insurance flood zone
- −$66 /mo · $798/yr
- HOA
- −$0
- Vacancy / Maint / Mgmt
- −$345
- Net cashflow
- $293
Break-even live
UW: 25.0% down · 7.5% · 30yr · 1.5% tax · 5.0% vac · 8.0% maint · 8.0% mgmt
Financing live
Cash to close
- Down payment
- $37,500
- Closing costs
- $4,500
- Reserves months
- —
- Total cash needed
- —
Loan-product check · same deal, 3 products live
Conventional
25% down · 7.5% · 30yr
- Down + closing
- —
- Monthly P&I
- —
- Monthly cashflow
- —
- DSCR
- —
- Eligible?
- —
Personal DTI + credit; lowest rate.
DSCR
20% down · 8.5% · 30yr
- Down + closing
- —
- Monthly P&I
- —
- Monthly cashflow
- —
- DSCR
- —
- Eligible?
- —
No personal income docs; deal must DSCR.
Hard money
10% down · 12.0% · 12mo
- Down + closing
- —
- Monthly P&I
- —
- Monthly cashflow
- —
- DSCR
- —
- Eligible?
- —
Short-term bridge; refi at stabilization.
Listing history 18 events
-
2026-06-18days on market $150,000 Active 64 DOM
-
2026-06-17days on market $150,000 Active 63 DOM
-
2026-06-16days on market $150,000 Active 62 DOM
-
2026-06-15days on market $150,000 Active 61 DOM
-
2026-06-14days on market $150,000 Active 59 DOM
-
2026-06-13days on market $150,000 Active 58 DOM
-
2026-06-10days on market $150,000 Active 56 DOM
-
2026-06-09days on market $150,000 Active 55 DOM
-
2026-06-08days on market $150,000 Active 54 DOM
-
2026-06-07days on market $150,000 Active 53 DOM
-
2026-06-05days on market $150,000 Active 50 DOM
-
2026-06-03days on market $150,000 Active 49 DOM
-
2026-06-02days on market $150,000 Active 48 DOM
-
2026-06-01days on market $150,000 Active 47 DOM
-
2026-05-31days on market $150,000 Active 46 DOM
-
2026-05-30days on market $150,000 Active 45 DOM
-
2026-05-11price $150,000
-
2026-04-15$154,900 Active
ⓘ Source: listings_history table (triggers on properties + properties_extension) + one-shot
backfill from property_details.listing_events for pre-trigger history.
Tax reassessment forecast FL · Resets to sale price
- Current annual tax
- $1,058 · $88/mo
- Projected year-2 tax
- $1,245 · $104/mo
- Expected delta
- +$187/yr (+$16/mo · 17.6%)
ⓘ Screening estimate from a state-policy table — verify with the county assessor before closing.
Climate risk First Street
- Flood 9/10 Extreme FEMA zone X (unshaded) · 99% chance over 30 yrs
- Wildfire 6/10 Major
- Heat 8/10 Severe 7 d/yr ≥107°F today · 21 d/yr by 30 yrs out
- Wind 9/10 Extreme 99% chance of damaging wind over 30 yrs
- Air quality 2/10 Low 2 unhealthy d/yr today · 2 by 30 yrs out
Nearby sold comps map
Loading sold comps map…
Walkable amenities ~0.75 mi
Loading nearby amenities…
Taxation est. · year 1
- Rental income
- $19,699
- − Mortgage interest
- −$8,402
- − Property taxes
- −$1,058
- − Insurance
- −$1,547
- − Repairs & maintenance
- −$1,576
- − Management
- −$1,576
- − Depreciation
- −$4,364
- Taxable income
- $1,175
- Est. tax owed @ 24.0%
- −$282
- After-tax cash flow
- $3,235/yr
For passive investors: Depreciation is non-cash, so a rental often shows a tax loss while cash-flowing — sheltering income. Rental losses are passive: they offset passive income freely, and up to $25,000/yr can offset ordinary (W-2) income if you actively participate and your MAGI is under $100k (phasing out to $0 by $150k); unused losses carry forward. On sale, claimed depreciation is recaptured at up to 25%, and gains may owe capital-gains tax (a 1031 exchange can defer both). Figures are a year-1 estimate at your 24.0% rate — not tax advice; consult a CPA.
Schools (NCES district)
- District
- Levy
- NCES district ID
- 1201140
- Math proficiency
- 45% ▼ -8.00%
- Reading proficiency
- 43% ▼ -3.00%
- Median HH income
- $35,254
- Composite
- 36.42/100
- National rank
- #4673
- State rank
- #54 of 73 in FL
Livability — East Bronson
- Score
- 62/100
- State rank
- #768
- US rank
- #17230
Category grades
Schools grade is shown separately in the Schools card above.
Census & demographics
- Census place
- East Bronson, FL
- Population (ZIP)
- 5,540
Population outlook (Levy County) Hauer SSP2
- Today (2025)
- 36,536 people
- By 2030
- 34,498 · -5.6%
- By 2040
- 30,294 · -17.1%
- By 2050
- 26,368 · -27.8%
- By 2075
- 19,003 · -48.0%
- By 2100
- 13,169 · -64.0%
Race, ethnicity, and origin ACS 2023
- Neighborhood character
- Predominantly White (68%)
- Race & ethnicity
- White 68% Hispanic / Latino 14% Black 9% Two or more races 9% Asian 3%
- Hispanic origin (detail)
- Mexican 4% Puerto Rican 6% Cuban 1%
- Common ancestry
- Romanian 2% Lithuanian 2% Serbian 1%
- Foreign-born
- 4% · Canada, Jamaica
- Languages at home
- 91% English-only · Spanish 8%
Political lean MEDSL · Levy
- 2024 margin
- Solid R (+50.3) · D 24.6% · R 74.8%
- 2008→2024 swing
- -23.3pp toward R · 2008: -26.9pp · 2024: -50.3pp
- All cycles
- 2024: R+50.3 2020: R+45.6 2016: R+44.8 2012: R+32.2 2008: R+26.9
Not yet ingested
- Civics
- —
Market trends
- HPI YoY
- ▲ 2.35%
- Current HPI
- 340.879
- Rent YoY
- —
- Metro
- —
- State GDP YoY
- ▲ 3.28%
- F500 in state
- 36
Industry mix (Fortune 500 HQ in FL)
| Industry | F500 HQs | Revenue |
|---|---|---|
| Industrial Technology | 2 | $29B |
|
||
| Insurance | 2 | $17B |
|
||
| Retail | 1 | $60B |
|
||
| Technology Distribution | 1 | $58B |
|
||
| Homebuilding | 1 | $35B |
|
||
| Technology Manufacturing | 1 | $35B |
|
||
Price history
-3.2% since first listed2 events — show timeline
- 2026-05-11 Price Changed $150,000 Stellar MLS as Distributed by MLS Grid
- 2026-04-15 Listed $154,900 Stellar MLS as Distributed by MLS Grid
Property tax history
+5.6%/yrLatest (2025): $1,058 · +21.8% YoY. Source: county tax records.
Cash-flow waterfall
monthlySold comps — $/sqft
last 12 mo · ≤1 miLoading sold comps…