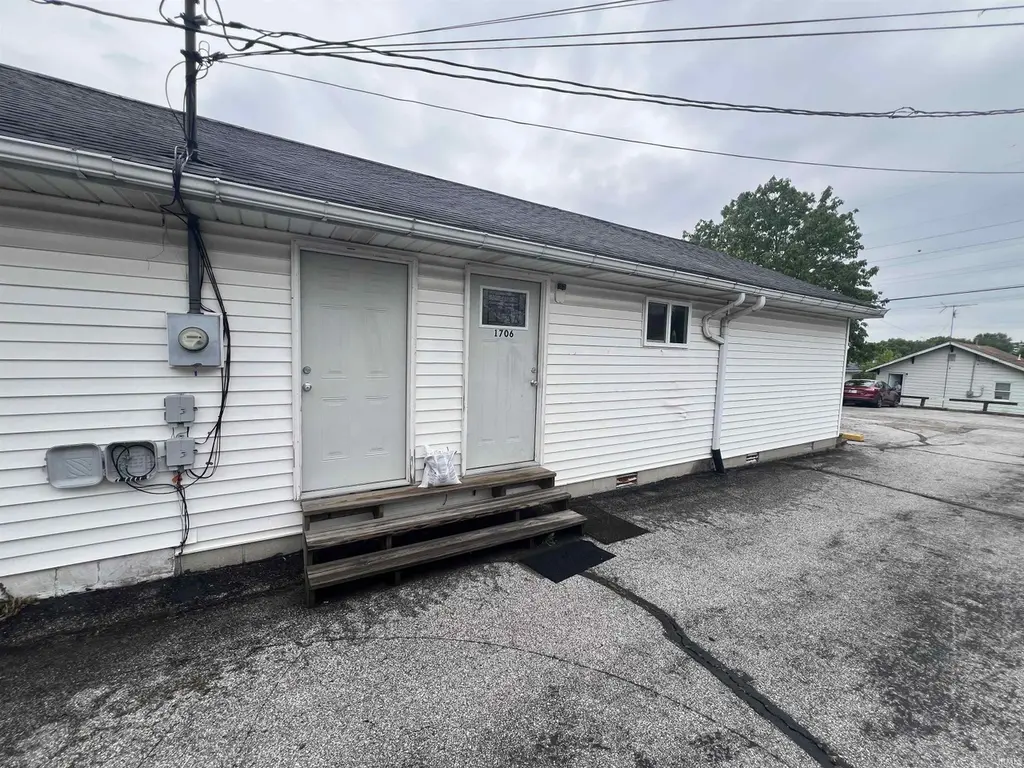
 Duplex
1708 24th St · Bedford, IN
Flood risk 1/10 · Minimal
- FEMA flood zone
- X (unshaded)
- Chance of flooding over 30 yrs
- 0.0%
- Est. flood insurance / yr
- $507 – $1,088
Fire risk 1/10 · Minimal
- Est. fire insurance / yr
- $717 – $1,331
Heat risk 5/10 · Moderate
- Hot days now (above 104°F)
- 7 days/yr
- Hot days in 30 yrs
- 19 days/yr
Wind risk 2/10 · Minimal
- Chance of severe wind over 30 yrs
- 1.0%
Air-quality risk 2/10 · Minimal
- Unhealthy air days now
- 0 days/yr
- Unhealthy air days in 30 yrs
- 1 days/yr
Risk factors via First Street. Map © Google.
Why this score? — see what drove the B- grade
The composite is a weighted blend of 9 inputs, each scored 0–100. Each bar is that input's sub-score; the figure is the points it added to the 100-point composite (weight × sub-score).
- Cash flow +28.4/30.0
- DSCR +10.0/10.0
- ARV discount +8.7/15.0
- 1% rule +8.0/10.0
- Livability +4.0/5.0
- Schools +3.2/10.0
- Rent growth +2.5/5.0
- Condition / age +2.2/5.0
- Appreciation +0.0/10.0
$199,900
🖨 Deal sheet (PDF) 📄 Offer letter ✓ Due diligence
Multi-family units
County records classify this as Multi-Family (5+ Unit). Listing-text estimate: 2 units. estimate disagrees with records
5+ unit building — per-unit beds/baths from public records are typically unavailable; the breakdown below (if shown) is an estimate from the listing text.
Listing remarks MLS
Excellent Duplex Investment Opportunity with Strong Rental Potential! Take advantage of this fully occupied duplex offering immediate rental income and future upside potential. Both tenants have maintained occupancy for nearly two years on month-to-month leases, providing stability while still allowing flexibility for the next owner. This versatile property features a total of 4 bedrooms and 3 bathrooms, including: One spacious 2 bed / 2 bath unit One well-appointed 2 bed / 1 bath unit Each unit includes: Laundry hookups Kitchen appliances included Comfortable, functional living spaces Investors will appreciate the opportunity to increase rents over time, as current rental rates are below market value. Additional features include a dedicated storage room located on the rear of the building and extensive storage shelving in the basement, offering valuable extra space for tenants or owner use. For added peace of mind, the seller is also including a home warranty, providing extra protection for the buyer after closing. Whether you're adding to your portfolio or entering the multifamily market, this duplex presents a great opportunity with steady income and long-term potential.
Key facts
- 5,400 sq ft lot
- Built 1940
- Listed 42 days
Property features AI
Finance
- Financial info: Two rental units with listed rents of $800/month and $900/month; Owner pays water; Gross income and expenses listed as 0
Exterior
- Utilities: Solid waste service: No
- Home design: Duplex (residential income property)
- Exterior features: Residential use; Asphalt road frontage on a city street; Frontage road access; Lot under 1/4 acre
Interior
- Kitchen: Each unit includes a range/oven, refrigerator, dishwasher, and disposal
- Bedrooms: Two 2-bedroom units
- Heating & cooling: Central air; Central heat pump; Forced heat; Electric hot water
- Interior features: Basement present; Property is a conversion
- Laundry & utility: Each unit has washer and dryer connections; washer and dryer listed in unit features
Neighborhood map
What this means for you Summary
Snapshot
- This is a 2 × 2-bed/1.5-bath units multifamily listed at $200k. Condition is rated fair.
Deal economics
- At list price, monthly cash flow is $645 ($8k/yr) — positive. Per door: $322/mo.
- The deal already cash-flows at list — no discount required.
- Meets the 1% rule at list price ($3k rent vs $200k).
- Recommended offer: $194k (3.0% below list) — sets the bar for market timing.
- Cap rate 10.2% vs local median 4.2% in Bedford — top-decile yield for the area; either an underpriced asset or a hidden risk that comps aren't pricing in. Stress-test before assuming the spread holds.
Location & tenants
- Location reads 80/100 on livability (#23 in IN, #1,958 nationally) — a professional / high-income tenant draw. Strengths: crime A+, cost of living A+, housing A+; Watch: employment D, commute F.
- North Lawrence Community Schools (rural): math 35% / reading 40% proficiency, ranked #170 of 301 in IN (top 56%) — families likely to look elsewhere, expect single-tenant / working-renter base with shorter leases.
- Zoned schools: Lincoln Elementary School (math 31% / reading 35%, grade F, #639 of 994 statewide, top 65%, 322 students, 64% FRL); Bedford-North Lawrence High School (math 38% / reading 63%, grade D+, #117 of 369 statewide, top 32%, 1,303 students, 46% FRL) — zoned schools average 55% FRL vs 40% district-wide (15 pts higher); higher-poverty schools than district average — tighter screening recommended.
- Market conditions: 158 active listings in the ZIP; 8 units permitted in Lawrence County in 2024 (0 in 5+ unit buildings).
- At $2,594/mo this rent would consume 46% of the median local household income ($68k/yr) (locally 507% of renters already pay >50% of income on rent) — very limited rent-growth headroom before tenants either downsize or default.
Forward outlook
- Local home prices are declining (-3.0%/yr); year-one equity from $1k of loan paydown is wiped out by about $6k of value loss. Plan a longer hold.
- Lawrence County population projected at -14% by 2050 — secular population decline; favor cash flow + early exit over multi-decade hold.
- At projected returns (-3.0% appreciation + 3.0% rent growth), your $56k cash investment doubles in ~9 years — after that, you're playing with house money.
Negotiation context
- It's been on market 43 days — a 3% lower offer ($194k) is reasonable based on typical stale-listing flexibility.
- 2 sale attempts; this cycle's ask has dropped $199.70M (100%) from the opening price — seller is motivated, your offer sets the floor, not the list.
Risks & watch-outs
- Watch-outs: built in 1940 — expect roof / HVAC / electrical / plumbing capex.
- Climate carrying-cost: extreme-heat days projected 7→19/yr by 2055 (HVAC capex compounding) — expect insurance premiums to compound above CPI over the hold.
Questions for the listing agent
- It's been on market 43 days. Have you received any prior offers? Is the seller open to a 3% concession, seller financing, or rate buy-down credit?
- Can we see the unit-by-unit rent roll, current vacancy, and any below-market leases? What's the average tenancy length?
- What capital expenditures (roof, boiler, parking lot, exteriors) have been made in the last 5 years, and what's planned in the next 2?
- Have any recent inspections been done? Can we get a copy of the seller's disclosures and any deferred-maintenance estimates?
- Built in 1940 — when were the roof, HVAC, electrical panel, plumbing, and water heater last replaced?
- Is there a deadline driving the sale (1031 exchange, divorce, estate, relocation)? That informs how much negotiation room exists.
- What's the average days-on-market for RENTAL listings here right now (not sales)? A rising rental-DOM trend means longer vacancies and softer asking-rent achievability than the comps imply.
- What's the recent tenant-quality profile in this submarket — average credit score on applications, eviction rate, late-payment / NSF rate, and stable-employment percentage? A property-management company in the area should have these aggregated.
- How much new apartment / multifamily construction is in the pipeline within 1–3 miles? Heavy new supply (>2% of stock underway) typically softens rents 12–24 months out; light construction supports rent growth.
Investment metrics
- 1% rule
- 1.30% ✓
- Cap rate
- 10.16%
- Cash-on-cash
- 13.82%
- DSCR
- 1.61
- GRM
- 6.4
CMA / ARV
- ARV (median comp)
- $205,475
- List price
- $199,900
- Delta
- -2.71%
- Verdict
- FAIR
- Comps
- 8 within 1.0 mi
Show comp detail 2 sales within ~0.75 mi
| Address | Dist | Beds/Ba | Sqft | Sold | Price | $/sf | Match |
|---|---|---|---|---|---|---|---|
| 1721 27th St | 0.23mi | 5/5.0 (+1) | 2,800 (-6%) | 20mo | $300,000 | $107 | 50 |
| 1714 M St | 0.59mi | 5/4.0 (+1) | 3,328 (+12%) | 1mo | $255,000 | $77 | 42 |
Match score weights: distance 35% · size 25% · config 20% · recency 20%. Top-matched comps best support the ARV.
Projected returns pro-forma
-3.0% appreciation · 3.0% rent growth · sell at horizon
- IRR
- 4.0%
- Equity multiple
- 1.16×
- Total profit
- $8,722
- Equity at exit
- $29,806
- IRR
- 13.6%
- Equity multiple
- 2.08×
- Total profit
- $60,684
- Equity at exit
- $17,284
Cash invested: $55,972 (down + closing). Projections, not guarantees.
Landlord ↔ Tenant lean methodology
- Overall (STATE)
- 90 Strongly Landlord-Friendly
- State Indiana
- 90 Strongly Landlord-Friendly · R+11
- County
- — inherits STATE
- City
- — inherits STATE
ZIP-level market 47421
- Home prices YoY
- -25.2%
- Active inventory
- 158
- Price-to-rent
- 12.8×
Monthly cashflow live
- Estimated rent
- $2,594 medium interval (Pro) →
- Mortgage (P&I)
- −$1,048
- Tax from tax record
- −$273 /mo · $3,276/yr
- Insurance
- −$83
- HOA
- −$0
- Vacancy / Maint / Mgmt
- −$545
- Net cashflow
- $645
Break-even live
Sensitivity live
| Price | -10% $758 | -5% $701 | +0% $645 | +5% $588 | +10% $532 |
|---|---|---|---|---|---|
| Rent | -10% $440 | -5% $542 | +0% $645 | +5% $747 | +10% $850 |
| Rate | -1.0pp $745 | -0.5pp $696 | base $645 | +0.5pp $593 | +1.0pp $540 |
2-unit breakdown (identical units grouped — click to expand)
| Units | Beds | Baths | Est. rent |
|---|---|---|---|
| 2× units | 2 | 1.5 | $2,594 |
| #1 | 2 | 1.5 | $1,297 |
| #2 | 2 | 1.5 | $1,297 |
| Total (2 units) | $2,594 | ||
UW: 25.0% down · 7.5% · 30yr · 1.5% tax · 5.0% vac · 8.0% maint · 8.0% mgmt
Financing live
Cash to close
- Down payment
- $49,975
- Closing costs
- $5,997
- Reserves months
- —
- Total cash needed
- —
Loan-product check · same deal, 3 products live
Conventional
25% down · 7.5% · 30yr
- Down + closing
- —
- Monthly P&I
- —
- Monthly cashflow
- —
- DSCR
- —
- Eligible?
- —
Personal DTI + credit; lowest rate.
DSCR
20% down · 8.5% · 30yr
- Down + closing
- —
- Monthly P&I
- —
- Monthly cashflow
- —
- DSCR
- —
- Eligible?
- —
No personal income docs; deal must DSCR.
Hard money
10% down · 12.0% · 12mo
- Down + closing
- —
- Monthly P&I
- —
- Monthly cashflow
- —
- DSCR
- —
- Eligible?
- —
Short-term bridge; refi at stabilization.
Listing history 20 events
-
2026-06-19days on market $199,900 Active 43 DOM
-
2026-06-18days on market $199,900 Active 42 DOM
-
2026-06-17days on market $199,900 Active 41 DOM
-
2026-06-16days on market $199,900 Active 40 DOM
-
2026-06-15days on market $199,900 Active 39 DOM
-
2026-06-14days on market $199,900 Active 37 DOM
-
2026-06-13days on market $199,900 Active 36 DOM
-
2026-06-10days on market $199,900 Active 34 DOM
-
2026-06-09days on market $199,900 Active 33 DOM
-
2026-06-08days on market $199,900 Active 32 DOM
-
2026-06-07days on market $199,900 Active 31 DOM
-
2026-06-05days on market $199,900 Active 28 DOM
-
2026-06-03days on market $199,900 Active 27 DOM
-
2026-06-02days on market $199,900 Active 26 DOM
-
2026-06-01days on market $199,900 Active 25 DOM
-
2026-05-31days on market $199,900 Active 24 DOM
-
2026-05-30days on market $199,900 Active 23 DOM
-
2026-05-08price $199,900 1192-char remark
Show marketing remark (1192 chars)
Excellent Duplex Investment Opportunity with Strong Rental Potential! Take advantage of this fully occupied duplex offering immediate rental income and future upside potential. Both tenants have maintained occupancy for nearly two years on month-to-month leases, providing stability while still allowing flexibility for the next owner. This versatile property features a total of 4 bedrooms and 3 bathrooms, including: One spacious 2 bed / 2 bath unit One well-appointed 2 bed / 1 bath unit Each unit includes: Laundry hookups Kitchen appliances included Comfortable, functional living spaces Investors will appreciate the opportunity to increase rents over time, as current rental rates are below market value. Additional features include a dedicated storage room located on the rear of the building and extensive storage shelving in the basement, offering valuable extra space for tenants or owner use. For added peace of mind, the seller is also including a home warranty, providing extra protection for the buyer after closing. Whether you're adding to your portfolio or entering the multifamily market, this duplex presents a great opportunity with steady income and long-term potential.
-
2026-05-08$199,900,000 Active 1192-char remark
Show marketing remark (1192 chars)
Excellent Duplex Investment Opportunity with Strong Rental Potential! Take advantage of this fully occupied duplex offering immediate rental income and future upside potential. Both tenants have maintained occupancy for nearly two years on month-to-month leases, providing stability while still allowing flexibility for the next owner. This versatile property features a total of 4 bedrooms and 3 bathrooms, including: One spacious 2 bed / 2 bath unit One well-appointed 2 bed / 1 bath unit Each unit includes: Laundry hookups Kitchen appliances included Comfortable, functional living spaces Investors will appreciate the opportunity to increase rents over time, as current rental rates are below market value. Additional features include a dedicated storage room located on the rear of the building and extensive storage shelving in the basement, offering valuable extra space for tenants or owner use. For added peace of mind, the seller is also including a home warranty, providing extra protection for the buyer after closing. Whether you're adding to your portfolio or entering the multifamily market, this duplex presents a great opportunity with steady income and long-term potential.
-
2026-05-05$199,900 Active 1214-char remark
ⓘ Source: listings_history table (triggers on properties + properties_extension) + one-shot
backfill from property_details.listing_events for pre-trigger history.
Tax reassessment forecast IN · Partial reset (capped growth)
- Current annual tax
- $3,276 · $273/mo
- Projected year-2 tax
- $3,276 · $273/mo
- Expected delta
- $0/yr ($0/mo · 0.0%)
ⓘ Screening estimate from a state-policy table — verify with the county assessor before closing.
Climate risk First Street
- Flood 1/10 Low FEMA zone X (unshaded) · 0% chance over 30 yrs
- Wildfire 1/10 Low
- Heat 5/10 Major 7 d/yr ≥104°F today · 19 d/yr by 30 yrs out
- Wind 2/10 Low 100% chance of damaging wind over 30 yrs
- Air quality 2/10 Low 0 unhealthy d/yr today · 1 by 30 yrs out
Nearby sold comps map
Loading sold comps map…
Walkable amenities ~0.75 mi
Loading nearby amenities…
Taxation est. · year 1
- Rental income
- $31,128
- − Mortgage interest
- −$11,198
- − Property taxes
- −$3,276
- − Insurance
- −$1,000
- − Repairs & maintenance
- −$2,490
- − Management
- −$2,490
- − Depreciation
- −$5,815
- Taxable income
- $4,860
- Est. tax owed @ 24.0%
- −$1,166
- After-tax cash flow
- $6,570/yr
For passive investors: Depreciation is non-cash, so a rental often shows a tax loss while cash-flowing — sheltering income. Rental losses are passive: they offset passive income freely, and up to $25,000/yr can offset ordinary (W-2) income if you actively participate and your MAGI is under $100k (phasing out to $0 by $150k); unused losses carry forward. On sale, claimed depreciation is recaptured at up to 25%, and gains may owe capital-gains tax (a 1031 exchange can defer both). Figures are a year-1 estimate at your 24.0% rate — not tax advice; consult a CPA.
Condition & rehab AI · 12 photos
This multi-family property requires moderate renovations, including painting, landscaping, and decluttering, to improve its condition and value.
Repairs flagged
- Major Paint — Paint appears worn in some areas
- Major Landscaping — Overgrown yard and lack of landscaping
- Major Clutter — Clutter in kitchen and bathrooms
Value-add opportunities
- Both Paint exterior and interior — Fresh paint can improve curb appeal and interior aesthetics
- Both Landscaping and yard maintenance — A well-maintained yard can increase both resale and rental value
- Both Deep cleaning and decluttering — A clean and organized home is more appealing to potential buyers and renters
Renovation cost estimate screening
| Repair item | Severity | Est. cost |
|---|---|---|
| Paint · Paint appears worn in some areas | Major | $15,000–50,000 |
| Landscaping · Overgrown yard and lack of landscaping | Major | $15,000–50,000 |
| Clutter · Clutter in kitchen and bathrooms | Major | $15,000–50,000 |
| Total estimated repair cost · 3 items | $45,000–150,000 |
Value-add ROI direction
- Both Paint exterior and interior — Fresh paint can improve curb appeal and interior aesthetics ↑
- Both Landscaping and yard maintenance — A well-maintained yard can increase both resale and rental value ↑
- Both Deep cleaning and decluttering — A clean and organized home is more appealing to potential buyers and renters ↑
ⓘ Cost ranges are severity-bucket heuristics (US national rule-of-thumb). Get contractor quotes + a written scope before underwriting a rehab budget.
Schools (NCES district)
- District
- North Lawrence Community Schools
- NCES district ID
- 1807860
- Math proficiency
- 35% ▼ -2.00%
- Reading proficiency
- 40% ▼ -3.00%
- Median HH income
- $44,566
- Composite
- 31.88/100
- National rank
- #5864
- State rank
- #170 of 301 in IN
Livability — Bedford
- Score
- 80/100
- State rank
- #23
- US rank
- #1958
Category grades
Schools grade is shown separately in the Schools card above.
Census & demographics
- Census place
- Bedford, IN
- County
- Lawrence County · 27,599 people
- City population
- 27,599
- Metro
- Bedford, IN
- Population (ZIP)
- 27,599
- Household income
- $68,108
- Rent vs Own
- Severe rent burden
- 507.0
Population outlook (Lawrence County) Hauer SSP2
- Today (2025)
- 44,347 people
- By 2030
- 43,331 · -2.3%
- By 2040
- 40,887 · -7.8%
- By 2050
- 38,297 · -13.6%
- By 2075
- 32,479 · -26.8%
- By 2100
- 26,051 · -41.3%
Race, ethnicity, and origin ACS 2023
- Neighborhood character
- Predominantly White (94%)
- Race & ethnicity
- White 94% Two or more races 4% Hispanic / Latino 2%
- Common ancestry
- Slovak 3% Italian 2% Scotch-Irish 1%
- Foreign-born
- 1% · Canada
- Languages at home
- 99% English-only · Spanish 1%
Political lean MEDSL · Lawrence
- 2024 margin
- Solid R (+51.0) · D 23.6% · R 74.6% · Other 1.7%
- 2008→2024 swing
- -30.5pp toward R · 2008: -20.6pp · 2024: -51.0pp
- All cycles
- 2024: R+51.0 2020: R+50.6 2016: R+51.5 2012: R+32.8 2008: R+20.6
Not yet ingested
- Civics
- —
Market trends
- HPI YoY
- ▼ -81.32%
- Current HPI
- 240.959
- Rent YoY
- —
- Metro
- Bedford, IN
- State GDP YoY
- ▲ 2.90%
- F500 in state
- 18
Industry mix (Fortune 500 HQ in IN)
| Industry | F500 HQs | Revenue |
|---|---|---|
| Industrial Machinery | 2 | $37B |
|
||
| Healthcare | 1 | $177B |
|
||
| Pharmaceuticals | 1 | $45B |
|
||
| Metals / Steel | 1 | $18B |
|
||
| Agriculture | 1 | $17B |
|
||
| Packaging | 1 | $12B |
|
||
Price history
+0.0% since first listed3 events — show timeline
- 2026-05-08 Price Changed $199,900 IRMLS
- 2026-05-08 Listed $199,900,000 IRMLS
- 2026-05-05 Listed $199,900 MIBOR as Distributed by MLS Grid
Property tax history
+4.4%/yrLatest (2025): $3,276 · +52.4% YoY. Source: county tax records.
Cash-flow waterfall
monthlySold comps — $/sqft
last 12 mo · ≤1 miLoading sold comps…