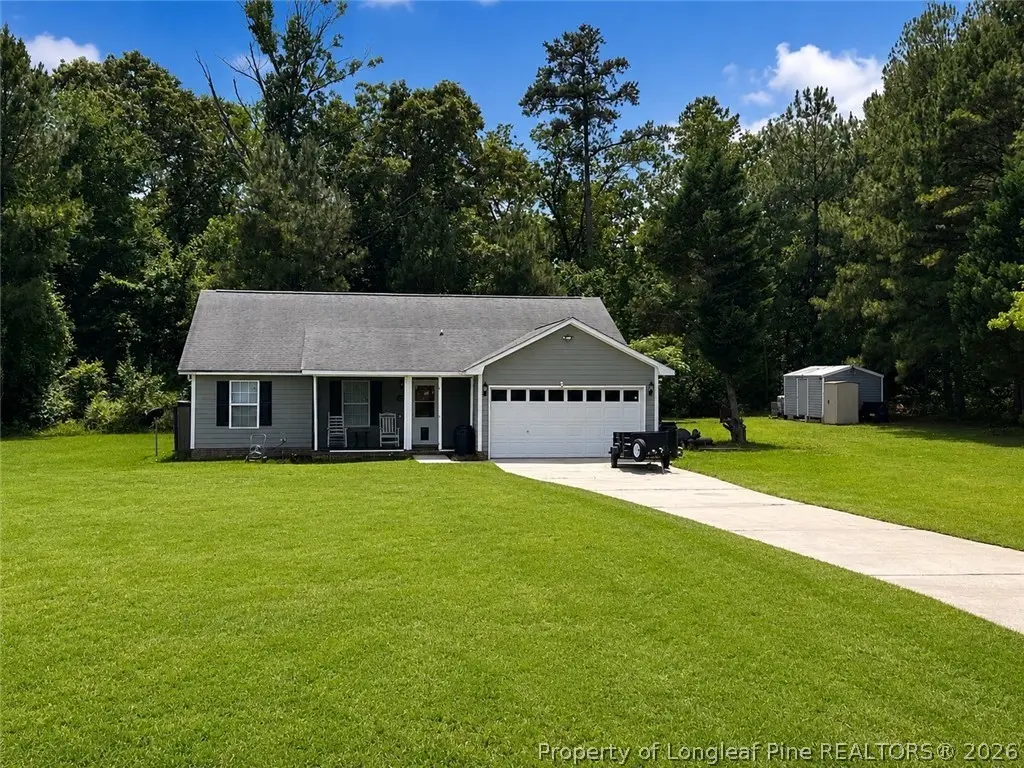
203 Drew St · Fayetteville, NC
Flood risk 1/10 · Minimal
- FEMA flood zone
- X (unshaded)
- Chance of flooding over 30 yrs
- 0.0%
- Est. flood insurance / yr
- $507 – $1,088
Fire risk 6/10 · Moderate
- Est. fire insurance / yr
- $906 – $1,684
Heat risk 7/10 · Major
- Hot days now (above 106°F)
- 7 days/yr
- Hot days in 30 yrs
- 16 days/yr
Wind risk 6/10 · Moderate
- Chance of severe wind over 30 yrs
- 73.0%
Air-quality risk 1/10 · Minimal
- Unhealthy air days now
- 0 days/yr
- Unhealthy air days in 30 yrs
- 0 days/yr
Risk factors via First Street. Map © Google.
Why this score? — see what drove the D grade
The composite is a weighted blend of 9 inputs, each scored 0–100. Each bar is that input's sub-score; the figure is the points it added to the 100-point composite (weight × sub-score).
- Cash flow +13.0/30.0
- ARV discount +10.1/15.0
- DSCR +3.9/10.0
- Livability +3.8/5.0
- Schools +3.2/10.0
- Rent growth +3.0/5.0
- 1% rule +2.8/10.0
- Condition / age +2.5/5.0
- Appreciation +0.0/10.0
$243,500
🖨 Deal sheet 📄 Offer letter ✓ Due diligence
Listing remarks MLS
Rustic,yet modern.Open concept flr plan features modern kitchen w/granite counter tops,SS appliances,stylish back splash & brk bar.Stylish laminate throughout main living space.New light fixtures,new flooring,fresh coat of paint in & out.Rustic barn door & granite in master bath.This gorgeous home backs up to thewoods-great privacy and NO neighbors.Fenced backyard, back deck & fire pit-great for entertainment,BBQs & 0.66 AC Rustic,yet modern.Open concept floor plan features modern kitchen w/granite counter tops, SS appliances,stylish back splash & brk bar. Stylish laminate throughout main living space. New light fixtures,new flooring,fresh coat of paint in & out.Rustic barn door & granite in master bath.This gorgeous home backs up to thewoods-great privacy and NO neighbors.Fenced backyard,back deck & fire pit-great for entertainment, BBQs & fur babies..0.66 AC.
Key facts
- 0.65 acre lot
- 2 garage spots
- Built 1996
Property features AI
Exterior
- Parking: Attached 2-car garage; 2 covered parking spaces
- Security: Security system; Smoke detectors
- Utilities: Public water; Sewer: holding tank and septic tank
- Home design: Single-family residence; Residential property; Subdivision: COBBLE RIDGE
- Construction: Fiber cement exterior
- Exterior features: Deck; Porch with front porch; Screened porch; Shed(s); Located on a cul-de-sac
Interior
- Kitchen: Refrigerator; Dishwasher; Range; Granite counters; Eat-in kitchen
- Bedrooms: Bedrooms: (see floor plan for counts and locations)
- Flooring: Carpet; Laminate; Tile
- Bathrooms: Two full bathrooms
- Heating & cooling: Heat pump heating; Ceiling fan cooling
- Interior features: Ceiling fans; Entrance foyer; Eat-in kitchen; Granite counters; Walk-in closets; Window coverings and blinds; Factory-built fireplace
- Laundry & utility: Washer hookup in garage
Neighborhood map
What this means for you Summary
Snapshot
- This is a 3-bed/2.0-bath single-family listed at $244k.
Deal economics
- At list price, monthly cash flow is $-13 ($-152/yr) — negative.
- To cash-flow at today's rent, offer at most $241k (0.9% below list).
- To meet the 1% rule (rent ≥ 1% of price), the offer needs to be $189k (22.3% below list).
- Recommended offer: $189k (22.3% below list) — sets the bar for 1% rule.
- Cap rate 6.2% vs local median 4.9% in Fayetteville — meaningfully above typical; check what's discounted (condition, days-on-market, listing class) to confirm the premium yield is real.
Location & tenants
- Location reads 75/100 on livability (#45 in NC, #4,031 nationally) — a middle-class / working-renter tenant base. Strengths: commute A+, cost of living A+, housing A+; Watch: crime F, employment D-.
- Hoke County Schools (suburban): math 35% / reading 40% proficiency, ranked #123 of 178 in NC (top 69%) — families likely to look elsewhere, expect single-tenant / working-renter base with shorter leases.
- Zoned schools: Upchurch Elementary (math 37% / reading 40%, grade F, #750 of 1,410 statewide, top 54%, 698 students, 100% FRL); Hoke County High (math 42% / reading 44%, grade F, #372 of 535 statewide, top 69%, 2,060 students, 100% FRL) — zoned schools average 100% FRL vs 57% district-wide (43 pts higher); higher-poverty schools than district average — tighter screening recommended.
- Market conditions: Rents rising (+1.9%/yr); 566 active listings in the ZIP; 9 comparable units currently listed for rent nearby; rentals leasing fast (median 14d on market — plan ~1-2 weeks tenant-placement turnaround); 685 units permitted in Hoke County in 2024 (0 in 5+ unit buildings).
- This rent runs 34% of the median local income ($66k/yr) — at the standard rent-burdened threshold; future hikes will face affordability resistance.
Forward outlook
- Local home prices are declining (-3.0%/yr); year-one equity from $2k of loan paydown is wiped out by about $7k of value loss. Plan a longer hold.
- Hoke County population projected at +36% by 2050 — long-run rental-demand tailwind backs the buy-and-hold thesis.
Negotiation context
- Only 2 days on market — expect competitive offers; lowballing is unlikely to land.
- 3 sale attempts since 9y ago; this cycle's ask is 62% above the opening price — seller raised mid-cycle; expect resistance to lowballs.
- Current owner paid $150k; list at $244k implies a 62% gain — meaningful room to come down on a strong offer.
Risks & watch-outs
- Climate carrying-cost: major wind risk, 73% chance of damaging wind over 30y; major wildfire risk; extreme-heat days projected 7→16/yr by 2055 (HVAC capex compounding) — expect insurance premiums to compound above CPI over the hold.
Questions for the listing agent
- What do current leases actually rent for vs. the listed asking? Can we see a recent rent roll and the last 12 months of T-12 income?
- Is there a deadline driving the sale (1031 exchange, divorce, estate, relocation)? That informs how much negotiation room exists.
- Crime grade is F in this area — have there been break-ins, vandalism, or insurance claims at this property in the last 3 years? What carrier currently insures it and at what premium?
- The area grade is low — what's the realistic commute time and amenity access for the typical tenant pool here? Any planned neighborhood developments (good or bad) we should know about?
- What's the average days-on-market for RENTAL listings here right now (not sales)? A rising rental-DOM trend means longer vacancies and softer asking-rent achievability than the comps imply.
- What's the recent tenant-quality profile in this submarket — average credit score on applications, eviction rate, late-payment / NSF rate, and stable-employment percentage? A property-management company in the area should have these aggregated.
- How much new for-sale + rental construction is in the pipeline within 1–3 miles? Heavy new supply typically softens prices + rents 12–24 months out; constrained supply supports both.
Investment metrics
- 1% rule
- 0.78% ✗
- Cap rate
- 6.23%
- Cash-on-cash
- -0.22%
- DSCR
- 0.99
- GRM
- 10.7
CMA / ARV
- ARV (on-the-fly)
- $258,720
- Comps found
- 12
Show comp detail 12 sales within ~0.75 mi
| Address | Dist | Beds/Ba | Sqft | Sold | Price | $/sf | Match |
|---|---|---|---|---|---|---|---|
| 180 Cafe Price Ct | 0.14mi | 3/2.0 | 1,562 (+6%) | 19mo | $282,900 | $181 | 67 |
| 112 Woodland Ct | 0.48mi | 3/2.0 | 1,361 (-7%) | 3mo | $257,999 | $190 | 63 |
| 322 Woodberry Cir | 0.45mi | 3/2.0 | 1,410 (-4%) | 13mo | $262,000 | $186 | 61 |
| 303 Woodberry Cir | 0.44mi | 3/2.0 | 1,598 (+9%) | 7mo | $225,000 | $141 | 59 |
| 339 Woodberry Cir | 0.50mi | 3/2.0 | 1,534 (+4%) | 15mo | $250,000 | $163 | 57 |
| 410 Woodberry Cir | 0.67mi | 3/2.0 | 1,544 (+5%) | 5mo | $258,000 | $167 | 57 |
| 330 Woodberry Cir | 0.47mi | 3/2.0 | 1,553 (+6%) | 20mo | $253,000 | $163 | 52 |
| 387 Woodberry Cir | 0.72mi | 3/2.0 | 1,560 (+6%) | 13mo | $274,500 | $176 | 46 |
| 159 Independence Dr | 0.48mi | 3/2.0 | 1,259 (-14%) | 9mo | $235,000 | $187 | 46 |
| 419 Woodberry Cir | 0.68mi | 3/2.0 | 1,639 (+12%) | 4mo | $260,000 | $159 | 45 |
| 111 Sprucepine Dr | 0.73mi | 3/2.0 | 1,375 (-6%) | 14mo | $225,000 | $164 | 43 |
| 106 Liberty Ct | 0.50mi | 3/2.0 | 1,250 (-15%) | 20mo | $223,000 | $178 | 36 |
Match score weights: distance 35% · size 25% · config 20% · recency 20%. Top-matched comps best support the ARV.
Projected returns pro-forma
-3.0% appreciation · 1.92% rent growth · sell at horizon
- IRR
- -17.8%
- Equity multiple
- 0.38×
- Total profit
- $-42,379
- Equity at exit
- $36,307
- IRR
- -12.0%
- Equity multiple
- 0.32×
- Total profit
- $-46,433
- Equity at exit
- $21,053
Cash invested: $68,180 (down + closing). Projections, not guarantees.
Landlord ↔ Tenant lean methodology
- Overall (STATE)
- 85 Strongly Landlord-Friendly
- State North Carolina
- 85 Strongly Landlord-Friendly · R+3
- County
- — inherits STATE
- City
- — inherits STATE
ZIP-level market 28376
- Home prices YoY
- -24.0%
- Rents YoY
- 1.9%
- Active inventory
- 566
- Price-to-rent
- 10.7×
Monthly cashflow live
- Estimated rent
- $1,892 high interval (Pro) →
- Mortgage (P&I)
- −$1,277
- Tax from tax record
- −$129 /mo · $1,550/yr
- Insurance
- −$101
- HOA
- −$0
- Vacancy / Maint / Mgmt
- −$397
- Net cashflow
- $-13
Break-even live
UW: 25.0% down · 7.5% · 30yr · 1.5% tax · 5.0% vac · 8.0% maint · 8.0% mgmt
Financing live
Cash to close
- Down payment
- $60,875
- Closing costs
- $7,305
- Reserves months
- —
- Total cash needed
- —
Loan-product check · same deal, 3 products live
Conventional
25% down · 7.5% · 30yr
- Down + closing
- —
- Monthly P&I
- —
- Monthly cashflow
- —
- DSCR
- —
- Eligible?
- —
Personal DTI + credit; lowest rate.
DSCR
20% down · 8.5% · 30yr
- Down + closing
- —
- Monthly P&I
- —
- Monthly cashflow
- —
- DSCR
- —
- Eligible?
- —
No personal income docs; deal must DSCR.
Hard money
10% down · 12.0% · 12mo
- Down + closing
- —
- Monthly P&I
- —
- Monthly cashflow
- —
- DSCR
- —
- Eligible?
- —
Short-term bridge; refi at stabilization.
Rent comps 9 comps
| Address | Beds | Baths | Sqft | Rent | $/sqft | DOM | Units | Dist |
|---|---|---|---|---|---|---|---|---|
| 1002 South Pointe Dr Raeford, NC | 1.0–3.0 | 1.0–2.0 | 1074 | $1,920 | $1.79 | 13d | 24 | 0.18mi |
| 109 Timberidge Dr Raeford, NC | 3.0 | 2.0 | 1384 | $1,765 | $1.28 | 13d | 1 | 0.32mi |
| 334 Woodberry Cir Raeford, NC | 3.0 | 2.0 | 1598 | $1,650 | $1.03 | 13d | 1 | 0.51mi |
| 9000 Stone Gate Dr Raeford, NC | 1.0–3.0 | 1.0–2.0 | 1029 | $1,757 | $1.71 | 13d | 12 | 0.80mi |
| 1502 Clan Campbell Dr Raeford, NC | 3.0 | 2.0 | 1296 | $1,395 | $1.08 | 13d | 1 | 0.86mi |
| 1552 Clan Campbell Dr Raeford, NC | 3.0 | 2.0 | 1241 | $1,695 | $1.37 | 13d | 1 | 0.96mi |
| 140 Verdmont Dr Raeford, NC | 3.0 | 2.5 | 1856 | $2,200 | $1.19 | 23d | 1 | 1.01mi |
| 641 Hogart St Raeford, NC | 3.0 | 2.0 | 1501 | $1,800 | $1.20 | 23d | 1 | 1.06mi |
| 105 Joseph Dr Raeford, NC | 3.0 | 2.0 | 1152 | $1,275 | $1.11 | 23d | 1 | 1.33mi |
Listing history 6 events
-
2026-06-05statusdays on market $243,500 Pending 2 DOM
-
2026-06-03statusdays on market $243,500 Active 1 DOM
-
2026-06-02days on market $243,500 Coming Soon 3 DOM
-
2026-06-01days on market $243,500 Coming Soon 2 DOM
-
2026-05-30remarks 699-char remark
-
2026-05-30$243,500 Coming Soon 1 DOM
ⓘ Source: listings_history table (triggers on properties + properties_extension) + one-shot
backfill from property_details.listing_events for pre-trigger history.
Tax reassessment forecast NC · Resets to sale price
- Current annual tax
- $1,550 · $129/mo
- Projected year-2 tax
- $1,997 · $166/mo
- Expected delta
- +$447/yr (+$37/mo · 28.9%)
ⓘ Screening estimate from a state-policy table — verify with the county assessor before closing.
Climate risk First Street
- Flood 1/10 Low FEMA zone X (unshaded) · 0% chance over 30 yrs
- Wildfire 6/10 Major
- Heat 7/10 Severe 7 d/yr ≥106°F today · 16 d/yr by 30 yrs out
- Wind 6/10 Major 73% chance of damaging wind over 30 yrs
- Air quality 1/10 Low 0 unhealthy d/yr today · 0 by 30 yrs out
Nearby sold comps map
Loading sold comps map…
Walkable amenities ~0.75 mi
Loading nearby amenities…
Taxation est. · year 1
- Rental income
- $22,707
- − Mortgage interest
- −$13,640
- − Property taxes
- −$1,550
- − Insurance
- −$1,218
- − Repairs & maintenance
- −$1,817
- − Management
- −$1,817
- − Depreciation
- −$7,084
- Taxable loss
- −$4,417
- Est. tax savings @ 24.0%
- +$1,060
- After-tax cash flow
- $908/yr
For passive investors: Depreciation is non-cash, so a rental often shows a tax loss while cash-flowing — sheltering income. Rental losses are passive: they offset passive income freely, and up to $25,000/yr can offset ordinary (W-2) income if you actively participate and your MAGI is under $100k (phasing out to $0 by $150k); unused losses carry forward. On sale, claimed depreciation is recaptured at up to 25%, and gains may owe capital-gains tax (a 1031 exchange can defer both). Figures are a year-1 estimate at your 24.0% rate — not tax advice; consult a CPA.
Schools (NCES district)
- District
- Hoke County Schools
- NCES district ID
- 3702250
- Math proficiency
- 35% ▼ -1.00%
- Reading proficiency
- 40% ▲ 1.00%
- Median HH income
- $43,896
- Composite
- 31.82/100
- National rank
- #5880
- State rank
- #123 of 178 in NC
Livability — Fayetteville
- Score
- 75/100
- State rank
- #45
- US rank
- #4031
Category grades
Schools grade is shown separately in the Schools card above.
Census & demographics
- County
- Hoke County · 44,880 people
- City population
- 226,118
- Metro
- Fayetteville, NC
- Population (ZIP)
- 44,880
- Household income
- $66,471
- Rent vs Own
- Severe rent burden
- 897.0
Population outlook (Hoke County) Hauer SSP2
- Today (2025)
- 63,354 people
- By 2030
- 68,361 · +7.9%
- By 2040
- 78,074 · +23.2%
- By 2050
- 86,384 · +36.4%
- By 2075
- 99,517 · +57.1%
- By 2100
- 98,939 · +56.2%
Race, ethnicity, and origin ACS 2023
- Neighborhood character
- Highly diverse neighborhood (Simpson 0.71)
- Race & ethnicity
- White 38% Black 35% Hispanic / Latino 15% Two or more races 9% Native American 3% Asian 1%
- Hispanic origin (detail)
- Mexican 7% Puerto Rican 4%
- Common ancestry
- Slovak 2% Romanian 1% Italian 1%
- Foreign-born
- 6% · Canada, Vietnam
- Languages at home
- 89% English-only · Spanish 8% French/Haitian/Cajun 1%
Political lean MEDSL · Hoke
- 2024 margin
- Lean D (+5.9) · D 52.4% · R 46.4% · Other 1.2%
- 2008→2024 swing
- -12.8pp toward R · 2008: 18.8pp · 2024: 5.9pp
- All cycles
- 2024: D+5.9 2020: D+10.9 2016: D+10.8 2012: D+19.0 2008: D+18.8
Not yet ingested
- Civics
- —
Market trends
- HPI YoY
- ▼ -53.30%
- Current HPI
- 169.1801
- Rent YoY
- ▲ 1.92%
- Metro
- Fayetteville, NC
- State GDP YoY
- ▲ 3.28%
- F500 in state
- 26
Industry mix (Fortune 500 HQ in NC)
| Industry | F500 HQs | Revenue |
|---|---|---|
| Financial Services | 2 | $213B |
|
||
| Retail | 2 | $95B |
|
||
| Industrial Conglomerate | 1 | $38B |
|
||
| Metals / Steel | 1 | $35B |
|
||
| Utilities | 1 | $30B |
|
||
| Industrial Machinery | 1 | $19B |
|
||
Price history
+87.3% since first listed9 events — show timeline
- 2026-05-30 Coming Soon $243,500 LPRMLS
- 2018-05-18 Sold (Public Records) $150,000 Public Records
- 2018-05-18 Sold (MLS) $149,900 LPRMLS
- 2018-05-18 Sold (MLS) $149,900 TMLS
- 2018-04-12 Listed $149,900 LPRMLS
- 2018-04-12 Listed $149,900 TMLS
- 2017-12-29 Sold (MLS) $91,700 LPRMLS
- 2017-11-14 Listed $87,500 LPRMLS
- 2012-11-20 Sold (Public Records) $130,000 Public Records
Property tax history
+3.0%/yrLatest (2025): $1,550 · +0.0% YoY. Source: county tax records.
Cash-flow waterfall
monthlySold comps — $/sqft
last 12 mo · ≤1 miLoading sold comps…