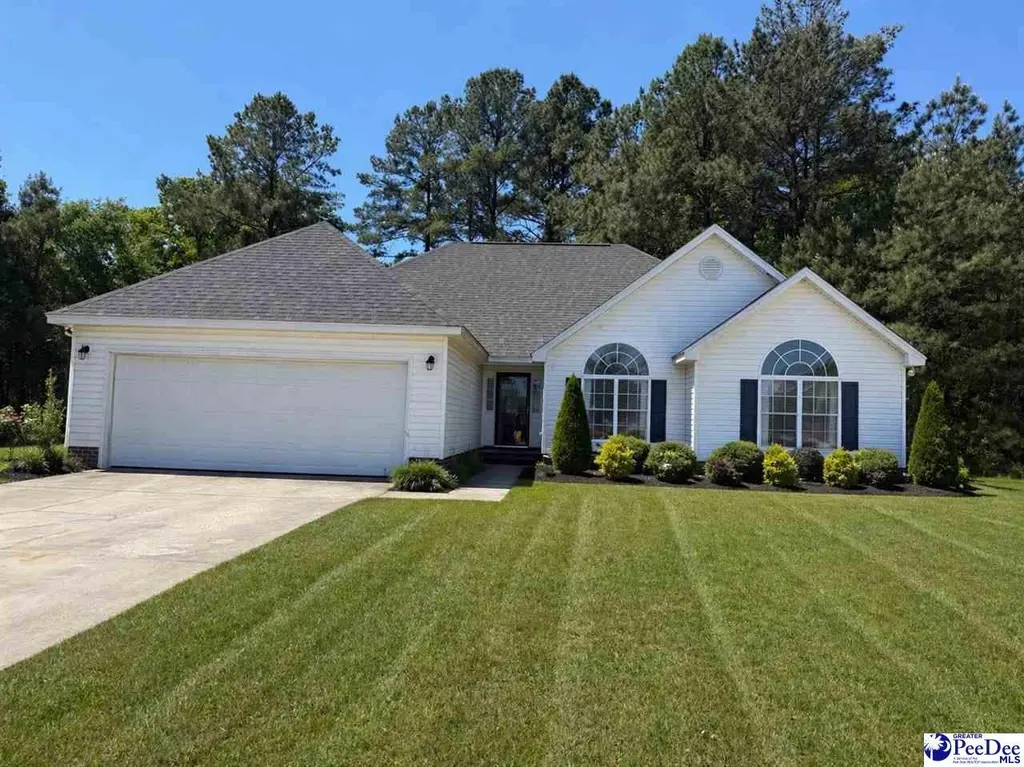
404 Spike Ct · Florence, SC
Flood risk 1/10 · Minimal
- FEMA flood zone
- X (unshaded)
- Chance of flooding over 30 yrs
- 0.0%
- Est. flood insurance / yr
- $507 – $1,088
Fire risk 5/10 · Moderate
- Est. fire insurance / yr
- $783 – $1,453
Heat risk 7/10 · Major
- Hot days now (above 108°F)
- 7 days/yr
- Hot days in 30 yrs
- 16 days/yr
Wind risk 8/10 · Major
- Chance of severe wind over 30 yrs
- 80.0%
Air-quality risk 1/10 · Minimal
- Unhealthy air days now
- 0 days/yr
- Unhealthy air days in 30 yrs
- 0 days/yr
Risk factors via First Street. Map © Google.
Why this score? — see what drove the D grade
The composite is a weighted blend of 9 inputs, each scored 0–100. Each bar is that input's sub-score; the figure is the points it added to the 100-point composite (weight × sub-score).
- Cash flow +12.4/30.0
- ARV discount +11.9/15.0
- Rent growth +4.2/5.0
- DSCR +3.7/10.0
- Schools +3.2/10.0
- Livability +3.1/5.0
- 1% rule +2.6/10.0
- Condition / age +2.5/5.0
- Appreciation +0.0/10.0
$245,000
🖨 Deal sheet (PDF) 📄 Offer letter ✓ Due diligence
Listing remarks
Welcome to this well-maintained 4-bedroom, 2-bath home located on a quiet cul-de-sac in the desirable Southbrook subdivision. Offering 1,821 square feet of comfortable living space on a . 27-acre lot, this home combines functionality with thoughtful upgrades. Inside, you’ll find a spacious layout featuring a separate dining room, perfect for gatherings and entertaining. The living area is anchored by a cozy gas fireplace, creating a warm and inviting atmosphere. The home offers generously sized bedrooms, including walk-in closets that provide ample storage. The primary suite is designed for relaxation, complete with a Jacuzzi tub for unwinding after a long day. Additional highlights i
Key facts
- Walk-in closets
- Jacuzzi tub
- New roof
Tags
Property features AI
Finance
- Other: Subdivision: Southbrook
- HOA & community: Homeowners association with $30 monthly fee
Exterior
- Parking: Attached 2-car garage
- Utilities: Public water; Public sewer
- Home design: Single-family residence; Residential property; Vinyl siding
- Construction: Shingle roof; Vinyl siding construction; Crawl space foundation
- Exterior features: Patio; Cul-de-sac lot
Interior
- Kitchen: Dishwasher; Microwave; Range; Refrigerator
- Flooring: Tile; Wood / Hardwood
- Bathrooms: 2 full bathrooms
- Heating & cooling: Central heating; Central air; Ceiling fans
- Interior features: Cathedral ceilings; Vaulted ceilings; Walk-in closets; Gas log fireplace (1)
Neighborhood map
What this means for you Summary
Snapshot
- This is a 4-bed/2.0-bath single-family listed at $245k.
Deal economics
- At list price, monthly cash flow is $-40 ($-477/yr) — negative.
- To cash-flow at today's rent, offer at most $238k (2.9% below list).
- To meet the 1% rule (rent ≥ 1% of price), the offer needs to be $185k (24.4% below list).
- Recommended offer: $185k (24.4% below list) — sets the bar for 1% rule.
- Cap rate 6.1% vs local median 3.5% in Florence — top-decile yield for the area; either an underpriced asset or a hidden risk that comps aren't pricing in. Stress-test before assuming the spread holds.
Location & tenants
- Location reads 62/100 on livability (#196 in SC) — a middle-class / working-renter tenant base. Strengths: cost of living A+, housing A+, health & safety B+; Watch: employment C-, crime F, amenities F.
- Florence 01 (urban): math 29% / reading 47% proficiency, ranked #34 of 80 in SC (top 42%) — families likely to look elsewhere, expect single-tenant / working-renter base with shorter leases.
- Zoned schools: Savannah Grove Elementary (math 24% / reading 29%, grade F, #435 of 597 statewide, top 73%, 432 students, 100% FRL); Henry L. Sneed Middle (math 16% / reading 35%, grade F, #162 of 229 statewide, top 71%, 693 students, 94% FRL); South Florence High (math 58% / reading 86%, grade B+, #48 of 196 statewide, top 26%, 1,643 students, 77% FRL) — zoned schools average 90% FRL vs 57% district-wide (33 pts higher); higher-poverty schools than district average — tighter screening recommended.
- Market conditions: Rents rising fast (+7.0%/yr); 185 active listings in the ZIP; 657 units permitted in Florence County in 2024 (40 in 5+ unit buildings).
- This rent runs 33% of the median local income ($67k/yr) — at the standard rent-burdened threshold; future hikes will face affordability resistance.
Forward outlook
- Local home prices are declining (-3.0%/yr); year-one equity from $2k of loan paydown is wiped out by about $7k of value loss. Plan a longer hold.
Negotiation context
- It's been on market 61 days — a 6% lower offer ($230k) is reasonable based on typical stale-listing flexibility.
- Current owner paid $180k; 36% above their basis — modest negotiation headroom, anchor on the comps not their cost.
Risks & watch-outs
- Climate carrying-cost: severe wind risk, 80% chance of damaging wind over 30y; moderate wildfire risk; extreme-heat days projected 7→16/yr by 2055 (HVAC capex compounding) — expect insurance premiums to compound above CPI over the hold.
Questions for the listing agent
- What do current leases actually rent for vs. the listed asking? Can we see a recent rent roll and the last 12 months of T-12 income?
- It's been on market 61 days. Have you received any prior offers? Is the seller open to a 24% concession, seller financing, or rate buy-down credit?
- What does the HOA fee cover, when was the last increase, and are there any pending special assessments or reserve-fund shortfalls?
- Why hasn't it sold? Are there any deal-killer items the seller is aware of (foundation, flood, title, zoning, code violations)?
- Is there a deadline driving the sale (1031 exchange, divorce, estate, relocation)? That informs how much negotiation room exists.
- Crime grade is F in this area — have there been break-ins, vandalism, or insurance claims at this property in the last 3 years? What carrier currently insures it and at what premium?
- The area grade is low — what's the realistic commute time and amenity access for the typical tenant pool here? Any planned neighborhood developments (good or bad) we should know about?
- What's the average days-on-market for RENTAL listings here right now (not sales)? A rising rental-DOM trend means longer vacancies and softer asking-rent achievability than the comps imply.
- What's the recent tenant-quality profile in this submarket — average credit score on applications, eviction rate, late-payment / NSF rate, and stable-employment percentage? A property-management company in the area should have these aggregated.
- How much new for-sale + rental construction is in the pipeline within 1–3 miles? Heavy new supply typically softens prices + rents 12–24 months out; constrained supply supports both.
Investment metrics
- 1% rule
- 0.76% ✗
- Cap rate
- 6.10%
- Cash-on-cash
- -0.70%
- DSCR
- 0.97
- GRM
- 11.0
CMA / ARV
- ARV (on-the-fly)
- $271,329
- Comps found
- 12
Show comp detail 12 sales within ~0.75 mi
| Address | Dist | Beds/Ba | Sqft | Sold | Price | $/sf | Match |
|---|---|---|---|---|---|---|---|
| 3582 Breckridge Cir | 0.16mi | 3/2.0 (-1) | 1,800 (-1%) | 9mo | $209,000 | $116 | 78 |
| 329 Spring Farm Rd | 0.24mi | 4/2.5 | 1,830 (+0%) | 11mo | $290,000 | $158 | 77 |
| 3828 Breckridge Cir | 0.55mi | 3/2.5 (-1) | 1,850 (+2%) | 2mo | $295,000 | $159 | 63 |
| 413 Pilchard Ct | 0.24mi | 3/2.0 (-1) | 1,670 (-8%) | 9mo | $270,000 | $162 | 62 |
| 421 Chomper Ct | 0.28mi | 3/2.0 (-1) | 1,911 (+5%) | 15mo | $245,000 | $128 | 61 |
| 3820 Brookfield Rd | 0.51mi | 3/1.0 (-1) | 1,804 (-1%) | 10mo | $200,000 | $111 | 58 |
| 420 Peatree Ct | 0.15mi | 3/2.0 (-1) | 1,592 (-13%) | 16mo | $147,500 | $93 | 54 |
| 180 Rigging Guard Way | 0.26mi | 3/2.0 (-1) | 1,560 (-14%) | 10mo | $266,000 | $171 | 50 |
| 3425 Mater Ln | 0.45mi | 3/2.0 (-1) | 1,640 (-10%) | 15mo | $245,000 | $149 | 45 |
| 3403 Shadow Birch Rd | 0.51mi | 3/2.0 (-1) | 1,582 (-13%) | 6mo | $235,000 | $149 | 44 |
| 273 E Thorncliff Rd | 0.51mi | 3/2.0 (-1) | 1,604 (-12%) | 10mo | $239,000 | $149 | 43 |
| 107 Branford Rd | 0.57mi | 3/3.0 (-1) | 2,072 (+14%) | 18mo | $315,000 | $152 | 27 |
Match score weights: distance 35% · size 25% · config 20% · recency 20%. Top-matched comps best support the ARV.
Projected returns pro-forma
-3.0% appreciation · 6.97% rent growth · sell at horizon
- IRR
- -13.6%
- Equity multiple
- 0.50×
- Total profit
- $-34,624
- Equity at exit
- $36,530
- IRR
- 0.1%
- Equity multiple
- 1.01×
- Total profit
- $510
- Equity at exit
- $21,183
Cash invested: $68,600 (down + closing). Projections, not guarantees.
Landlord ↔ Tenant lean methodology
- Overall (STATE)
- 90 Strongly Landlord-Friendly
- State South Carolina
- 90 Strongly Landlord-Friendly · R+6
- County
- — inherits STATE
- City
- — inherits STATE
ZIP-level market 29505
- Rents YoY
- 7.0%
- Active inventory
- 185
- Price-to-rent
- 11.0×
Monthly cashflow live
- Estimated rent
- $1,853 medium interval (Pro) →
- Mortgage (P&I)
- −$1,285
- Tax from tax record
- −$87 /mo · $1,041/yr
- Insurance
- −$102
- HOA
- −$30
- Vacancy / Maint / Mgmt
- −$389
- Net cashflow
- $-40
Break-even live
Sensitivity live
| Price | -10% $99 | -5% $30 | +0% $-40 | +5% $-109 | +10% $-178 |
|---|---|---|---|---|---|
| Rent | -10% $-186 | -5% $-113 | +0% $-40 | +5% $33 | +10% $107 |
| Rate | -1.0pp $84 | -0.5pp $23 | base $-40 | +0.5pp $-103 | +1.0pp $-168 |
UW: 25.0% down · 7.5% · 30yr · 1.5% tax · 5.0% vac · 8.0% maint · 8.0% mgmt
Financing live
Cash to close
- Down payment
- $61,250
- Closing costs
- $7,350
- Reserves months
- —
- Total cash needed
- —
Loan-product check · same deal, 3 products live
Conventional
25% down · 7.5% · 30yr
- Down + closing
- —
- Monthly P&I
- —
- Monthly cashflow
- —
- DSCR
- —
- Eligible?
- —
Personal DTI + credit; lowest rate.
DSCR
20% down · 8.5% · 30yr
- Down + closing
- —
- Monthly P&I
- —
- Monthly cashflow
- —
- DSCR
- —
- Eligible?
- —
No personal income docs; deal must DSCR.
Hard money
10% down · 12.0% · 12mo
- Down + closing
- —
- Monthly P&I
- —
- Monthly cashflow
- —
- DSCR
- —
- Eligible?
- —
Short-term bridge; refi at stabilization.
HOA detail
- Monthly dues
- $30 · $360/yr
- Likely covers
- gas
Listing history 21 events
-
2026-06-22statusdays on market $245,000 Active Under Contract 61 DOM
-
2026-06-19days on market $245,000 Active 59 DOM
-
2026-06-18days on market $245,000 Active 58 DOM
-
2026-06-17days on market $245,000 Active 57 DOM
-
2026-06-16days on market $245,000 Active 56 DOM
-
2026-06-15days on market $245,000 Active 55 DOM
-
2026-06-14days on market $245,000 Active 53 DOM
-
2026-06-13days on market $245,000 Active 52 DOM
-
2026-06-10days on market $245,000 Active 50 DOM
-
2026-06-09days on market $245,000 Active 49 DOM
-
2026-06-09price $245,000 Active 48 DOM
-
2026-06-08days on market $248,000 Active 48 DOM
-
2026-06-07days on market $248,000 Active 47 DOM
-
2026-06-05days on market $248,000 Active 44 DOM
-
2026-06-02days on market $248,000 Active 42 DOM
-
2026-06-01days on market $248,000 Active 41 DOM
-
2026-05-31days on market $248,000 Active 40 DOM
-
2026-05-30days on market $248,000 Active 39 DOM
-
2026-05-06price $248,000
-
2026-04-21$260,000 Active
-
2008-06-27soldstatus $179,900
ⓘ Source: listings_history table (triggers on properties + properties_extension) + one-shot
backfill from property_details.listing_events for pre-trigger history.
Tax reassessment forecast SC · Resets to sale price
- Current annual tax
- $1,041 · $87/mo
- Projected year-2 tax
- $1,396 · $116/mo
- Expected delta
- +$356/yr (+$30/mo · 34.2%)
ⓘ Screening estimate from a state-policy table — verify with the county assessor before closing.
Climate risk First Street
- Flood 1/10 Low FEMA zone X (unshaded) · 0% chance over 30 yrs
- Wildfire 5/10 Major
- Heat 7/10 Severe 7 d/yr ≥108°F today · 16 d/yr by 30 yrs out
- Wind 8/10 Severe 80% chance of damaging wind over 30 yrs
- Air quality 1/10 Low 0 unhealthy d/yr today · 0 by 30 yrs out
Nearby sold comps map
Loading sold comps map…
Walkable amenities ~0.75 mi
Loading nearby amenities…
Taxation est. · year 1
- Rental income
- $22,236
- − Mortgage interest
- −$13,724
- − Property taxes
- −$1,041
- − Insurance
- −$1,225
- − Repairs & maintenance
- −$1,779
- − Management
- −$1,779
- − HOA
- −$360
- − Depreciation
- −$7,127
- Taxable loss
- −$4,799
- Est. tax savings @ 24.0%
- +$1,152
- After-tax cash flow
- $675/yr
For passive investors: Depreciation is non-cash, so a rental often shows a tax loss while cash-flowing — sheltering income. Rental losses are passive: they offset passive income freely, and up to $25,000/yr can offset ordinary (W-2) income if you actively participate and your MAGI is under $100k (phasing out to $0 by $150k); unused losses carry forward. On sale, claimed depreciation is recaptured at up to 25%, and gains may owe capital-gains tax (a 1031 exchange can defer both). Figures are a year-1 estimate at your 24.0% rate — not tax advice; consult a CPA.
Schools (NCES district)
- District
- Florence 01
- NCES district ID
- 4502130
- Math proficiency
- 29% ▼ -10.00%
- Reading proficiency
- 47% ▬ 0.00%
- Median HH income
- $45,782
- Composite
- 32.36/100
- National rank
- #5737
- State rank
- #34 of 80 in SC
Livability — Florence
- Score
- 62/100
- State rank
- #196
- US rank
- #17076
Category grades
Schools grade is shown separately in the Schools card above.
Census & demographics
- Census place
- Florence, SC
- County
- Florence County · 93,345 people
- City population
- 93,345
- Metro
- Florence, SC
- Population (ZIP)
- 23,895
- Household income
- $67,343
- Rent vs Own
- Severe rent burden
- 559.0
Population outlook (Florence County) Hauer SSP2
- Today (2025)
- 141,714 people
- By 2030
- 142,121 · +0.3%
- By 2040
- 141,344 · -0.3%
- By 2050
- 139,478 · -1.6%
- By 2075
- 132,275 · -6.7%
- By 2100
- 118,374 · -16.5%
Race, ethnicity, and origin ACS 2023
- Neighborhood character
- Diverse neighborhood (Simpson 0.57)
- Race & ethnicity
- White 53% Black 38% Hispanic / Latino 5% Two or more races 3% Asian 1%
- Common ancestry
- Slovak 2% Lithuanian 1% Serbian 1%
- Foreign-born
- 3% · Canada, China
- Languages at home
- 96% English-only · Spanish 2% Other Indo-European 1%
Political lean MEDSL · Florence
- 2024 margin
- Lean R (+8.0) · D 45.3% · R 53.3% · Other 1.3%
- 2008→2024 swing
- -4.8pp toward R · 2008: -3.2pp · 2024: -8.0pp
- All cycles
- 2024: R+8.0 2020: R+2.3 2016: R+5.0 2012: R+0.5 2008: R+3.2
Not yet ingested
- Civics
- —
Market trends
- HPI YoY
- ▼ -138.13%
- Current HPI
- 177.9352
- Rent YoY
- ▲ 6.97%
- Metro
- Florence, SC
- State GDP YoY
- ▲ 4.51%
- F500 in state
- 2
Industry mix (Fortune 500 HQ in SC)
| Industry | F500 HQs | Revenue |
|---|---|---|
| Packaging | 1 | $7B |
|
||
Price history
+37.9% since first listed3 events — show timeline
- 2026-05-06 Price Changed $248,000 RAGPD
- 2026-04-21 Listed $260,000 RAGPD
- 2008-06-27 Sold (Public Records) $179,900 Public Records
Property tax history
+4.0%/yrLatest (2025): $1,041 · +22.9% YoY. Source: county tax records.
Cash-flow waterfall
monthlySold comps — $/sqft
last 12 mo · ≤1 miLoading sold comps…