 Duplex
260 5th St · Mamaroneck, NY
Flood risk 4/10 · Minor
- FEMA flood zone
- X (unshaded)
- Chance of flooding over 30 yrs
- 0.21%
- Est. flood insurance / yr
- $473 – $860
Fire risk 2/10 · Minimal
- Est. fire insurance / yr
- $691 – $1,283
Heat risk 6/10 · Moderate
- Hot days now (above 98°F)
- 7 days/yr
- Hot days in 30 yrs
- 16 days/yr
Wind risk 6/10 · Moderate
- Chance of severe wind over 30 yrs
- 27.0%
Air-quality risk 4/10 · Minor
- Unhealthy air days now
- 5 days/yr
- Unhealthy air days in 30 yrs
- 7 days/yr
Risk factors via First Street. Map © Google.
Why this score? — see what drove the C- grade
The composite is a weighted blend of 9 inputs, each scored 0–100. Each bar is that input's sub-score; the figure is the points it added to the 100-point composite (weight × sub-score).
- Cash flow +13.0/30.0
- ARV discount +11.3/15.0
- Schools +7.3/10.0
- 1% rule +4.7/10.0
- Rent growth +4.2/5.0
- DSCR +3.9/10.0
- Livability +3.5/5.0
- Condition / age +2.5/5.0
- Appreciation +0.0/10.0
$800,000
🖨 Deal sheet 📄 Offer letter ✓ Due diligence
Multi-family units
County records classify this as Multi-Family (2-4 Unit). Listing-text estimate: 2 units. confirmed
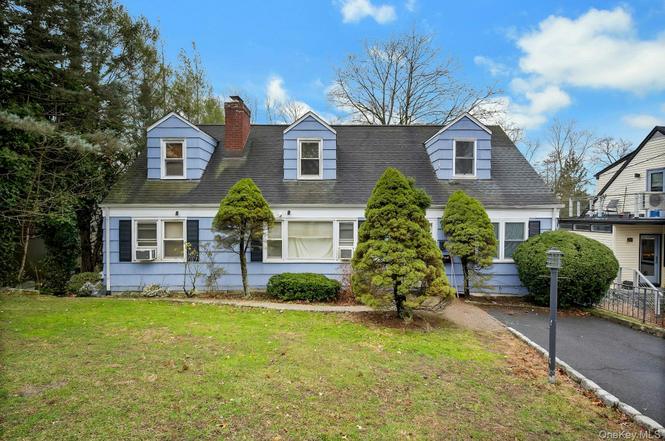
Listing remarks
Excellent opportunity to own a two-family home in the Rye Neck School District. Located on a quiet residential street, this home offers both comfortable living and strong investment potential. The first-floor unit features two bedrooms, an eat-in kitchen, and a versatile third room that can be used as an additional bedroom, dining room or home office, offering flexibility to suit a variety of living needs. The second-floor unit features a comfortable living room, kitchen, one bedroom, and an additional versatile room that can be used as a second bedroom, dining room, or home office, offering flexible living space. This home also features a spacious lower level offering both finished and unf
Key facts
- Second floor unit
- Eat in kitchen
- First floor unit
Tags
Neighborhood map
What this means for you Summary
Snapshot
- This is a 2 × 3-bed/2.0-bath units multifamily listed at $800k.
Deal economics
- At list price, monthly cash flow is $-40 ($-480/yr) — negative. Per door: $-20/mo.
- To cash-flow at today's rent, offer at most $793k (0.9% below list).
- To meet the 1% rule (rent ≥ 1% of price), the offer needs to be $773k (3.4% below list).
- Recommended offer: $773k (3.4% below list) — sets the bar for 1% rule.
- Cap rate 6.2% vs local median 3.1% in Mamaroneck — top-decile yield for the area; either an underpriced asset or a hidden risk that comps aren't pricing in. Stress-test before assuming the spread holds.
Location & tenants
- Location reads 69/100 on livability (#491 in NY) — a middle-class / working-renter tenant base. Strengths: crime A+, employment A+; Watch: amenities C-, commute F, cost of living F.
- Rye Neck Union Free School District (suburban): math 78% / reading 84% proficiency, ranked #40 of 590 in NY (top 7%) — strong family-tenant draw, lease renewals of 3-5y typical; only 10% free/reduced lunch — higher-income household profile.
- Zoned schools: Daniel Warren Elementary School (320 students, 12% FRL); Rye Neck Middle School (math 73% / reading 83%, grade A+, #37 of 729 statewide, top 5%, 351 students, 16% FRL); Rye Neck Senior High School (math 98% / reading 98%, grade A+, #19 of 1,100 statewide, top 4%, 515 students, 16% FRL).
- Market conditions: Rents rising fast (+6.7%/yr); 124 active listings in the ZIP; 23 comparable units currently listed for rent nearby; rentals at typical pace (median 19d on market — plan ~3-4 weeks tenant-placement turnaround); high-income renter base; 954 units permitted in Westchester County in 2024 (649 in 5+ unit buildings).
- At $7,729/mo this rent would consume 73% of the median local household income ($126k/yr) (locally 1152% of renters already pay >50% of income on rent) — very limited rent-growth headroom before tenants either downsize or default.
Forward outlook
- Local home prices are declining (-3.0%/yr); year-one equity from $6k of loan paydown is wiped out by about $24k of value loss. Plan a longer hold.
- Westchester County population projected at +10% by 2050 — modest demand growth; plan on rents tracking national, not racing it.
Negotiation context
- Only 13 days on market — expect competitive offers; lowballing is unlikely to land.
Risks & watch-outs
- Watch-outs: built in 1955 — expect roof / HVAC / electrical / plumbing capex.
- Climate carrying-cost: major wind risk, 27% chance of damaging wind over 30y; extreme-heat days projected 7→16/yr by 2055 (HVAC capex compounding) — expect insurance premiums to compound above CPI over the hold.
Questions for the listing agent
- What do current leases actually rent for vs. the listed asking? Can we see a recent rent roll and the last 12 months of T-12 income?
- Can we see the unit-by-unit rent roll, current vacancy, and any below-market leases? What's the average tenancy length?
- What capital expenditures (roof, boiler, parking lot, exteriors) have been made in the last 5 years, and what's planned in the next 2?
- Built in 1955 — when were the roof, HVAC, electrical panel, plumbing, and water heater last replaced?
- Is there a deadline driving the sale (1031 exchange, divorce, estate, relocation)? That informs how much negotiation room exists.
- Schools are B-rated — typically a magnet for longer-tenancy family renters. What's the average tenant stay here, and is there a school-zone premium baked into asking?
- What's the average days-on-market for RENTAL listings here right now (not sales)? A rising rental-DOM trend means longer vacancies and softer asking-rent achievability than the comps imply.
- What's the recent tenant-quality profile in this submarket — average credit score on applications, eviction rate, late-payment / NSF rate, and stable-employment percentage? A property-management company in the area should have these aggregated.
- How much new apartment / multifamily construction is in the pipeline within 1–3 miles? Heavy new supply (>2% of stock underway) typically softens rents 12–24 months out; light construction supports rent growth.
Investment metrics
- 1% rule
- 0.97% ✗
- Cap rate
- 6.23%
- Cash-on-cash
- -0.21%
- DSCR
- 0.99
- GRM
- 8.6
CMA / ARV
- ARV (on-the-fly)
- $874,780
- Comps found
- 6
Show comp detail 6 sales within ~0.75 mi
| Address | Dist | Beds/Ba | Sqft | Sold | Price | $/sf | Match |
|---|---|---|---|---|---|---|---|
| 1306 Henry Ave | 0.09mi | 4/3.0 (+1) | 1,994 (+4%) | 11mo | $923,000 | $463 | 70 |
| 1408 Henry Ave | 0.12mi | 4/3.0 (+1) | 1,752 (-8%) | 3mo | $999,000 | $570 | 69 |
| 606 Lorraine St | 0.41mi | 3/2.0 | 1,924 (+1%) | 17mo | $750,000 | $390 | 66 |
| 512 5th St | 0.24mi | 4/2.0 (+1) | 2,144 (+12%) | 4mo | $965,000 | $450 | 60 |
| 53 Henry Ave | 0.34mi | 4/2.0 (+1) | 2,020 (+6%) | 18mo | $925,000 | $458 | 55 |
| 621 2nd St | 0.56mi | 3/2.0 | 2,060 (+8%) | 10mo | $865,000 | $420 | 52 |
Match score weights: distance 35% · size 25% · config 20% · recency 20%. Top-matched comps best support the ARV.
Projected returns pro-forma
-3.0% appreciation · 6.7% rent growth · sell at horizon
- IRR
- -12.1%
- Equity multiple
- 0.55×
- Total profit
- $-101,845
- Equity at exit
- $119,283
- IRR
- 2.2%
- Equity multiple
- 1.19×
- Total profit
- $42,206
- Equity at exit
- $69,169
Cash invested: $224,000 (down + closing). Projections, not guarantees.
Landlord ↔ Tenant lean methodology
- Overall (STATE)
- 15 Strongly Tenant-Friendly
- State New York
- 15 Strongly Tenant-Friendly · D+10
- County
- — inherits STATE
- City
- — inherits STATE
ZIP-level market 10543
- Rents YoY
- 6.7%
- Active inventory
- 124
- Price-to-rent
- 17.3×
Monthly cashflow live
- Estimated rent
- $7,729 high interval (Pro) →
- Mortgage (P&I)
- −$4,195
- Tax from tax record
- −$1,617 /mo · $19,408/yr
- Insurance
- −$333
- HOA
- −$0
- Vacancy / Maint / Mgmt
- −$1,623
- Net cashflow
- $-40
Break-even live
2-unit breakdown (identical units grouped — click to expand)
| Units | Beds | Baths | Est. rent |
|---|---|---|---|
| 2× units | 3 | 2 | $7,728 |
| #1 | 3 | 2 | $3,864 |
| #2 | 3 | 2 | $3,864 |
| Total (2 units) | $7,729 | ||
UW: 25.0% down · 7.5% · 30yr · 1.5% tax · 5.0% vac · 8.0% maint · 8.0% mgmt
Financing live
Cash to close
- Down payment
- $200,000
- Closing costs
- $24,000
- Reserves months
- —
- Total cash needed
- —
Loan-product check · same deal, 3 products live
Conventional
25% down · 7.5% · 30yr
- Down + closing
- —
- Monthly P&I
- —
- Monthly cashflow
- —
- DSCR
- —
- Eligible?
- —
Personal DTI + credit; lowest rate.
DSCR
20% down · 8.5% · 30yr
- Down + closing
- —
- Monthly P&I
- —
- Monthly cashflow
- —
- DSCR
- —
- Eligible?
- —
No personal income docs; deal must DSCR.
Hard money
10% down · 12.0% · 12mo
- Down + closing
- —
- Monthly P&I
- —
- Monthly cashflow
- —
- DSCR
- —
- Eligible?
- —
Short-term bridge; refi at stabilization.
Rent comps 23 comps
| Address | Beds | Baths | Sqft | Rent | $/sqft | DOM | Units | Dist |
|---|---|---|---|---|---|---|---|---|
| 1408 Henry Ave #2 Mamaroneck, NY | 3.0 | 1.5 | 1400 | $4,200 | $3.00 | 43d | 1 | 0.13mi |
| 29 Fremont St Unit B Harrison, NY | 3.0 | 2.0 | 1330 | $4,500 | $3.38 | 43d | 1 | 0.29mi |
| 94 Thatcher Ave Harrison, NY | 4.0 | 3.5 | 2600 | $8,250 | $3.17 | 1d | 1 | 0.29mi |
| 14 Fremont St Unit 1 Harrison, NY | 3.0 | 2.0 | 1500 | $4,300 | $2.87 | 7d | 1 | 0.29mi |
| 1035 Shore Acres Dr Mamaroneck, NY | 4.0 | 3.0 | 1988 | $9,900 | $4.98 | 1d | 1 | 0.37mi |
| 1016 Jefferson Ave Mamaroneck, NY | 3.0 | 1.5 | 1300 | $4,200 | $3.23 | 18d | 1 | 0.38mi |
| 317 Hornidge Rd Mamaroneck, NY | 4.0 | 2.0 | 1600 | $5,500 | $3.44 | 16d | 1 | 0.39mi |
| 132 Halstead Ave Unit 4D Harrison, NY | 3.0 | 2.5 | 1329 | $6,850 | $5.15 | 43d | 1 | 0.54mi |
| 621 2nd St Mamaroneck, NY | 2.0 | 1.0 | 2060 | $3,000 | $1.46 | 44d | 1 | 0.57mi |
| 69 Oak St Unit B Harrison, NY | 3.0 | 3.5 | 2100 | $7,000 | $3.33 | 1d | 1 | 0.59mi |
| 658 Shore Acres Dr Mamaroneck, NY | 3.0 | 3.5 | 2062 | $18,000 | $8.73 | 1d | 1 | 0.66mi |
| 8 Marion Ave #6 Harrison, NY | 3.0 | 2.5 | 1420 | $6,400 | $4.51 | 4d | 1 | 0.70mi |
| 8 Davenport St Harrison, NY | 3.0 | 2.0 | 1700 | $5,000 | $2.94 | 2d | 1 | 0.73mi |
| 209 Halstead Ave Unit 3 Mamaroneck, NY | 3.0 | 1.0 | 1500 | $3,975 | $2.65 | 43d | 1 | 0.74mi |
| 135 Webster Ave Harrison, NY | 3.0 | 1.0 | 1500 | $3,300 | $2.20 | 18d | 1 | 0.90mi |
| 52 Nelson Ave Unit 2 Harrison, NY | 3.0 | 1.5 | 1450 | $4,000 | $2.76 | 18d | 1 | 0.98mi |
| 140 Rockwell St Unit A Harrison, NY | 3.0 | 2.5 | 1850 | $7,000 | $3.78 | 4d | 1 | 1.02mi |
| 69 Ellsworth Ave Harrison, NY | 3.0 | 2.5 | 2000 | $6,500 | $3.25 | 43d | 1 | 1.02mi |
| 332 Halstead Ave Harrison, NY | 1.0–3.0 | 1.0–3.0 | 1116 | $6,805 | $6.09 | 1d | 1 | 1.04mi |
| 505 Prospect Ave Mamaroneck, NY | 3.0 | 1.5 | 1500 | $6,700 | $4.47 | 13d | 1 | 1.13mi |
| 530 West St Harrison, NY | 4.0 | 2.5 | 2331 | $6,000 | $2.57 | 43d | 1 | 1.23mi |
| 89 Crystal St Harrison, NY | 3.0 | 2.5 | 1700 | $8,250 | $4.85 | 18d | 1 | 1.27mi |
| 87 Crystal St Harrison, NY | 3.0 | 2.5 | 1700 | $8,250 | $4.85 | 18d | 1 | 1.27mi |
Listing history 2 events
-
2026-04-03status Pending
-
2026-03-12$800,000 Active
ⓘ Source: listings_history table (triggers on properties + properties_extension) + one-shot
backfill from property_details.listing_events for pre-trigger history.
Tax reassessment forecast NY · Partial reset (capped growth)
- Current annual tax
- $19,408 · $1,617/mo
- Projected year-2 tax
- $19,408 · $1,617/mo
- Expected delta
- $0/yr ($0/mo · 0.0%)
ⓘ Screening estimate from a state-policy table — verify with the county assessor before closing.
Climate risk First Street
- Flood 4/10 Moderate FEMA zone X (unshaded) · 21% chance over 30 yrs
- Wildfire 2/10 Low
- Heat 6/10 Major 7 d/yr ≥98°F today · 16 d/yr by 30 yrs out
- Wind 6/10 Major 27% chance of damaging wind over 30 yrs
- Air quality 4/10 Moderate 5 unhealthy d/yr today · 7 by 30 yrs out
Nearby sold comps map
Loading sold comps map…
Walkable amenities ~0.75 mi
Loading nearby amenities…
Taxation est. · year 1
- Rental income
- $92,748
- − Mortgage interest
- −$44,812
- − Property taxes
- −$19,408
- − Insurance
- −$4,000
- − Repairs & maintenance
- −$7,420
- − Management
- −$7,420
- − Depreciation
- −$23,273
- Taxable loss
- −$13,584
- Est. tax savings @ 24.0%
- +$3,260
- After-tax cash flow
- $2,780/yr
For passive investors: Depreciation is non-cash, so a rental often shows a tax loss while cash-flowing — sheltering income. Rental losses are passive: they offset passive income freely, and up to $25,000/yr can offset ordinary (W-2) income if you actively participate and your MAGI is under $100k (phasing out to $0 by $150k); unused losses carry forward. On sale, claimed depreciation is recaptured at up to 25%, and gains may owe capital-gains tax (a 1031 exchange can defer both). Figures are a year-1 estimate at your 24.0% rate — not tax advice; consult a CPA.
Schools (NCES district)
- District
- Rye Neck Union Free School District
- NCES district ID
- 3625290
- Math proficiency
- 78% ▬ 0.00%
- Reading proficiency
- 84% ▲ 12.00%
- Median HH income
- $99,235
- Composite
- 73.17/100
- National rank
- #188
- State rank
- #40 of 590 in NY
Livability — Mamaroneck
- Score
- 69/100
- State rank
- #491
- US rank
- #8656
Category grades
Schools grade is shown separately in the Schools card above.
Census & demographics
- Census place
- Mamaroneck, NY
- County
- Westchester County · 709,332 people
- City population
- 20,989
- Metro
- New York-Newark-Jersey City, NY-NJ-PA
- Population (ZIP)
- 20,989
- Household income
- $126,417
- Rent vs Own
- Severe rent burden
- 1152.0
Population outlook (Westchester County) Hauer SSP2
- Today (2025)
- 1,028,035 people
- By 2030
- 1,051,636 · +2.3%
- By 2040
- 1,098,520 · +6.9%
- By 2050
- 1,136,044 · +10.5%
- By 2075
- 1,196,925 · +16.4%
- By 2100
- 1,175,147 · +14.3%
Race, ethnicity, and origin ACS 2023
- Neighborhood character
- Diverse neighborhood (Simpson 0.57)
- Race & ethnicity
- White 59% Hispanic / Latino 27% Two or more races 11% Asian 5% Black 4% Native American 1%
- Hispanic origin (detail)
- Mexican 5% Puerto Rican 4% Dominican 2%
- Common ancestry
- Russian 3% Romanian 2% Scotch-Irish 2%
- Foreign-born
- 28% · Canada, Jamaica, China
- Languages at home
- 60% English-only · Spanish 23% Other Indo-European 8% Other Asian/Pacific 2%
Political lean MEDSL · Westchester
- 2024 margin
- Strong D (+26.3) · D 63.1% · R 36.9%
- 2008→2024 swing
- -1.3pp toward R · 2008: 27.6pp · 2024: 26.3pp
- All cycles
- 2024: D+26.3 2020: D+36.3 2016: D+32.8 2012: D+22.2 2008: D+27.6
Not yet ingested
- Civics
- —
Market trends
- HPI YoY
- ▼ -220.53%
- Current HPI
- 268.4687
- Rent YoY
- ▲ 6.70%
- Metro
- New York-Newark-Jersey City, NY-NJ-PA
- State GDP YoY
- ▲ 2.60%
- F500 in state
- 92
Industry mix (Fortune 500 HQ in NY)
| Industry | F500 HQs | Revenue |
|---|---|---|
| Financial Services | 10 | $950B |
|
||
| Consumer Goods | 9 | $162B |
|
||
| Insurance | 4 | $225B |
|
||
| Telecommunications | 2 | $144B |
|
||
| Pharmaceuticals | 2 | $112B |
|
||
| Media / Entertainment | 2 | $69B |
|
||
Price history
2 events — show timeline
- 2026-04-03 Pending — OneKey® MLS as Distributed by MLS Grid
- 2026-03-12 Listed $800,000 OneKey® MLS as Distributed by MLS Grid
Property tax history
+5.6%/yrLatest (2025): $19,408 · +2.6% YoY. Source: county tax records.
Cash-flow waterfall
monthlySold comps — $/sqft
last 12 mo · ≤1 miLoading sold comps…