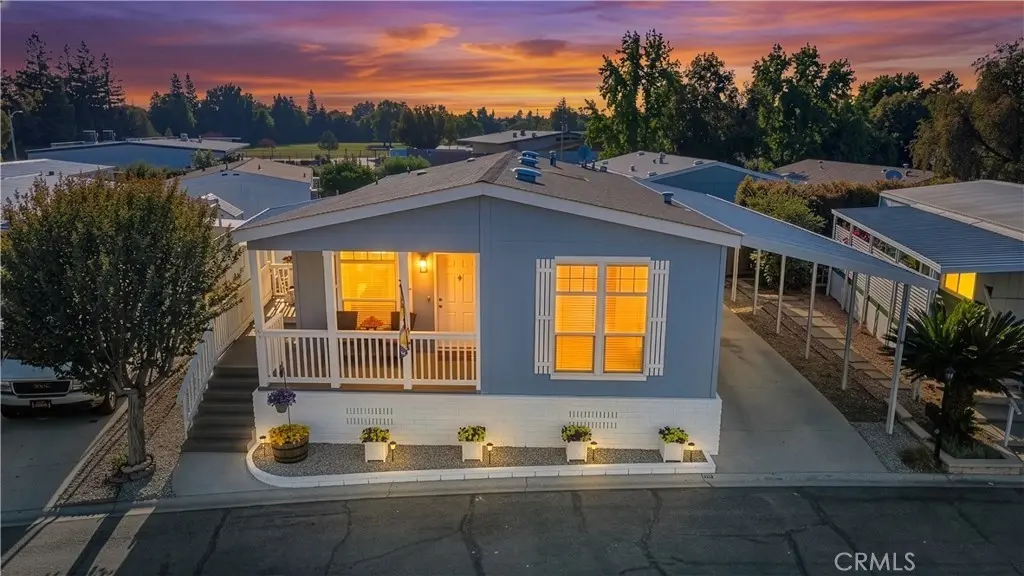
6480 Katherine #63 · Simi Valley, CA
Flood risk 5/10 · Moderate
- FEMA flood zone
- X (unshaded)
- Chance of flooding over 30 yrs
- 0.67%
- Est. flood insurance / yr
- $507 – $1,088
Fire risk 7/10 · Major
- Est. fire insurance / yr
- $659 – $1,223
Heat risk 5/10 · Moderate
- Hot days now (above 101°F)
- 8 days/yr
- Hot days in 30 yrs
- 21 days/yr
Wind risk 1/10 · Minimal
- Chance of severe wind over 30 yrs
- —
Air-quality risk 3/10 · Minor
- Unhealthy air days now
- 4 days/yr
- Unhealthy air days in 30 yrs
- 4 days/yr
Risk factors via First Street. Map © Google.
Why this score? — see what drove the C+ grade
The composite is a weighted blend of 9 inputs, each scored 0–100. Each bar is that input's sub-score; the figure is the points it added to the 100-point composite (weight × sub-score).
- Cash flow +25.7/30.0
- DSCR +8.6/10.0
- ARV discount +7.5/15.0
- 1% rule +5.5/10.0
- Schools +4.0/10.0
- Rent growth +3.8/5.0
- Livability +3.2/5.0
- Condition / age +2.5/5.0
- Appreciation +0.0/10.0
$393,000
🖨 Deal sheet (PDF) 📄 Offer letter ✓ Due diligence
Listing remarks MLS
This home is located in beautiful east Simi Valley. Features include a clean kitchen, dining room, built-in china cabinet, family room, 2 bedrooms, sun room, porch, and mountain views. Washer, dryer and refrigerator included!
Key facts
- Designer kitchen
- Manufactured homes
- Custom upgrades
Tags
Property features AI
Finance
- Other: One shed on property; Lot features: 0-1 unit/acre
- Financial info: Rent includes pool
- HOA & community: Land lease (park) with monthly amount; Park name: Santa Susana Woods; Community features include gutters, biking, hiking, foothills; Manager approval required
Exterior
- Parking: 2-car garage; 3-car carport; Covered parking; Concrete driveway; Off-street parking (total 5 parking spaces)
- Security: Carbon monoxide detector(s); Smoke detector(s)
- Utilities: Public sewer; District/public water; Natural gas connected; Electricity connected; Sewer connected; Water connected; Cable available
- Home design: Single-story mobile home; Mobile home model L-4593PSP (27' x 59'); North-facing; Turnkey condition; Entry at front door
- Construction: Lap siding; Combination foundation; Combination skirt; Year built per public records
- Exterior features: Covered wrap-around deck/porch; Deck; Covered patio; Community pool (fenced); Shed; No fencing; View
Interior
- Kitchen: Formica counters
- Bedrooms: One-level home
- Flooring: Laminated flooring
- Bathrooms: 2 full bathrooms
- Heating & cooling: Central heating (furnace); Central cooling; Energy Star heating and cooling features
- Interior features: Crown moldings; High ceilings (9 feet+); Living room deck attached; Recessed lighting; Open floor plan; Formica counters; Energy Star doors; Double pane, Energy Star windows; Carbon monoxide and smoke detectors; In-ground community spa
- Laundry & utility: Dedicated laundry room
Neighborhood map
What this means for you Summary
Snapshot
- This is a 3-bed/2.0-bath manufactured listed at $393k.
Deal economics
- At list price, monthly cash flow is $944 ($11k/yr) — positive.
- The deal already cash-flows at list — no discount required.
- Meets the 1% rule at list price ($4k rent vs $393k).
- Recommended offer: $381k (3.0% below list) — sets the bar for market timing.
- Cap rate 9.2% vs local median 3.0% in Simi Valley — top-decile yield for the area; either an underpriced asset or a hidden risk that comps aren't pricing in. Stress-test before assuming the spread holds.
Location & tenants
- Location reads 63/100 on livability (#456 in CA) — a middle-class / working-renter tenant base. Strengths: crime A+, employment A+, housing B; Watch: amenities F, commute D-, cost of living F.
- Simi Valley Unified (suburban): math 36% / reading 49% proficiency, ranked #170 of 517 in CA (top 33%) — families likely to look elsewhere, expect single-tenant / working-renter base with shorter leases.
- Zoned schools: Hollow Hills Elementary (math 54% / reading 68%, grade B, #222 of 1,571 statewide, top 14%, 637 students, 38% FRL); Valley View Middle (math 32% / reading 48%, grade F, #152 of 498 statewide, top 31%, 1,140 students, 39% FRL); Simi Valley High (math 38% / reading 57%, grade D, #384 of 1,170 statewide, top 33%, 1,935 students, 33% FRL).
- Market conditions: Rents rising fast (+5.2%/yr); 157 active listings in the ZIP; 15 comparable units currently listed for rent nearby; rentals at typical pace (median 25d on market — plan ~3-4 weeks tenant-placement turnaround); high-income renter base; 1,759 units permitted in Ventura County in 2024 (1,196 in 5+ unit buildings).
- This rent runs 39% of the median local income ($125k/yr) — at the standard rent-burdened threshold; future hikes will face affordability resistance.
Forward outlook
- Local home prices are declining (-3.0%/yr); year-one equity from $3k of loan paydown is wiped out by about $12k of value loss. Plan a longer hold.
- Ventura County population projected at +4% by 2050 — modest demand growth; plan on rents tracking national, not racing it.
- At projected returns (-3.0% appreciation + 5.2% rent growth), your $110k cash investment doubles in ~9 years — after that, you're playing with house money.
Negotiation context
- It's been on market 40 days — a 3% lower offer ($381k) is reasonable based on typical stale-listing flexibility.
- 3 sale attempts since 16y ago with the ask held roughly flat each time — persistent listings suggest the price (not the market) is what's stuck; bring a comps-based counter.
- Current owner paid $26k; list at $393k implies a 1412% gain — meaningful room to come down on a strong offer.
Risks & watch-outs
- Climate carrying-cost: moderate flood risk; major wildfire risk; extreme-heat days projected 8→21/yr by 2055 (HVAC capex compounding) — expect insurance premiums to compound above CPI over the hold.
Questions for the listing agent
- It's been on market 40 days. Have you received any prior offers? Is the seller open to a 3% concession, seller financing, or rate buy-down credit?
- Is there a deadline driving the sale (1031 exchange, divorce, estate, relocation)? That informs how much negotiation room exists.
- What's the average days-on-market for RENTAL listings here right now (not sales)? A rising rental-DOM trend means longer vacancies and softer asking-rent achievability than the comps imply.
- What's the recent tenant-quality profile in this submarket — average credit score on applications, eviction rate, late-payment / NSF rate, and stable-employment percentage? A property-management company in the area should have these aggregated.
- How much new for-sale + rental construction is in the pipeline within 1–3 miles? Heavy new supply typically softens prices + rents 12–24 months out; constrained supply supports both.
Investment metrics
- 1% rule
- 1.05% ✓
- Cap rate
- 9.18%
- Cash-on-cash
- 10.30%
- DSCR
- 1.46
- GRM
- 8.0
CMA / ARV
- ARV (median comp)
- $175,000
- List price
- $393,000
- Delta
- 124.57%
- Verdict
- OVERPRICED
- Comps
- 6 within 1.0 mi
Show comp detail 5 sales within ~0.75 mi
| Address | Dist | Beds/Ba | Sqft | Sold | Price | $/sf | Match |
|---|---|---|---|---|---|---|---|
| 6480 Katherine Rd #79 | 0.07mi | 3/2.0 | 1,440 (-10%) | 3mo | $170,000 | $118 | 78 |
| 6480 Katherine St #109 | 0.09mi | 3/2.0 | 1,440 (-10%) | 6mo | $180,000 | $125 | 75 |
| 1550 Rory Ln #266 | 0.52mi | 3/2.0 | 1,560 (-2%) | 13mo | $275,000 | $176 | 62 |
| 6480 Katherine Rd #135 | 0.15mi | 2/2.0 (-1) | 1,440 (-10%) | 13mo | $183,000 | $127 | 61 |
| 1550 Rory #197 | 0.62mi | 4/2.0 (+1) | 1,500 (-6%) | 23mo | $260,000 | $173 | 37 |
Match score weights: distance 35% · size 25% · config 20% · recency 20%. Top-matched comps best support the ARV.
Projected returns pro-forma
-3.0% appreciation · 5.22% rent growth · sell at horizon
- IRR
- 1.3%
- Equity multiple
- 1.05×
- Total profit
- $5,677
- Equity at exit
- $58,598
- IRR
- 12.8%
- Equity multiple
- 2.11×
- Total profit
- $121,999
- Equity at exit
- $33,979
Cash invested: $110,040 (down + closing). Projections, not guarantees.
Landlord ↔ Tenant lean methodology
- Overall (STATE)
- 18 Strongly Tenant-Friendly
- State California
- 18 Strongly Tenant-Friendly · D+13
- County
- — inherits STATE
- City
- — inherits STATE
ZIP-level market 93063
- Rents YoY
- 5.2%
- Active inventory
- 157
- Price-to-rent
- 8.0×
Monthly cashflow live
- Estimated rent
- $4,118 high interval (Pro) →
- Mortgage (P&I)
- −$2,061
- Tax from tax record
- −$84 /mo · $1,007/yr
- Insurance
- −$164
- HOA
- −$0
- Vacancy / Maint / Mgmt
- −$865
- Net cashflow
- $944
Break-even live
Sensitivity live
| Price | -10% $1,167 | -5% $1,056 | +0% $944 | +5% $833 | +10% $722 |
|---|---|---|---|---|---|
| Rent | -10% $619 | -5% $782 | +0% $944 | +5% $1,107 | +10% $1,270 |
| Rate | -1.0pp $1,142 | -0.5pp $1,044 | base $944 | +0.5pp $843 | +1.0pp $739 |
UW: 25.0% down · 7.5% · 30yr · 1.5% tax · 5.0% vac · 8.0% maint · 8.0% mgmt
Financing live
Cash to close
- Down payment
- $98,250
- Closing costs
- $11,790
- Reserves months
- —
- Total cash needed
- —
Loan-product check · same deal, 3 products live
Conventional
25% down · 7.5% · 30yr
- Down + closing
- —
- Monthly P&I
- —
- Monthly cashflow
- —
- DSCR
- —
- Eligible?
- —
Personal DTI + credit; lowest rate.
DSCR
20% down · 8.5% · 30yr
- Down + closing
- —
- Monthly P&I
- —
- Monthly cashflow
- —
- DSCR
- —
- Eligible?
- —
No personal income docs; deal must DSCR.
Hard money
10% down · 12.0% · 12mo
- Down + closing
- —
- Monthly P&I
- —
- Monthly cashflow
- —
- DSCR
- —
- Eligible?
- —
Short-term bridge; refi at stabilization.
Rent comps 15 comps
| Address | Beds | Baths | Sqft | Rent | $/sqft | DOM | Units | Dist |
|---|---|---|---|---|---|---|---|---|
| 911 Katherine Rd Simi Valley, CA | 3.0 | 2.0 | 1501 | $4,350 | $2.90 | 45d | 1 | 0.19mi |
| 990 Alta Vista Rd Simi Valley, CA | 3.0 | 3.5 | 1880 | $5,200 | $2.77 | 45d | 1 | 0.44mi |
| 6769 Cowboy St Simi Valley, CA | 3.0 | 2.5 | 1659 | $4,300 | $2.59 | 25d | 1 | 0.52mi |
| 6769 Cowboy St Simi Valley, CA | 3.0 | 3.0 | 1659 | $4,300 | $2.59 | 5d | 1 | 0.52mi |
| 5960 Juniper Ct Simi Valley, CA | 3.0 | 2.5 | 1602 | $3,700 | $2.31 | 16d | 1 | 0.65mi |
| 1830 Rory Ln Simi Valley, CA | 2.0 | 2.5 | 1437 | $3,288 | $2.29 | 45d | 1 | 0.65mi |
| 1948 Rory Ln #4 Simi Valley, CA | 3.0 | 2.5 | 1583 | $3,900 | $2.46 | 25d | 1 | 0.67mi |
| 1930 Yosemite Ave Simi Valley, CA | 1.0–3.0 | 1.0–2.0 | 850 | $2,915 | $3.43 | 3d | 1 | 0.78mi |
| 1700 Yosemite Ave Simi Valley, CA | 1.0–3.0 | 1.0–2.0 | 850 | $2,915 | $3.43 | 3d | 3 | 0.80mi |
| 5676 Bloomfield St Simi Valley, CA | 4.0 | 2.0 | 1380 | $8,500 | $6.16 | 0d | 1 | 1.00mi |
| 5664 Bloomfield St Simi Valley, CA | 4.0 | 2.0 | 1800 | $9,998 | $5.55 | 0d | 1 | 1.00mi |
| 2163 Timberlane Ave Simi Valley, CA | 4.0 | 2.0 | 1826 | $4,300 | $2.35 | 23d | 1 | 1.15mi |
| 1768 Grover Cir Simi Valley, CA | 3.0 | 3.0 | 1982 | $3,995 | $2.02 | 25d | 1 | 1.18mi |
| 5727 Cochran St Simi Valley, CA | 4.0 | 3.0 | 1976 | $4,200 | $2.13 | 45d | 1 | 1.39mi |
| 5312 Diane St Simi Valley, CA | 4.0 | 2.0 | 1812 | $4,500 | $2.48 | 45d | 1 | 1.42mi |
Listing history 22 events
-
2026-06-21days on market $393,000 Active 40 DOM
-
2026-06-18days on market $393,000 Active 37 DOM
-
2026-06-17days on market $393,000 Active 36 DOM
-
2026-06-16days on market $393,000 Active 35 DOM
-
2026-06-15days on market $393,000 Active 34 DOM
-
2026-06-13days on market $393,000 Active 32 DOM
-
2026-06-13days on market $393,000 Active 31 DOM
-
2026-06-10days on market $393,000 Active 29 DOM
-
2026-06-09days on market $393,000 Active 28 DOM
-
2026-06-08pricedays on market $393,000 Active 27 DOM
-
2026-06-07days on market $399,000 Active 26 DOM
-
2026-06-05days on market $399,000 Active 23 DOM
-
2026-06-03days on market $399,000 Active 22 DOM
-
2026-06-02days on market $399,000 Active 21 DOM
-
2026-06-01days on market $399,000 Active 20 DOM
-
2026-05-31days on market $399,000 Active 19 DOM
-
2026-05-12$399,000 Active 2519-char remark
-
2010-09-24soldstatus $26,000 Closed 271-char remark
Show marketing remark (225 chars)
This home is located in beautiful east Simi Valley. Features include a clean kitchen, dining room, built-in china cabinet, family room, 2 bedrooms, sun room, porch, and mountain views. Washer, dryer and refrigerator included!
-
2010-09-24soldstatus $26,000 271-char remark
Show marketing remark (225 chars)
This home is located in beautiful east Simi Valley. Features include a clean kitchen, dining room, built-in china cabinet, family room, 2 bedrooms, sun room, porch, and mountain views. Washer, dryer and refrigerator included!
-
2010-08-27historical 271-char remark
Show marketing remark (225 chars)
This home is located in beautiful east Simi Valley. Features include a clean kitchen, dining room, built-in china cabinet, family room, 2 bedrooms, sun room, porch, and mountain views. Washer, dryer and refrigerator included!
-
2010-08-10$34,500 Active 271-char remark
Show marketing remark (225 chars)
This home is located in beautiful east Simi Valley. Features include a clean kitchen, dining room, built-in china cabinet, family room, 2 bedrooms, sun room, porch, and mountain views. Washer, dryer and refrigerator included!
-
2010-07-21$34,500 271-char remark
Show marketing remark (225 chars)
This home is located in beautiful east Simi Valley. Features include a clean kitchen, dining room, built-in china cabinet, family room, 2 bedrooms, sun room, porch, and mountain views. Washer, dryer and refrigerator included!
ⓘ Source: listings_history table (triggers on properties + properties_extension) + one-shot
backfill from property_details.listing_events for pre-trigger history.
Tax reassessment forecast CA · Resets to sale price
- Current annual tax
- $1,007 · $84/mo
- Projected year-2 tax
- $2,987 · $249/mo
- Expected delta
- +$1,980/yr (+$165/mo · 196.6%)
ⓘ Screening estimate from a state-policy table — verify with the county assessor before closing.
Climate risk First Street
- Flood 5/10 Major FEMA zone X (unshaded) · 67% chance over 30 yrs
- Wildfire 7/10 Severe
- Heat 5/10 Major 8 d/yr ≥101°F today · 21 d/yr by 30 yrs out
- Wind 1/10 Low
- Air quality 3/10 Moderate 4 unhealthy d/yr today · 4 by 30 yrs out
Nearby sold comps map
Loading sold comps map…
Walkable amenities ~0.75 mi
Loading nearby amenities…
Taxation est. · year 1
- Rental income
- $49,412
- − Mortgage interest
- −$22,014
- − Property taxes
- −$1,007
- − Insurance
- −$1,965
- − Repairs & maintenance
- −$3,953
- − Management
- −$3,953
- − Depreciation
- −$11,433
- Taxable income
- $5,087
- Est. tax owed @ 24.0%
- −$1,221
- After-tax cash flow
- $10,111/yr
For passive investors: Depreciation is non-cash, so a rental often shows a tax loss while cash-flowing — sheltering income. Rental losses are passive: they offset passive income freely, and up to $25,000/yr can offset ordinary (W-2) income if you actively participate and your MAGI is under $100k (phasing out to $0 by $150k); unused losses carry forward. On sale, claimed depreciation is recaptured at up to 25%, and gains may owe capital-gains tax (a 1031 exchange can defer both). Figures are a year-1 estimate at your 24.0% rate — not tax advice; consult a CPA.
Schools (NCES district)
- District
- Simi Valley Unified
- NCES district ID
- 0636840
- Math proficiency
- 36% ▼ -7.00%
- Reading proficiency
- 49% ▼ -5.00%
- Median HH income
- $88,818
- Composite
- 40.23/100
- National rank
- #3773
- State rank
- #170 of 517 in CA
Livability — Simi Valley
- Score
- 63/100
- State rank
- #456
- US rank
- #15494
Category grades
Schools grade is shown separately in the Schools card above.
Census & demographics
- Census place
- Simi Valley, CA
- County
- Ventura County · 829,955 people
- City population
- 128,600
- Metro
- Oxnard-Thousand Oaks-Ventura, CA
- Population (ZIP)
- 55,066
- Household income
- $125,098
- Rent vs Own
- Severe rent burden
- 1322.0
Population outlook (Ventura County) Hauer SSP2
- Today (2025)
- 895,754 people
- By 2030
- 912,134 · +1.8%
- By 2040
- 931,454 · +4.0%
- By 2050
- 934,609 · +4.3%
- By 2075
- 924,899 · +3.3%
- By 2100
- 864,712 · -3.5%
Race, ethnicity, and origin ACS 2023
- Neighborhood character
- Diverse neighborhood (Simpson 0.62)
- Race & ethnicity
- White 55% Hispanic / Latino 25% Two or more races 15% Asian 11% Black 2%
- Hispanic origin (detail)
- Mexican 17% Cuban 1%
- Common ancestry
- Italian 5% Lithuanian 2% Slovak 2%
- Foreign-born
- 18% · Canada, China, Vietnam
- Languages at home
- 75% English-only · Spanish 14% Other Indo-European 4% Tagalog/Filipino 2%
Political lean MEDSL · Ventura
- 2024 margin
- D (+15.1) · D 56.1% · R 41.0% · Other 2.9%
- 2008→2024 swing
- +2.8pp toward D · 2008: 12.3pp · 2024: 15.1pp
- All cycles
- 2024: D+15.1 2020: D+21.1 2016: D+16.8 2012: D+5.3 2008: D+12.3
Not yet ingested
- Civics
- —
Market trends
- HPI YoY
- ▼ -910.70%
- Current HPI
- 297.7444
- Rent YoY
- ▲ 5.22%
- Metro
- Oxnard-Thousand Oaks-Ventura, CA
- State GDP YoY
- ▲ 3.21%
- F500 in state
- 116
Industry mix (Fortune 500 HQ in CA)
| Industry | F500 HQs | Revenue |
|---|---|---|
| Technology | 27 | $1,492B |
|
||
| Financial Services | 3 | $174B |
|
||
| Retail | 3 | $44B |
|
||
| Insurance | 3 | $26B |
|
||
| Media / Entertainment | 2 | $115B |
|
||
| Pharmaceuticals / Biotech | 2 | $62B |
|
||
Price history
+1039.1% since first listed7 events — show timeline
- 2026-06-08 Price Changed $393,000 CRMLS
- 2026-05-12 Listed $399,000 CRMLS
- 2010-09-24 Sold (MLS) $26,000 CSMAR
- 2010-09-24 Sold (MLS) $26,000 CRMLS
- 2010-08-27 Delisted — CRMLS
- 2010-08-10 Listed $34,500 CRMLS
- 2010-07-21 Listed $34,500 CSMAR
Property tax history
-3.0%/yrLatest (2025): $1,007 · -0.9% YoY. Source: county tax records.
Cash-flow waterfall
monthlySold comps — $/sqft
last 12 mo · ≤1 miLoading sold comps…