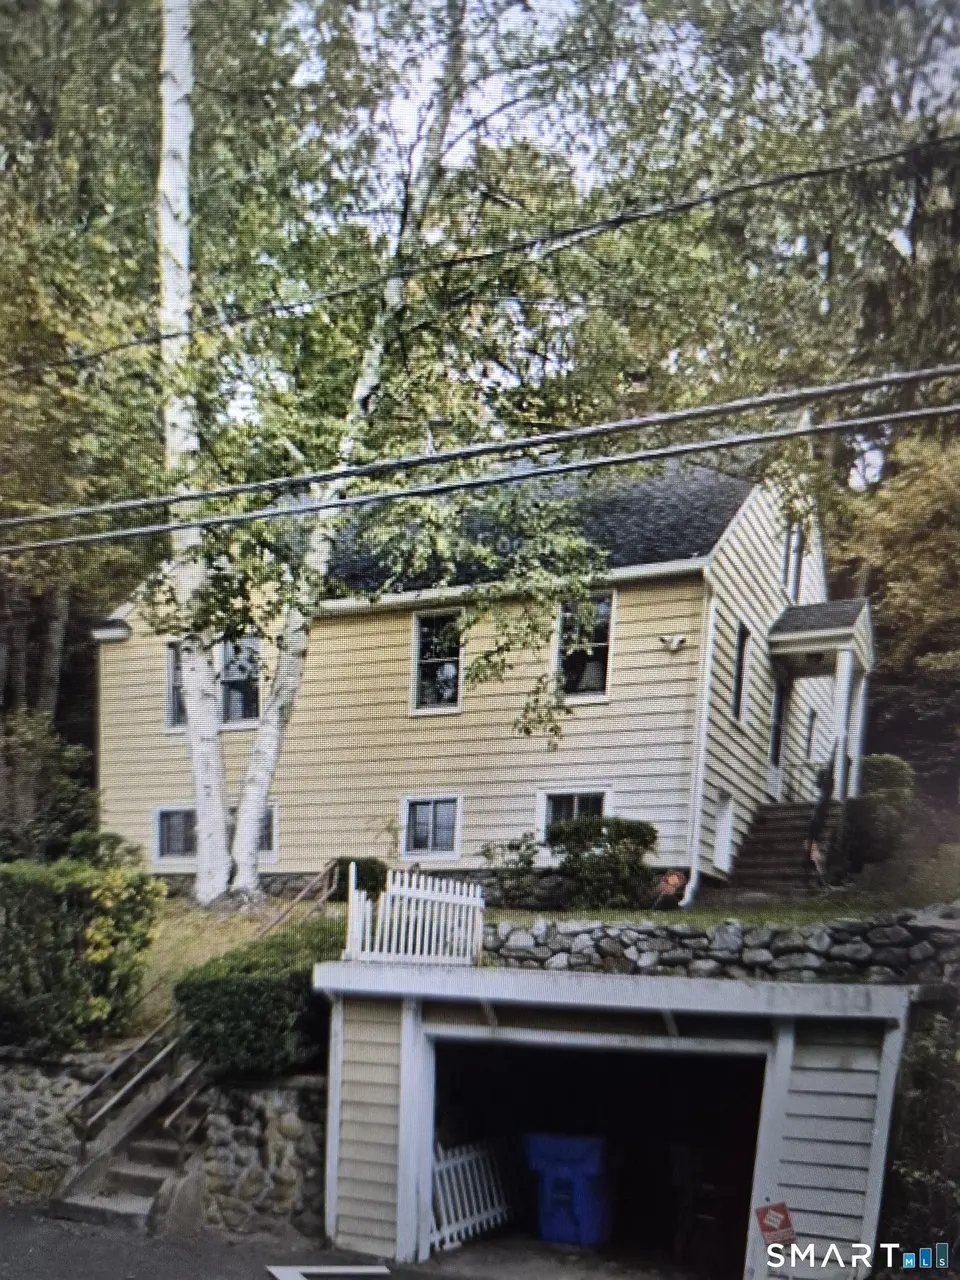
314 Porter Ave · Waterbury, CT
Flood risk 1/10 · Minimal
- FEMA flood zone
- X (unshaded)
- Chance of flooding over 30 yrs
- 0.0%
- Est. flood insurance / yr
- $473 – $860
Fire risk 1/10 · Minimal
- Est. fire insurance / yr
- $829 – $1,539
Heat risk 4/10 · Minor
- Hot days now (above 97°F)
- 7 days/yr
- Hot days in 30 yrs
- 16 days/yr
Wind risk 6/10 · Moderate
- Chance of severe wind over 30 yrs
- 27.0%
Air-quality risk 3/10 · Minor
- Unhealthy air days now
- 2 days/yr
- Unhealthy air days in 30 yrs
- 4 days/yr
Risk factors via First Street. Map © Google.
Why this score? — see what drove the D+ grade
The composite is a weighted blend of 9 inputs, each scored 0–100. Each bar is that input's sub-score; the figure is the points it added to the 100-point composite (weight × sub-score).
- Cash flow +12.8/30.0
- ARV discount +12.4/15.0
- Schools +5.4/10.0
- Livability +4.0/5.0
- 1% rule +3.8/10.0
- DSCR +3.8/10.0
- Rent growth +2.5/5.0
- Condition / age +2.5/5.0
- Appreciation +0.0/10.0
$349,900
🖨 Deal sheet 📄 Offer letter ✓ Due diligence
Listing remarks
A classic Middlebury Cape Cod offering strong potential. This 3bedroom, 2bath home sits on a 0.34acre lot and features 1,440 sq. ft. of living space plus a 900 sq. ft. basement. With an average physical condition rating and many original features, it's a handyman's dream-perfect for those looking to update, customize, and build equity. Traditional gableroof styling, aluminum siding, and a two story layout provide a solid foundation for renovation, with opportunities to refresh interiors, modernize systems, and enhance exterior elements. A great chance to transform a welllocated property into a personalized home in desirable Middlebury.
Key facts
- 0.34 acre lot
- Built 1941
- Listed 58 days
Property features AI
Exterior
- Utilities: Public water connected; Public sewer connected; Fuel tank located in basement
- Home design: Single-family home
- Construction: Frame construction; Concrete foundation
- Exterior features: Level lot; Aluminum siding; Gable roof
Interior
- Kitchen: Oven/Range; Refrigerator; Dishwasher
- Bedrooms: 3 bedrooms
- Bathrooms: 2 full bathrooms
- Heating & cooling: Hot air heating; Oil-fired heat; 50-gallon hot water tank (in basement)
- Interior features: 7 total rooms; Full basement; Walk-up attic
Neighborhood map
What this means for you Summary
Snapshot
- This is a 3-bed/2.0-bath single-family listed at $350k.
Deal economics
- At list price, monthly cash flow is $-30 ($-356/yr) — negative.
- To cash-flow at today's rent, offer at most $345k (1.5% below list).
- To meet the 1% rule (rent ≥ 1% of price), the offer needs to be $308k (12.1% below list).
- Recommended offer: $308k (12.1% below list) — sets the bar for 1% rule.
- Cap rate 6.2% vs local median 3.6% in Waterbury — top-decile yield for the area; either an underpriced asset or a hidden risk that comps aren't pricing in. Stress-test before assuming the spread holds.
Location & tenants
- Location reads 79/100 on livability (#32 in CT, #2,205 nationally) — a middle-class / working-renter tenant base. Strengths: commute A+, cost of living A+, housing A+; Watch: schools D+, crime D, employment D.
- Regional School District 15 (suburban): math 56% / reading 64% proficiency, ranked #46 of 153 in CT (top 30%) — acceptable for families but not a draw, mixed tenant base, ~2y average lease; only 4% free/reduced lunch — higher-income household profile.
- Market conditions: 60 active listings in the ZIP; 502 units permitted in Naugatuck Valley Planning Region in 2024 (171 in 5+ unit buildings).
Forward outlook
- Local home prices are declining (-3.0%/yr); year-one equity from $2k of loan paydown is wiped out by about $10k of value loss. Plan a longer hold.
Negotiation context
- It's been on market 58 days — a 3% lower offer ($339k) is reasonable based on typical stale-listing flexibility.
- Current owner paid $145k; list at $350k implies a 141% gain — meaningful room to come down on a strong offer.
Risks & watch-outs
- Watch-outs: built in 1941 — expect roof / HVAC / electrical / plumbing capex.
- Climate carrying-cost: major wind risk, 27% chance of damaging wind over 30y — expect insurance premiums to compound above CPI over the hold.
Questions for the listing agent
- What do current leases actually rent for vs. the listed asking? Can we see a recent rent roll and the last 12 months of T-12 income?
- It's been on market 58 days. Have you received any prior offers? Is the seller open to a 12% concession, seller financing, or rate buy-down credit?
- Built in 1941 — when were the roof, HVAC, electrical panel, plumbing, and water heater last replaced?
- Is there a deadline driving the sale (1031 exchange, divorce, estate, relocation)? That informs how much negotiation room exists.
- Schools are D-rated, which usually means shorter tenancies and higher turnover. Who's the typical renter profile here, and what's been the actual vacancy rate?
- Crime grade is D in this area — have there been break-ins, vandalism, or insurance claims at this property in the last 3 years? What carrier currently insures it and at what premium?
- The area grade is low — what's the realistic commute time and amenity access for the typical tenant pool here? Any planned neighborhood developments (good or bad) we should know about?
- What's the average days-on-market for RENTAL listings here right now (not sales)? A rising rental-DOM trend means longer vacancies and softer asking-rent achievability than the comps imply.
- What's the recent tenant-quality profile in this submarket — average credit score on applications, eviction rate, late-payment / NSF rate, and stable-employment percentage? A property-management company in the area should have these aggregated.
- How much new for-sale + rental construction is in the pipeline within 1–3 miles? Heavy new supply typically softens prices + rents 12–24 months out; constrained supply supports both.
Investment metrics
- 1% rule
- 0.88% ✗
- Cap rate
- 6.19%
- Cash-on-cash
- -0.36%
- DSCR
- 0.98
- GRM
- 9.5
CMA / ARV
- ARV (on-the-fly)
- $393,120
- Comps found
- 12
Show comp detail 12 sales within ~0.75 mi
| Address | Dist | Beds/Ba | Sqft | Sold | Price | $/sf | Match |
|---|---|---|---|---|---|---|---|
| 314 Porter Ave | 0.00mi | 3/2.0 | 1,440 (0%) | 1mo | $300,000 | $208 | 99 |
| 115 Porter Ave | 0.38mi | 3/2.0 | 1,498 (+4%) | 7mo | $409,000 | $273 | 70 |
| 377 Porter Ave | 0.12mi | 3/2.0 | 1,545 (+7%) | 15mo | $432,500 | $280 | 69 |
| 197 White Ave | 0.30mi | 3/2.0 | 1,494 (+4%) | 15mo | $410,000 | $274 | 68 |
| 18 Freedom Rd | 0.73mi | 3/1.5 | 1,492 (+4%) | 1mo | $495,650 | $332 | 57 |
| 713 Whittemore Rd | 0.61mi | 3/2.0 | 1,476 (+2%) | 13mo | $505,000 | $342 | 57 |
| 28 Maple Dr | 0.33mi | 3/3.5 | 1,596 (+11%) | 8mo | $435,000 | $273 | 54 |
| 70 Steinmann Ave | 0.45mi | 4/2.0 (+1) | 1,486 (+3%) | 20mo | $330,000 | $222 | 52 |
| 271 Shadduck Rd | 0.67mi | 3/1.5 | 1,288 (-11%) | 1mo | $435,000 | $338 | 48 |
| 225 Whittemore Rd | 0.40mi | 3/1.0 | 1,630 (+13%) | 9mo | $385,000 | $236 | 48 |
| 93 Fenn Rd | 0.64mi | 3/1.5 | 1,636 (+14%) | 8mo | $420,000 | $257 | 38 |
| 10 Yale Ave | 0.54mi | 3/1.5 | 1,640 (+14%) | 15mo | $390,000 | $238 | 37 |
Match score weights: distance 35% · size 25% · config 20% · recency 20%. Top-matched comps best support the ARV.
Projected returns pro-forma
-3.0% appreciation · 3.0% rent growth · sell at horizon
- IRR
- -16.9%
- Equity multiple
- 0.40×
- Total profit
- $-58,516
- Equity at exit
- $52,171
- IRR
- -8.7%
- Equity multiple
- 0.46×
- Total profit
- $-53,097
- Equity at exit
- $30,253
Cash invested: $97,972 (down + closing). Projections, not guarantees.
Landlord ↔ Tenant lean methodology
- Overall (STATE)
- 27 Tenant-Leaning
- State Connecticut
- 27 Tenant-Leaning · D+7
- County
- — inherits STATE
- City
- — inherits STATE
ZIP-level market 06762
- Home prices YoY
- -22.6%
- Active inventory
- 60
- Price-to-rent
- 9.5×
Monthly cashflow live
- Estimated rent
- $3,075 medium interval (Pro) →
- Mortgage (P&I)
- −$1,835
- Tax from tax record
- −$478 /mo · $5,739/yr
- Insurance
- −$146
- HOA
- −$0
- Vacancy / Maint / Mgmt
- −$646
- Net cashflow
- $-30
Break-even live
UW: 25.0% down · 7.5% · 30yr · 1.5% tax · 5.0% vac · 8.0% maint · 8.0% mgmt
Financing live
Cash to close
- Down payment
- $87,475
- Closing costs
- $10,497
- Reserves months
- —
- Total cash needed
- —
Loan-product check · same deal, 3 products live
Conventional
25% down · 7.5% · 30yr
- Down + closing
- —
- Monthly P&I
- —
- Monthly cashflow
- —
- DSCR
- —
- Eligible?
- —
Personal DTI + credit; lowest rate.
DSCR
20% down · 8.5% · 30yr
- Down + closing
- —
- Monthly P&I
- —
- Monthly cashflow
- —
- DSCR
- —
- Eligible?
- —
No personal income docs; deal must DSCR.
Hard money
10% down · 12.0% · 12mo
- Down + closing
- —
- Monthly P&I
- —
- Monthly cashflow
- —
- DSCR
- —
- Eligible?
- —
Short-term bridge; refi at stabilization.
Listing history 5 events
-
2026-05-23status Under Contract
-
2026-04-06historical Under Contract - Continue to Show
-
2026-03-27$349,900 Active
-
2026-03-25historical $349,900
-
1988-03-03soldstatus $145,000
ⓘ Source: listings_history table (triggers on properties + properties_extension) + one-shot
backfill from property_details.listing_events for pre-trigger history.
Tax reassessment forecast CT · Partial reset (capped growth)
- Current annual tax
- $5,739 · $478/mo
- Projected year-2 tax
- $6,613 · $551/mo
- Expected delta
- +$874/yr (+$73/mo · 15.2%)
ⓘ Screening estimate from a state-policy table — verify with the county assessor before closing.
Climate risk First Street
- Flood 1/10 Low FEMA zone X (unshaded) · 0% chance over 30 yrs
- Wildfire 1/10 Low
- Heat 4/10 Moderate 7 d/yr ≥97°F today · 16 d/yr by 30 yrs out
- Wind 6/10 Major 27% chance of damaging wind over 30 yrs
- Air quality 3/10 Moderate 2 unhealthy d/yr today · 4 by 30 yrs out
Nearby sold comps map
Loading sold comps map…
Walkable amenities ~0.75 mi
Loading nearby amenities…
Taxation est. · year 1
- Rental income
- $36,901
- − Mortgage interest
- −$19,600
- − Property taxes
- −$5,739
- − Insurance
- −$1,750
- − Repairs & maintenance
- −$2,952
- − Management
- −$2,952
- − Depreciation
- −$10,179
- Taxable loss
- −$6,271
- Est. tax savings @ 24.0%
- +$1,505
- After-tax cash flow
- $1,149/yr
For passive investors: Depreciation is non-cash, so a rental often shows a tax loss while cash-flowing — sheltering income. Rental losses are passive: they offset passive income freely, and up to $25,000/yr can offset ordinary (W-2) income if you actively participate and your MAGI is under $100k (phasing out to $0 by $150k); unused losses carry forward. On sale, claimed depreciation is recaptured at up to 25%, and gains may owe capital-gains tax (a 1031 exchange can defer both). Figures are a year-1 estimate at your 24.0% rate — not tax advice; consult a CPA.
Schools (NCES district)
- District
- Regional School District 15
- NCES district ID
- 0903537
- Math proficiency
- 56% ▼ -15.00%
- Reading proficiency
- 64% ▼ -11.00%
- Median HH income
- $84,697
- Composite
- 54.36/100
- National rank
- #1361
- State rank
- #46 of 153 in CT
Livability — Waterbury
- Score
- 79/100
- State rank
- #32
- US rank
- #2205
Category grades
Schools grade is shown separately in the Schools card above.
Census & demographics
- City population
- 115,012
- Population (ZIP)
- 7,736
Population outlook (Naugatuck Valley County) Hauer SSP2
- By 2040
- 496,846
Race, ethnicity, and origin ACS 2023
- Neighborhood character
- Predominantly White (83%)
- Race & ethnicity
- White 83% Asian 7% Two or more races 5% Hispanic / Latino 4%
- Common ancestry
- Russian 5% Lithuanian 4% Romanian 3%
- Foreign-born
- 12% · China, Canada
- Languages at home
- 87% English-only · Other Indo-European 5% Arabic 3% Chinese 1%
Political lean MEDSL · Naugatuck Valley
- 2024 margin
- Lean R (+7.4) · D 45.6% · R 53.0% · Other 1.4%
- All cycles
- 2024: R+7.4
Not yet ingested
- Civics
- —
Market trends
- HPI YoY
- ▼ -53.23%
- Current HPI
- 182.4523
- Rent YoY
- —
- Metro
- —
- State GDP YoY
- ▲ 1.06%
- F500 in state
- 38
Industry mix (Fortune 500 HQ in CT)
| Industry | F500 HQs | Revenue |
|---|---|---|
| Industrial Machinery | 4 | $38B |
|
||
| Insurance | 3 | $71B |
|
||
| Financial Services | 2 | $25B |
|
||
| Transportation / Logistics | 2 | $18B |
|
||
| Healthcare | 1 | $247B |
|
||
| Telecommunications | 1 | $55B |
|
||
Price history
+141.3% since first listed5 events — show timeline
- 2026-05-23 Pending — Smart MLS
- 2026-04-06 Contingent — Smart MLS
- 2026-03-27 Listed $349,900 Smart MLS
- 2026-03-25 Coming Soon $349,900 Smart MLS
- 1988-03-03 Sold (Public Records) $145,000 Public Records
Property tax history
+2.6%/yrLatest (2022): $5,739 · +17.6% YoY. Source: county tax records.
Cash-flow waterfall
monthlySold comps — $/sqft
last 12 mo · ≤1 miLoading sold comps…