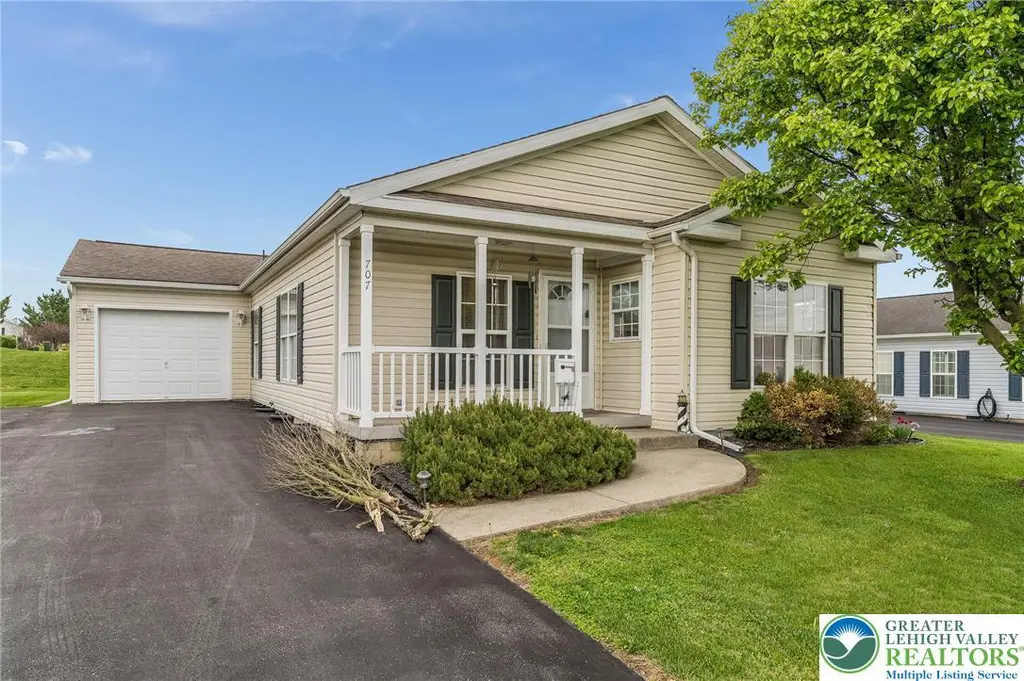
707 San Simeon Pl · Tatamy, PA
Flood risk 1/10 · Minimal
- FEMA flood zone
- X (unshaded)
- Chance of flooding over 30 yrs
- 0.0%
- Est. flood insurance / yr
- $473 – $860
Fire risk 1/10 · Minimal
- Est. fire insurance / yr
- $511 – $949
Heat risk 5/10 · Moderate
- Hot days now (above 99°F)
- 7 days/yr
- Hot days in 30 yrs
- 16 days/yr
Wind risk 4/10 · Minor
- Chance of severe wind over 30 yrs
- 18.0%
Air-quality risk 3/10 · Minor
- Unhealthy air days now
- 3 days/yr
- Unhealthy air days in 30 yrs
- 5 days/yr
Risk factors via First Street. Map © Google.
Why this score? — see what drove the D+ grade
The composite is a weighted blend of 9 inputs, each scored 0–100. Each bar is that input's sub-score; the figure is the points it added to the 100-point composite (weight × sub-score).
- ARV discount +15.0/15.0
- Cash flow +9.0/30.0
- 1% rule +8.3/10.0
- Livability +3.8/5.0
- Schools +3.3/10.0
- DSCR +2.5/10.0
- Rent growth +2.5/5.0
- Condition / age +2.5/5.0
- Appreciation +0.0/10.0
$195,000
🖨 Deal sheet (PDF) 📄 Offer letter ✓ Due diligence
Listing remarks
Welcome to easy, single-level living in the highly desirable Jacob’s Farm 55+ community. This charming ranch home offers 2 bedrooms, 2 full baths and convenient 1-car garage. Designed for comfort and simplicity, the layout features spacious living areas, a large eat-in kitchen, private primary suite with full bath and a deck with retractable awning. With great bones and tons of potential, this home is perfect for buyers looking to add their personal touch. A little TLC will go a long way in transforming this property into a true gem. Enjoy all the benefits of a vibrant, low-maintenance community while creating a space that reflects your style. Don’t miss this opportunity to make
Key facts
- Large eat-in kitchen
- Single level living
- Garage
Tags
Property features AI
Finance
- HOA & community: Monthly association fee of $780; Senior community
Exterior
- Parking: Attached garage; Driveway; Garage (1 car)
- Utilities: Public water; Public sewer; Cable available
- Home design: Single-story; 1,708 above-grade finished area
- Construction: Vinyl siding; Wood siding; Asphalt/fiberglass roof
- Exterior features: Deck; Awning(s); Mobile home on property; Zoned 11GB
Interior
- Kitchen: Dishwasher; Gas cooktop; Microwave
- Bedrooms: Total of 5 rooms (includes bedrooms and living spaces)
- Flooring: Engineered hardwood; Laminate; Resilient flooring
- Bathrooms: 2 full bathrooms
- Heating & cooling: Forced air heating (gas); Central air conditioning
- Interior features: Breakfast area; Family room on main level; Crawl space basement
- Laundry & utility: Laundry on main level; Gas water heater
Neighborhood map
What this means for you Summary
Snapshot
- This is a 2-bed/2.0-bath manufactured listed at $195k.
Deal economics
- At list price, monthly cash flow is $-153 ($-2k/yr) — negative.
- To cash-flow at today's rent, offer at most $168k (13.9% below list).
- Meets the 1% rule at list price ($3k rent vs $195k).
- Recommended offer: $168k (13.9% below list) — sets the bar for cash-flow.
- Cap rate 5.4% vs local median 2.4% in Tatamy — top-decile yield for the area; either an underpriced asset or a hidden risk that comps aren't pricing in. Stress-test before assuming the spread holds.
Location & tenants
- Location reads 76/100 on livability (#395 in PA, #3,601 nationally) — a middle-class / working-renter tenant base. Strengths: crime A+, cost of living A+, housing A-; Watch: amenities F, commute F.
- Easton Area SD (suburban): math 31% / reading 44% proficiency, ranked #364 of 539 in PA (top 68%) — families likely to look elsewhere, expect single-tenant / working-renter base with shorter leases.
- Zoned schools: Shawnee El Sch (math 58% / reading 65%, grade B, #360 of 1,518 statewide, top 24%, 602 students, 100% FRL); Easton Area Ms (math 16% / reading 43%, grade F, #385 of 512 statewide, top 76%, 1,874 students, 100% FRL); Easton Area Hs (math 49% / reading 44%, grade D-, #173 of 437 statewide, top 40%, 2,844 students, 92% FRL) — zoned schools average 97% FRL vs 40% district-wide (58 pts higher); higher-poverty schools than district average — tighter screening recommended.
- Market conditions: 153 active listings in the ZIP; 3 comparable units currently listed for rent nearby; rentals leasing fast (median 5d on market — plan ~1-2 weeks tenant-placement turnaround); 567 units permitted in Northampton County in 2024 (151 in 5+ unit buildings).
Forward outlook
- Local home prices are declining (-3.0%/yr); year-one equity from $1k of loan paydown is wiped out by about $6k of value loss. Plan a longer hold.
Negotiation context
- It's been on market 35 days — a 3% lower offer ($189k) is reasonable based on typical stale-listing flexibility.
Risks & watch-outs
- Watch-outs: HOA is 30% of rent.
- Climate carrying-cost: extreme-heat days projected 7→16/yr by 2055 (HVAC capex compounding) — expect insurance premiums to compound above CPI over the hold.
Questions for the listing agent
- What do current leases actually rent for vs. the listed asking? Can we see a recent rent roll and the last 12 months of T-12 income?
- It's been on market 35 days. Have you received any prior offers? Is the seller open to a 14% concession, seller financing, or rate buy-down credit?
- What does the HOA fee cover, when was the last increase, and are there any pending special assessments or reserve-fund shortfalls?
- Is there a deadline driving the sale (1031 exchange, divorce, estate, relocation)? That informs how much negotiation room exists.
- Schools are D-rated, which usually means shorter tenancies and higher turnover. Who's the typical renter profile here, and what's been the actual vacancy rate?
- The area grade is low — what's the realistic commute time and amenity access for the typical tenant pool here? Any planned neighborhood developments (good or bad) we should know about?
- What's the average days-on-market for RENTAL listings here right now (not sales)? A rising rental-DOM trend means longer vacancies and softer asking-rent achievability than the comps imply.
- What's the recent tenant-quality profile in this submarket — average credit score on applications, eviction rate, late-payment / NSF rate, and stable-employment percentage? A property-management company in the area should have these aggregated.
- How much new for-sale + rental construction is in the pipeline within 1–3 miles? Heavy new supply typically softens prices + rents 12–24 months out; constrained supply supports both.
Investment metrics
- 1% rule
- 1.33% ✓
- Cap rate
- 5.35%
- Cash-on-cash
- -3.36%
- DSCR
- 0.85
- GRM
- 6.3
CMA / ARV
- ARV (median comp)
- $240,500
- List price
- $195,000
- Delta
- -18.92%
- Verdict
- UNDERPRICED
- Comps
- 7 within 1.0 mi
Show comp detail 10 sales within ~0.75 mi
| Address | Dist | Beds/Ba | Sqft | Sold | Price | $/sf | Match |
|---|---|---|---|---|---|---|---|
| 727 Kykuit Pl | 0.05mi | 2/2.0 | 1,708 (0%) | 2mo | $280,000 | $164 | 96 |
| 550 Biltmore Ave | 0.14mi | 2/2.0 | 1,732 (+1%) | 8mo | $280,000 | $162 | 84 |
| 715 San Simeon Pl | 0.01mi | 2/2.0 | 1,680 (-2%) | 18mo | $226,000 | $135 | 82 |
| 719 Winterthur | 0.05mi | 2/2.0 | 1,708 (0%) | 24mo | $214,400 | $126 | 78 |
| 720 Whitemarsh Dr | 0.06mi | 2/2.0 | 1,595 (-7%) | 11mo | $305,000 | $191 | 77 |
| 677 Biltmore Ave | 0.10mi | 2/2.0 | 1,708 (0%) | 23mo | $195,000 | $114 | 76 |
| 678 Kykuit Pl | 0.06mi | 2/2.0 | 1,475 (-14%) | 1mo | $240,500 | $163 | 74 |
| 608 Biltmore | 0.16mi | 2/2.0 | 1,498 (-12%) | 14mo | $208,000 | $139 | 61 |
| 719 Kykuit Pl | 0.04mi | 2/2.0 | 1,452 (-15%) | 22mo | $214,900 | $148 | 55 |
| 600 Biltmore Ave | 0.15mi | 2/2.0 | 1,508 (-12%) | 23mo | $205,000 | $136 | 54 |
Match score weights: distance 35% · size 25% · config 20% · recency 20%. Top-matched comps best support the ARV.
Projected returns pro-forma
-3.0% appreciation · 3.0% rent growth · sell at horizon
- IRR
- -21.5%
- Equity multiple
- 0.25×
- Total profit
- $-40,780
- Equity at exit
- $29,075
- IRR
- -14.4%
- Equity multiple
- 0.16×
- Total profit
- $-45,760
- Equity at exit
- $16,860
Cash invested: $54,600 (down + closing). Projections, not guarantees.
Landlord ↔ Tenant lean methodology
- Overall (STATE)
- 62 Landlord-Friendly
- State Pennsylvania
- 62 Landlord-Friendly · EVEN
- County
- — inherits STATE
- City
- — inherits STATE
ZIP-level market 18040
- Active inventory
- 153
- Price-to-rent
- 6.3×
Monthly cashflow live
- Estimated rent
- $2,599 medium interval (Pro) →
- Mortgage (P&I)
- −$1,023
- Tax from tax record
- −$322 /mo · $3,866/yr
- Insurance
- −$81
- HOA
- −$780
- Vacancy / Maint / Mgmt
- −$546
- Net cashflow
- $-153
Break-even live
Sensitivity live
| Price | -10% $-43 | -5% $-98 | +0% $-153 | +5% $-208 | +10% $-263 |
|---|---|---|---|---|---|
| Rent | -10% $-358 | -5% $-256 | +0% $-153 | +5% $-50 | +10% $52 |
| Rate | -1.0pp $-55 | -0.5pp $-103 | base $-153 | +0.5pp $-204 | +1.0pp $-255 |
UW: 25.0% down · 7.5% · 30yr · 1.5% tax · 5.0% vac · 8.0% maint · 8.0% mgmt
Financing live
Cash to close
- Down payment
- $48,750
- Closing costs
- $5,850
- Reserves months
- —
- Total cash needed
- —
Loan-product check · same deal, 3 products live
Conventional
25% down · 7.5% · 30yr
- Down + closing
- —
- Monthly P&I
- —
- Monthly cashflow
- —
- DSCR
- —
- Eligible?
- —
Personal DTI + credit; lowest rate.
DSCR
20% down · 8.5% · 30yr
- Down + closing
- —
- Monthly P&I
- —
- Monthly cashflow
- —
- DSCR
- —
- Eligible?
- —
No personal income docs; deal must DSCR.
Hard money
10% down · 12.0% · 12mo
- Down + closing
- —
- Monthly P&I
- —
- Monthly cashflow
- —
- DSCR
- —
- Eligible?
- —
Short-term bridge; refi at stabilization.
Rent comps 3 comps
| Address | Beds | Baths | Sqft | Rent | $/sqft | DOM | Units | Dist |
|---|---|---|---|---|---|---|---|---|
| 2000 Trailside Dr Easton, PA | 1.0–2.0 | 1.0–2.5 | 1072 | $2,775 | $2.59 | 4d | 27 | 0.60mi |
| 2465 Gillian Ln Easton, PA | 3.0 | 2.5 | 2075 | $2,300 | $1.11 | 16d | 1 | 1.33mi |
| 1924 Alex Rd Easton, PA | 3.0 | 2.0 | 1325 | $2,600 | $1.96 | 4d | 1 | 1.41mi |
HOA detail
- Monthly dues
- $780 · $9,360/yr
Listing history 12 events
-
2026-06-13status $195,000 Pending 35 DOM
-
2026-06-10days on market $195,000 Active 35 DOM
-
2026-06-09days on market $195,000 Active 34 DOM
-
2026-06-08days on market $195,000 Active 33 DOM
-
2026-06-07days on market $195,000 Active 32 DOM
-
2026-06-05days on market $195,000 Active 29 DOM
-
2026-06-03days on market $195,000 Active 28 DOM
-
2026-06-02days on market $195,000 Active 27 DOM
-
2026-06-01days on market $195,000 Active 26 DOM
-
2026-05-31days on market $195,000 Active 25 DOM
-
2026-05-31days on market $195,000 Active 24 DOM
-
2026-05-06$195,000 Active 712-char remark
ⓘ Source: listings_history table (triggers on properties + properties_extension) + one-shot
backfill from property_details.listing_events for pre-trigger history.
Tax reassessment forecast PA · Partial reset (capped growth)
- Current annual tax
- $3,866 · $322/mo
- Projected year-2 tax
- $3,866 · $322/mo
- Expected delta
- $0/yr ($0/mo · 0.0%)
ⓘ Screening estimate from a state-policy table — verify with the county assessor before closing.
Climate risk First Street
- Flood 1/10 Low FEMA zone X (unshaded) · 0% chance over 30 yrs
- Wildfire 1/10 Low
- Heat 5/10 Major 7 d/yr ≥99°F today · 16 d/yr by 30 yrs out
- Wind 4/10 Moderate 18% chance of damaging wind over 30 yrs
- Air quality 3/10 Moderate 3 unhealthy d/yr today · 5 by 30 yrs out
Nearby sold comps map
Loading sold comps map…
Walkable amenities ~0.75 mi
Loading nearby amenities…
Taxation est. · year 1
- Rental income
- $31,185
- − Mortgage interest
- −$10,923
- − Property taxes
- −$3,866
- − Insurance
- −$975
- − Repairs & maintenance
- −$2,495
- − Management
- −$2,495
- − HOA
- −$9,360
- − Depreciation
- −$5,673
- Taxable loss
- −$4,602
- Est. tax savings @ 24.0%
- +$1,104
- After-tax cash flow
- $-732/yr
For passive investors: Depreciation is non-cash, so a rental often shows a tax loss while cash-flowing — sheltering income. Rental losses are passive: they offset passive income freely, and up to $25,000/yr can offset ordinary (W-2) income if you actively participate and your MAGI is under $100k (phasing out to $0 by $150k); unused losses carry forward. On sale, claimed depreciation is recaptured at up to 25%, and gains may owe capital-gains tax (a 1031 exchange can defer both). Figures are a year-1 estimate at your 24.0% rate — not tax advice; consult a CPA.
Schools (NCES district)
- District
- Easton Area SD
- NCES district ID
- 4208850
- Math proficiency
- 31% ▼ -2.00%
- Reading proficiency
- 44% ▼ -11.00%
- Median HH income
- $61,390
- Composite
- 33.46/100
- National rank
- #5457
- State rank
- #364 of 539 in PA
Livability — Tatamy
- Score
- 76/100
- State rank
- #395
- US rank
- #3601
Category grades
Schools grade is shown separately in the Schools card above.
Census & demographics
- City population
- 1,162
- Population (ZIP)
- 17,183
Population outlook (Northampton County) Hauer SSP2
- Today (2025)
- 312,227 people
- By 2030
- 314,769 · +0.8%
- By 2040
- 316,914 · +1.5%
- By 2050
- 318,037 · +1.9%
- By 2075
- 334,003 · +7.0%
- By 2100
- 344,696 · +10.4%
Race, ethnicity, and origin ACS 2023
- Neighborhood character
- Predominantly White (75%)
- Race & ethnicity
- White 75% Hispanic / Latino 9% Asian 8% Black 7% Two or more races 3%
- Hispanic origin (detail)
- Puerto Rican 3% Dominican 2%
- Common ancestry
- Romanian 6% Iranian 2% Slovak 1%
- Foreign-born
- 12% · Canada, China, Jamaica
- Languages at home
- 86% English-only · Spanish 5% Other Indo-European 3% Chinese 2%
Political lean MEDSL · Northampton
- 2024 margin
- Toss-up / Even · D 48.6% · R 50.4%
- 2008→2024 swing
- -14.1pp toward R · 2008: 12.3pp · 2024: -1.8pp
- All cycles
- 2024: R+1.8 2020: D+0.7 2016: R+3.8 2012: D+4.6 2008: D+12.3
Not yet ingested
- Civics
- —
Market trends
- HPI YoY
- ▼ -119.10%
- Current HPI
- 190.2081
- Rent YoY
- —
- Metro
- —
- State GDP YoY
- ▲ 1.68%
- F500 in state
- 34
Industry mix (Fortune 500 HQ in PA)
| Industry | F500 HQs | Revenue |
|---|---|---|
| Healthcare | 2 | $309B |
|
||
| Insurance | 2 | $27B |
|
||
| Telecommunications / Media | 1 | $124B |
|
||
| Industrial Distribution | 1 | $22B |
|
||
| Financial Services | 1 | $20B |
|
||
| Chemicals / Materials | 1 | $18B |
|
||
Price history
2 events — show timeline
- 2026-06-10 Pending — GLVRMLS
- 2026-05-06 Listed $195,000 GLVRMLS
Property tax history
+2.0%/yrLatest (2026): $3,866 · +3.0% YoY. Source: county tax records.
Cash-flow waterfall
monthlySold comps — $/sqft
last 12 mo · ≤1 miLoading sold comps…