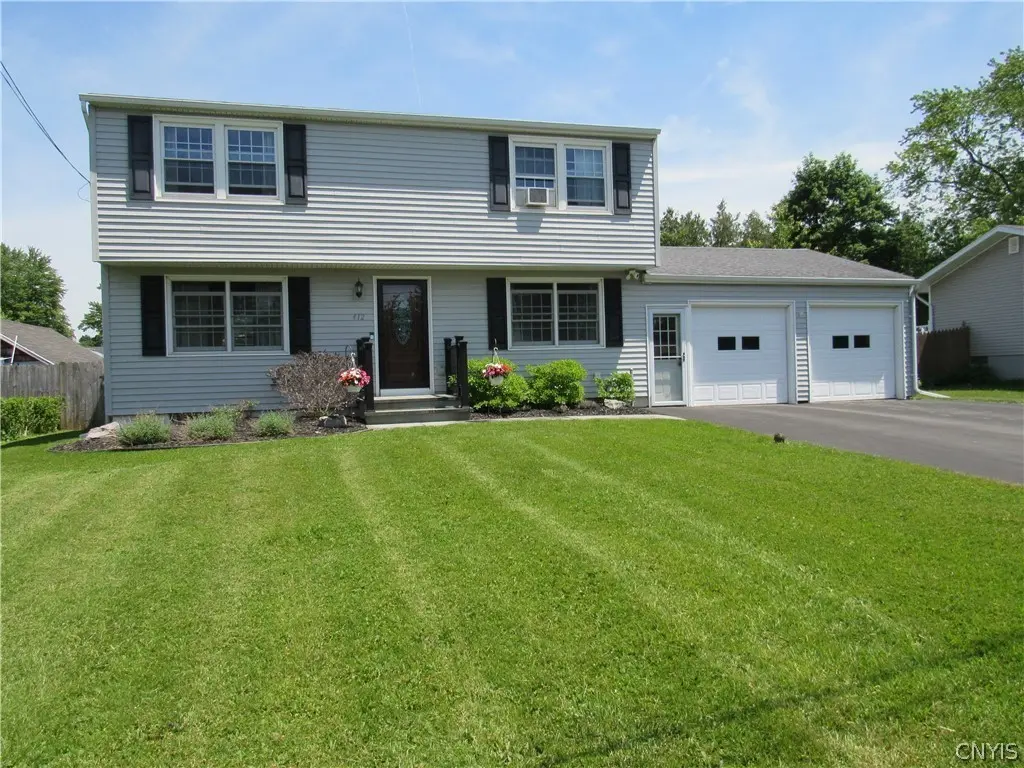
412 Stillwell Cir · East Syracuse, NY
Flood risk 1/10 · Minimal
- FEMA flood zone
- X (unshaded)
- Chance of flooding over 30 yrs
- 0.0%
- Est. flood insurance / yr
- $473 – $860
Fire risk 1/10 · Minimal
- Est. fire insurance / yr
- $691 – $1,283
Heat risk 3/10 · Minor
- Hot days now (above 95°F)
- 7 days/yr
- Hot days in 30 yrs
- 16 days/yr
Wind risk 1/10 · Minimal
- Chance of severe wind over 30 yrs
- 0.0%
Air-quality risk 2/10 · Minimal
- Unhealthy air days now
- 0 days/yr
- Unhealthy air days in 30 yrs
- 1 days/yr
Risk factors via First Street. Map © Google.
Why this score? — see what drove the D- grade
The composite is a weighted blend of 9 inputs, each scored 0–100. Each bar is that input's sub-score; the figure is the points it added to the 100-point composite (weight × sub-score).
- Cash flow +11.6/30.0
- Livability +4.5/5.0
- 1% rule +4.3/10.0
- Schools +4.3/10.0
- DSCR +3.4/10.0
- ARV discount +2.8/15.0
- Rent growth +2.5/5.0
- Condition / age +2.5/5.0
- Appreciation +0.0/10.0
$289,900
🖨 Deal sheet 📄 Offer letter ✓ Due diligence
Listing remarks
PRICE REDUCTION $289,900!!!! OPEN HOUSE Sunday June 21st 11:00 - 1:00 PM. Charming 4-bedroom 2 full bath colonial with beautiful curb appeal and fully fenced in yard. Newly updated front paver walk and landscaping. New Trex deck, perfect for entertaining. Great location in quiet neighborhood in the East Syracuse Minoa School District. Partially finish basement with still great deal storage. This home has everything to make it your own!!
Key facts
- Great storage
- New paver walk
- New trex deck
Tags
Property features AI
Exterior
- Parking: Attached garage (2 car)
- Utilities: Public water (connected); Sewer connected
- Home design: 2-story home; Existing/resale property
- Construction: Aluminum siding; Block foundation
- Exterior features: Blacktop driveway; Rectangular residential lot; City street frontage; Lot dimensions approximately 72 x 135
Interior
- Kitchen: Dishwasher; Electric oven; Electric range; Microwave; Refrigerator; Garbage disposal
- Bedrooms: Total rooms: 7
- Flooring: Carpet; Ceramic tile; Hardwood
- Bathrooms: 2 full bathrooms; 1 main-level bathroom
- Heating & cooling: Gas hot-water heating; Window air conditioning units
- Interior features: Eat-in kitchen; Separate/formal living room; Crawl space basement; Fireplace (1)
- Laundry & utility: Washer; Gas water heater
Neighborhood map
What this means for you Summary
Snapshot
- This is a 4-bed/2.0-bath single-family listed at $290k.
Deal economics
- At list price, monthly cash flow is $-90 ($-1k/yr) — negative.
- To cash-flow at today's rent, offer at most $274k (5.5% below list).
- To meet the 1% rule (rent ≥ 1% of price), the offer needs to be $269k (7.2% below list).
- Recommended offer: $269k (7.2% below list) — sets the bar for 1% rule.
Location & tenants
- Location reads 90/100 on livability (#4 in NY, #81 nationally) — a professional / high-income tenant draw. Strengths: amenities A+, commute A+, cost of living A+; Watch: schools D+.
- East Syracuse Minoa Central School District (rural): math 46% / reading 53% proficiency, ranked #379 of 590 in NY (top 64%) — families likely to look elsewhere, expect single-tenant / working-renter base with shorter leases.
- Market conditions: 58 active listings in the ZIP; 2 comparable units currently listed for rent nearby; solid renter incomes; 616 units permitted in Onondaga County in 2024 (256 in 5+ unit buildings).
- This rent runs 40% of the median local income ($81k/yr) — at the standard rent-burdened threshold; future hikes will face affordability resistance.
Forward outlook
- Local home prices are declining (-3.0%/yr); year-one equity from $2k of loan paydown is wiped out by about $9k of value loss. Plan a longer hold.
- Onondaga County population projected to shrink 9% by 2050 — rents likely to lag national; underwrite the cash flow, not the appreciation.
Negotiation context
- Only 14 days on market — expect competitive offers; lowballing is unlikely to land.
- Current owner paid $101k; list at $290k implies a 187% gain — meaningful room to come down on a strong offer.
Questions for the listing agent
- What do current leases actually rent for vs. the listed asking? Can we see a recent rent roll and the last 12 months of T-12 income?
- Built in 1966 — when were the roof, HVAC, electrical panel, plumbing, and water heater last replaced?
- Is there a deadline driving the sale (1031 exchange, divorce, estate, relocation)? That informs how much negotiation room exists.
- Schools are D-rated, which usually means shorter tenancies and higher turnover. Who's the typical renter profile here, and what's been the actual vacancy rate?
- The area grade is low — what's the realistic commute time and amenity access for the typical tenant pool here? Any planned neighborhood developments (good or bad) we should know about?
- What's the average days-on-market for RENTAL listings here right now (not sales)? A rising rental-DOM trend means longer vacancies and softer asking-rent achievability than the comps imply.
- What's the recent tenant-quality profile in this submarket — average credit score on applications, eviction rate, late-payment / NSF rate, and stable-employment percentage? A property-management company in the area should have these aggregated.
- How much new for-sale + rental construction is in the pipeline within 1–3 miles? Heavy new supply typically softens prices + rents 12–24 months out; constrained supply supports both.
Investment metrics
- 1% rule
- 0.93% ✗
- Cap rate
- 5.92%
- Cash-on-cash
- -1.34%
- DSCR
- 0.94
- GRM
- 9.0
CMA / ARV
- ARV (on-the-fly)
- $262,350
- Comps found
- 12
Show comp detail 12 sales within ~0.75 mi
| Address | Dist | Beds/Ba | Sqft | Sold | Price | $/sf | Match |
|---|---|---|---|---|---|---|---|
| 116 Stillwater Dr | 0.37mi | 3/2.5 (-1) | 1,692 (+2%) | 2mo | $300,000 | $177 | 70 |
| 302 Altmont Dr | 0.18mi | 5/2.0 (+1) | 1,728 (+5%) | 14mo | $230,000 | $133 | 68 |
| 418 Tilden Dr | 0.13mi | 3/1.5 (-1) | 1,506 (-9%) | 9mo | $255,000 | $169 | 65 |
| 208 Washburn Dr | 0.23mi | 4/1.5 | 1,560 (-6%) | 18mo | $237,000 | $152 | 63 |
| 602 Franklin Park Dr | 0.15mi | 3/1.5 (-1) | 1,784 (+8%) | 12mo | $322,500 | $181 | 62 |
| 108 Saginaw Dr | 0.19mi | 3/2.0 (-1) | 1,750 (+6%) | 18mo | $250,000 | $143 | 61 |
| 6463 Wembridge Dr | 0.19mi | 3/1.5 (-1) | 1,872 (+14%) | 8mo | $230,000 | $123 | 55 |
| 6470 Carson Dr | 0.31mi | 3/3.0 (-1) | 1,480 (-10%) | 8mo | $260,000 | $176 | 53 |
| 43 Grover St | 0.68mi | 4/1.0 | 1,584 (-4%) | 15mo | $214,000 | $135 | 46 |
| 713 N Highland Ave | 0.59mi | 3/2.0 (-1) | 1,416 (-14%) | 7mo | $225,000 | $159 | 38 |
| 115 Hazel Ave | 0.63mi | 3/1.0 (-1) | 1,480 (-10%) | 9mo | $240,000 | $162 | 37 |
| 331 Frederick St E | 0.75mi | 3/2.0 (-1) | 1,860 (+13%) | 8mo | $230,000 | $124 | 32 |
Match score weights: distance 35% · size 25% · config 20% · recency 20%. Top-matched comps best support the ARV.
Projected returns pro-forma
-3.0% appreciation · 3.0% rent growth · sell at horizon
- IRR
- -18.4%
- Equity multiple
- 0.35×
- Total profit
- $-52,565
- Equity at exit
- $43,225
- IRR
- -10.6%
- Equity multiple
- 0.35×
- Total profit
- $-52,493
- Equity at exit
- $25,065
Cash invested: $81,172 (down + closing). Projections, not guarantees.
Landlord ↔ Tenant lean methodology
- Overall (STATE)
- 15 Strongly Tenant-Friendly
- State New York
- 15 Strongly Tenant-Friendly · D+10
- County
- — inherits STATE
- City
- — inherits STATE
ZIP-level market 13057
- Home prices YoY
- -11.1%
- Active inventory
- 58
- Price-to-rent
- 9.0×
Monthly cashflow live
- Estimated rent
- $2,691 medium interval (Pro) →
- Mortgage (P&I)
- −$1,520
- Tax from tax record
- −$575 /mo · $6,904/yr
- Insurance
- −$121
- HOA
- −$0
- Vacancy / Maint / Mgmt
- −$565
- Net cashflow
- $-90
Break-even live
UW: 25.0% down · 7.5% · 30yr · 1.5% tax · 5.0% vac · 8.0% maint · 8.0% mgmt
Financing live
Cash to close
- Down payment
- $72,475
- Closing costs
- $8,697
- Reserves months
- —
- Total cash needed
- —
Loan-product check · same deal, 3 products live
Conventional
25% down · 7.5% · 30yr
- Down + closing
- —
- Monthly P&I
- —
- Monthly cashflow
- —
- DSCR
- —
- Eligible?
- —
Personal DTI + credit; lowest rate.
DSCR
20% down · 8.5% · 30yr
- Down + closing
- —
- Monthly P&I
- —
- Monthly cashflow
- —
- DSCR
- —
- Eligible?
- —
No personal income docs; deal must DSCR.
Hard money
10% down · 12.0% · 12mo
- Down + closing
- —
- Monthly P&I
- —
- Monthly cashflow
- —
- DSCR
- —
- Eligible?
- —
Short-term bridge; refi at stabilization.
Rent comps 2 comps
| Address | Beds | Baths | Sqft | Rent | $/sqft | DOM | Units | Dist |
|---|---|---|---|---|---|---|---|---|
| 116 Stillwater Dr East Syracuse, NY | 3.0 | 2.5 | 1692 | $3,000 | $1.77 | 21d | 1 | 0.37mi |
| 6463 Wells Dr Unit 6465 East Syracuse, NY | 3.0 | 2.0 | 1519 | $1,800 | $1.18 | 21d | 1 | 0.40mi |
Listing history 12 events
-
2026-06-18days on market $289,900 Active 14 DOM
-
2026-06-17remarks 441-char remark
-
2026-06-17pricedays on market $289,900 Active 13 DOM
-
2026-06-16days on market $325,000 Active 12 DOM
-
2026-06-15days on market $325,000 Active 11 DOM
-
2026-06-14days on market $325,000 Active 9 DOM
-
2026-06-13days on market $325,000 Active 8 DOM
-
2026-06-10days on market $325,000 Active 6 DOM
-
2026-06-09days on market $325,000 Active 5 DOM
-
2026-06-08days on market $325,000 Active 4 DOM
-
2026-06-07remarks 367-char remark
-
2026-06-07$325,000 Active 3 DOM
ⓘ Source: listings_history table (triggers on properties + properties_extension) + one-shot
backfill from property_details.listing_events for pre-trigger history.
Tax reassessment forecast NY · Partial reset (capped growth)
- Current annual tax
- $6,904 · $575/mo
- Projected year-2 tax
- $6,904 · $575/mo
- Expected delta
- $0/yr ($0/mo · 0.0%)
ⓘ Screening estimate from a state-policy table — verify with the county assessor before closing.
Climate risk First Street
- Flood 1/10 Low FEMA zone X (unshaded) · 0% chance over 30 yrs
- Wildfire 1/10 Low
- Heat 3/10 Moderate 7 d/yr ≥95°F today · 16 d/yr by 30 yrs out
- Wind 1/10 Low 0% chance of damaging wind over 30 yrs
- Air quality 2/10 Low 0 unhealthy d/yr today · 1 by 30 yrs out
Nearby sold comps map
Loading sold comps map…
Walkable amenities ~0.75 mi
Loading nearby amenities…
Taxation est. · year 1
- Rental income
- $32,293
- − Mortgage interest
- −$16,239
- − Property taxes
- −$6,904
- − Insurance
- −$1,450
- − Repairs & maintenance
- −$2,583
- − Management
- −$2,583
- − Depreciation
- −$8,433
- Taxable loss
- −$5,900
- Est. tax savings @ 24.0%
- +$1,416
- After-tax cash flow
- $331/yr
For passive investors: Depreciation is non-cash, so a rental often shows a tax loss while cash-flowing — sheltering income. Rental losses are passive: they offset passive income freely, and up to $25,000/yr can offset ordinary (W-2) income if you actively participate and your MAGI is under $100k (phasing out to $0 by $150k); unused losses carry forward. On sale, claimed depreciation is recaptured at up to 25%, and gains may owe capital-gains tax (a 1031 exchange can defer both). Figures are a year-1 estimate at your 24.0% rate — not tax advice; consult a CPA.
Schools (NCES district)
- District
- East Syracuse Minoa Central School District
- NCES district ID
- 3609990
- Math proficiency
- 46% ▼ -6.00%
- Reading proficiency
- 53% ▲ 9.00%
- Median HH income
- $55,801
- Composite
- 42.9/100
- National rank
- #3122
- State rank
- #379 of 590 in NY
Livability — East Syracuse
- Score
- 90/100
- State rank
- #4
- US rank
- #81
Category grades
Schools grade is shown separately in the Schools card above.
Census & demographics
- County
- Onondaga County · 247,257 people
- City population
- 14,253
- Metro
- Syracuse, NY
- Population (ZIP)
- 14,253
- Household income
- $80,900
- Rent vs Own
- Severe rent burden
- 250.0
Population outlook (Onondaga County) Hauer SSP2
- Today (2025)
- 467,894 people
- By 2030
- 463,381 · -1.0%
- By 2040
- 447,697 · -4.3%
- By 2050
- 426,399 · -8.9%
- By 2075
- 373,661 · -20.1%
- By 2100
- 307,967 · -34.2%
Race, ethnicity, and origin ACS 2023
- Neighborhood character
- Predominantly White (88%)
- Race & ethnicity
- White 88% Two or more races 5% Hispanic / Latino 3% Asian 2% Black 2%
- Common ancestry
- Romanian 5% Lithuanian 4% American 3%
- Foreign-born
- 6% · Canada, Vietnam
- Languages at home
- 92% English-only · Russian/Polish/Slavic 3% Spanish 1% Other Indo-European 1%
Political lean MEDSL · Onondaga
- 2024 margin
- D (+17.3) · D 58.6% · R 41.4%
- 2008→2024 swing
- -3.0pp toward R · 2008: 20.3pp · 2024: 17.3pp
- All cycles
- 2024: D+17.3 2020: D+20.6 2016: D+12.8 2012: D+21.1 2008: D+20.3
Not yet ingested
- Civics
- —
Market trends
- HPI YoY
- ▼ -39.50%
- Current HPI
- 316.8595
- Rent YoY
- —
- Metro
- Syracuse, NY
- State GDP YoY
- ▲ 2.60%
- F500 in state
- 92
Industry mix (Fortune 500 HQ in NY)
| Industry | F500 HQs | Revenue |
|---|---|---|
| Financial Services | 10 | $950B |
|
||
| Consumer Goods | 9 | $162B |
|
||
| Insurance | 4 | $225B |
|
||
| Telecommunications | 2 | $144B |
|
||
| Pharmaceuticals | 2 | $112B |
|
||
| Media / Entertainment | 2 | $69B |
|
||
Price history
+221.8% since first listed2 events — show timeline
- 2026-06-04 Listed $325,000 CNYIS
- 2005-05-17 Sold (Public Records) $101,000 Public Records
Property tax history
+4.4%/yrLatest (2025): $6,904 · +4.2% YoY. Source: county tax records.
Cash-flow waterfall
monthlySold comps — $/sqft
last 12 mo · ≤1 miLoading sold comps…