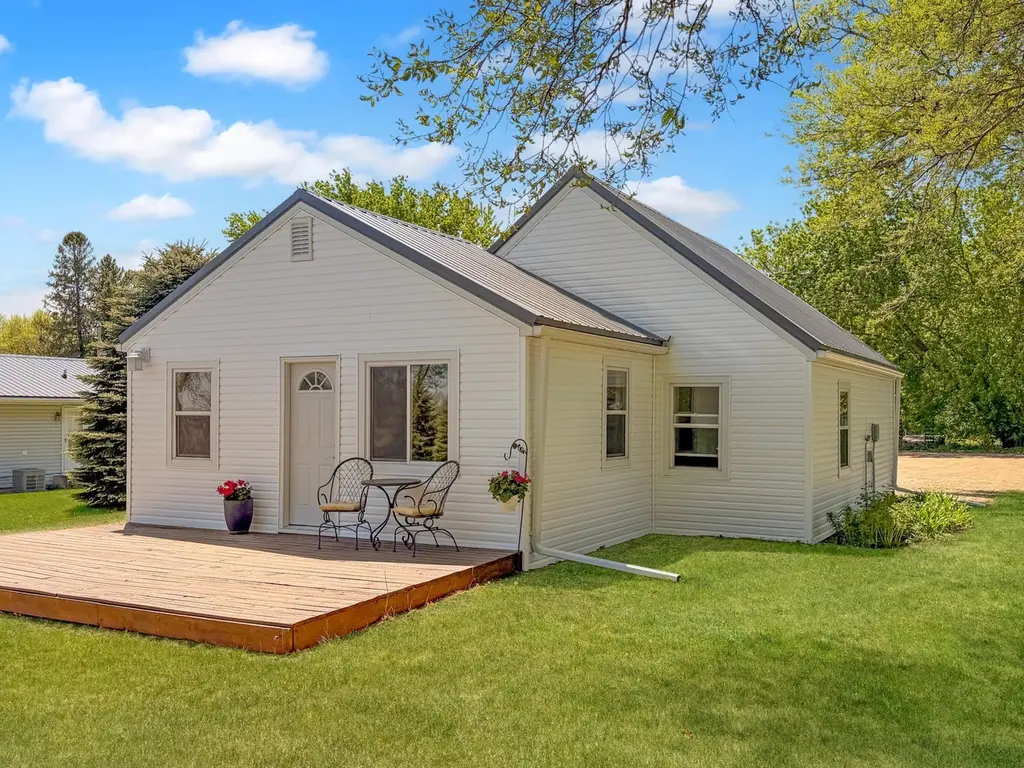
641 Summit Ave · Balaton, MN
Flood risk 1/10 · Minimal
- FEMA flood zone
- X (unshaded)
- Chance of flooding over 30 yrs
- 0.0%
- Est. flood insurance / yr
- $473 – $860
Fire risk 1/10 · Minimal
- Est. fire insurance / yr
- $888 – $1,650
Heat risk 2/10 · Minimal
- Hot days now (above 97°F)
- 7 days/yr
- Hot days in 30 yrs
- 14 days/yr
Wind risk 2/10 · Minimal
- Chance of severe wind over 30 yrs
- —
Air-quality risk 2/10 · Minimal
- Unhealthy air days now
- 1 days/yr
- Unhealthy air days in 30 yrs
- 1 days/yr
Risk factors via First Street. Map © Google.
Why this score? — see what drove the D grade
The composite is a weighted blend of 9 inputs, each scored 0–100. Each bar is that input's sub-score; the figure is the points it added to the 100-point composite (weight × sub-score).
- Appreciation +10.0/10.0
- ARV discount +7.5/15.0
- Cash flow +7.4/30.0
- Schools +5.0/10.0
- Livability +3.3/5.0
- Rent growth +2.5/5.0
- Condition / age +2.5/5.0
- 1% rule +1.8/10.0
- DSCR +1.6/10.0
$158,000
🖨 Deal sheet 📄 Offer letter ✓ Due diligence
Listing remarks
Move-in ready and packed with possibilities! This beautifully updated 2 bedroom, 1 bathroom home has been extensively renovated from top to bottom, featuring all new plumbing, electrical, fixtures, doors windows, siding, flooring, sheetrock, water heater complete bathroom renovation and even a new sewer line already in place. The thoughtfully optimized floor plan offers comfortable living with a perfect main floor location for a stackable washer and dryer, plus a bonus room in the 1/4 story that would make a great office, hobby room, guest space, or additional storage area. Outside is where this property really shines- the detached triple stall garage is extra deep and offers incredible fle
Key facts
- Updated electrical
- 12 foot door
- Updated plumbing
Tags
Property features AI
Finance
- Other: Lot approximately 0.38 acres (dimensions about 100 x 165); Above-grade finished area approximately 1,080; Main level finished area approximately 864; Living area approximately 1,080
Exterior
- Parking: Detached or attached 3-car garage (34 x 42 — ~1,324 sq. ft.)
- Utilities: City water connected; City sewer connected; Oil fuel
- Home design: Residential property; One story; Slab foundation
- Construction: Vinyl siding; Slab foundation
- Exterior features: Vinyl exterior
Interior
- Bedrooms: 2 bedrooms
- Bathrooms: 1 three-quarter bathroom
- Heating & cooling: Forced air heating; Window air conditioning units
- Interior features: No basement; One-level living
Neighborhood map
What this means for you Summary
Snapshot
- This is a 2-bed/1.0-bath single-family listed at $158k.
Deal economics
- At list price, monthly cash flow is $-202 ($-2k/yr) — negative.
- To cash-flow at today's rent, offer at most $122k (22.6% below list).
- To meet the 1% rule (rent ≥ 1% of price), the offer needs to be $107k (32.5% below list).
- Recommended offer: $107k (32.5% below list) — sets the bar for 1% rule.
Location & tenants
- Location reads 66/100 on livability (#477 in MN) — a middle-class / working-renter tenant base. Strengths: cost of living A+, housing A+, health & safety A+; Watch: crime D, schools F, amenities F.
- Market conditions: 52 active listings in the ZIP; 91 units permitted in Lyon County in 2024 (72 in 5+ unit buildings).
Forward outlook
- In year one you build about $17k of equity ($1k loan paydown + $16k appreciation (10.0% local appreciation)).
- Lyon County population projected at -12% by 2050 — secular population decline; favor cash flow + early exit over multi-decade hold.
- By year 3, paydown + projected appreciation supports a ~$43k cash-out refi (75% LTV) — recoverable capital for the next deal without selling this one.
Negotiation context
- It's been on market 33 days — a 3% lower offer ($153k) is reasonable based on typical stale-listing flexibility.
- Current owner paid $60k; list at $158k implies a 163% gain — meaningful room to come down on a strong offer.
Questions for the listing agent
- What do current leases actually rent for vs. the listed asking? Can we see a recent rent roll and the last 12 months of T-12 income?
- It's been on market 33 days. Have you received any prior offers? Is the seller open to a 32% concession, seller financing, or rate buy-down credit?
- Built in 1968 — when were the roof, HVAC, electrical panel, plumbing, and water heater last replaced?
- Is there a deadline driving the sale (1031 exchange, divorce, estate, relocation)? That informs how much negotiation room exists.
- Schools are F-rated, which usually means shorter tenancies and higher turnover. Who's the typical renter profile here, and what's been the actual vacancy rate?
- Crime grade is D in this area — have there been break-ins, vandalism, or insurance claims at this property in the last 3 years? What carrier currently insures it and at what premium?
- The area grade is low — what's the realistic commute time and amenity access for the typical tenant pool here? Any planned neighborhood developments (good or bad) we should know about?
- What's the average days-on-market for RENTAL listings here right now (not sales)? A rising rental-DOM trend means longer vacancies and softer asking-rent achievability than the comps imply.
- What's the recent tenant-quality profile in this submarket — average credit score on applications, eviction rate, late-payment / NSF rate, and stable-employment percentage? A property-management company in the area should have these aggregated.
- How much new for-sale + rental construction is in the pipeline within 1–3 miles? Heavy new supply typically softens prices + rents 12–24 months out; constrained supply supports both.
Investment metrics
- 1% rule
- 0.68% ✗
- Cap rate
- 4.76%
- Cash-on-cash
- -5.47%
- DSCR
- 0.76
- GRM
- 12.3
CMA / ARV
No comps found within radius.
Projected returns pro-forma
10.0% appreciation · 3.0% rent growth · sell at horizon
- IRR
- 20.4%
- Equity multiple
- 2.65×
- Total profit
- $73,183
- Equity at exit
- $142,339
- IRR
- 18.6%
- Equity multiple
- 6.10×
- Total profit
- $225,595
- Equity at exit
- $306,959
Cash invested: $44,240 (down + closing). Projections, not guarantees.
Landlord ↔ Tenant lean methodology
- Overall (STATE)
- 46 Balanced
- State Minnesota
- 46 Balanced · D+2
- County
- — inherits STATE
- City
- — inherits STATE
ZIP-level market 56115
- Home prices YoY
- 11.5%
- Active inventory
- 52
- Price-to-rent
- 12.3×
Monthly cashflow live
- Estimated rent
- $1,067 medium interval (Pro) →
- Mortgage (P&I)
- −$829
- Tax from tax record
- −$150 /mo · $1,804/yr
- Insurance
- −$66
- HOA
- −$0
- Vacancy / Maint / Mgmt
- −$224
- Net cashflow
- $-202
Break-even live
UW: 25.0% down · 7.5% · 30yr · 1.5% tax · 5.0% vac · 8.0% maint · 8.0% mgmt
Financing live
Cash to close
- Down payment
- $39,500
- Closing costs
- $4,740
- Reserves months
- —
- Total cash needed
- —
Loan-product check · same deal, 3 products live
Conventional
25% down · 7.5% · 30yr
- Down + closing
- —
- Monthly P&I
- —
- Monthly cashflow
- —
- DSCR
- —
- Eligible?
- —
Personal DTI + credit; lowest rate.
DSCR
20% down · 8.5% · 30yr
- Down + closing
- —
- Monthly P&I
- —
- Monthly cashflow
- —
- DSCR
- —
- Eligible?
- —
No personal income docs; deal must DSCR.
Hard money
10% down · 12.0% · 12mo
- Down + closing
- —
- Monthly P&I
- —
- Monthly cashflow
- —
- DSCR
- —
- Eligible?
- —
Short-term bridge; refi at stabilization.
Listing history 17 events
-
2026-06-19days on market $158,000 Active 33 DOM
-
2026-06-18days on market $158,000 Active 32 DOM
-
2026-06-17days on market $158,000 Active 31 DOM
-
2026-06-16days on market $158,000 Active 30 DOM
-
2026-06-15days on market $158,000 Active 29 DOM
-
2026-06-14pricedays on market $158,000 Active 27 DOM
-
2026-06-12days on market $165,000 Active 26 DOM
-
2026-06-08days on market $165,000 Active 22 DOM
-
2026-06-07days on market $165,000 Active 21 DOM
-
2026-06-05days on market $165,000 Active 19 DOM
-
2026-06-04days on market $165,000 Active 17 DOM
-
2026-06-02days on market $165,000 Active 16 DOM
-
2026-06-01days on market $165,000 Active 15 DOM
-
2026-05-31days on market $165,000 Active 14 DOM
-
2026-05-31days on market $165,000 Active 13 DOM
-
2026-05-17$165,000 Active
-
2025-09-10soldstatus $60,000
ⓘ Source: listings_history table (triggers on properties + properties_extension) + one-shot
backfill from property_details.listing_events for pre-trigger history.
Tax reassessment forecast MN · Partial reset (capped growth)
- Current annual tax
- $1,804 · $150/mo
- Projected year-2 tax
- $1,804 · $150/mo
- Expected delta
- $0/yr ($0/mo · 0.0%)
ⓘ Screening estimate from a state-policy table — verify with the county assessor before closing.
Climate risk First Street
- Flood 1/10 Low FEMA zone X (unshaded) · 0% chance over 30 yrs
- Wildfire 1/10 Low
- Heat 2/10 Low 7 d/yr ≥97°F today · 14 d/yr by 30 yrs out
- Wind 2/10 Low
- Air quality 2/10 Low 1 unhealthy d/yr today · 1 by 30 yrs out
Nearby sold comps map
Loading sold comps map…
Walkable amenities ~0.75 mi
Loading nearby amenities…
Taxation est. · year 1
- Rental income
- $12,804
- − Mortgage interest
- −$8,850
- − Property taxes
- −$1,804
- − Insurance
- −$790
- − Repairs & maintenance
- −$1,024
- − Management
- −$1,024
- − Depreciation
- −$4,596
- Taxable loss
- −$5,286
- Est. tax savings @ 24.0%
- +$1,269
- After-tax cash flow
- $-1,153/yr
For passive investors: Depreciation is non-cash, so a rental often shows a tax loss while cash-flowing — sheltering income. Rental losses are passive: they offset passive income freely, and up to $25,000/yr can offset ordinary (W-2) income if you actively participate and your MAGI is under $100k (phasing out to $0 by $150k); unused losses carry forward. On sale, claimed depreciation is recaptured at up to 25%, and gains may owe capital-gains tax (a 1031 exchange can defer both). Figures are a year-1 estimate at your 24.0% rate — not tax advice; consult a CPA.
Schools (NCES district)
No district data.
Livability — Balaton
- Score
- 66/100
- State rank
- #477
- US rank
- #11330
Category grades
Schools grade is shown separately in the Schools card above.
Census & demographics
- Census place
- Balaton, MN
- Population (ZIP)
- 1,262
Population outlook (Lyon County) Hauer SSP2
- Today (2025)
- 25,369 people
- By 2030
- 24,890 · -1.9%
- By 2040
- 23,599 · -7.0%
- By 2050
- 22,383 · -11.8%
- By 2075
- 20,076 · -20.9%
- By 2100
- 18,901 · -25.5%
Race, ethnicity, and origin ACS 2023
- Neighborhood character
- Predominantly White (93%)
- Race & ethnicity
- White 93% Two or more races 5% Hispanic / Latino 3%
- Common ancestry
- Portuguese 17% Iranian 6% Romanian 4%
- Foreign-born
- 1% · Canada
- Languages at home
- 98% English-only · Spanish 1%
Political lean MEDSL · Lyon
- 2024 margin
- Solid R (+31.8) · D 33.1% · R 64.9% · Other 2.0%
- 2008→2024 swing
- -30.2pp toward R · 2008: -1.6pp · 2024: -31.8pp
- All cycles
- 2024: R+31.8 2020: R+25.9 2016: R+28.3 2012: R+9.2 2008: R+1.6
Not yet ingested
- Civics
- —
Market trends
- HPI YoY
- ▲ 11.48%
- Current HPI
- 111.48
- Rent YoY
- —
- Metro
- —
- State GDP YoY
- ▲ 2.41%
- F500 in state
- 34
Industry mix (Fortune 500 HQ in MN)
| Industry | F500 HQs | Revenue |
|---|---|---|
| Healthcare | 2 | $407B |
|
||
| Retail | 2 | $150B |
|
||
| Consumer Goods | 2 | $32B |
|
||
| Industrial Machinery | 2 | $6B |
|
||
| Agriculture | 1 | $40B |
|
||
| Healthcare / Medical Devices | 1 | $32B |
|
||
Price history
+175.0% since first listed2 events — show timeline
- 2026-05-17 Listed $165,000 NORTHSTARMLS as Distributed by MLS Grid
- 2025-09-10 Sold (Public Records) $60,000 Public Records
Property tax history
+5.3%/yrLatest (2026): $1,804 · -1.1% YoY. Source: county tax records.
Cash-flow waterfall
monthlySold comps — $/sqft
last 12 mo · ≤1 miLoading sold comps…