844 S 1st Ave · Gibbon, MN
Flood risk 1/10 · Minimal
- FEMA flood zone
- —
- Chance of flooding over 30 yrs
- 0.0%
- Est. flood insurance / yr
- —
Fire risk 1/10 · Minimal
- Est. fire insurance / yr
- $888 – $1,650
Heat risk 2/10 · Minimal
- Hot days now (above 100°F)
- 7 days/yr
- Hot days in 30 yrs
- 15 days/yr
Wind risk 2/10 · Minimal
- Chance of severe wind over 30 yrs
- —
Air-quality risk 1/10 · Minimal
- Unhealthy air days now
- 0 days/yr
- Unhealthy air days in 30 yrs
- 0 days/yr
Risk factors via First Street. Map © Google.
Why this score? — see what drove the C+ grade
The composite is a weighted blend of 9 inputs, each scored 0–100. Each bar is that input's sub-score; the figure is the points it added to the 100-point composite (weight × sub-score).
- Cash flow +21.5/30.0
- Appreciation +7.6/10.0
- ARV discount +7.5/15.0
- DSCR +6.9/10.0
- 1% rule +6.8/10.0
- Schools +3.8/10.0
- Livability +3.3/5.0
- Rent growth +2.5/5.0
- Condition / age +2.5/5.0
$115,000
🖨 Deal sheet (PDF) 📄 Offer letter ✓ Due diligence
Listing remarks MLS
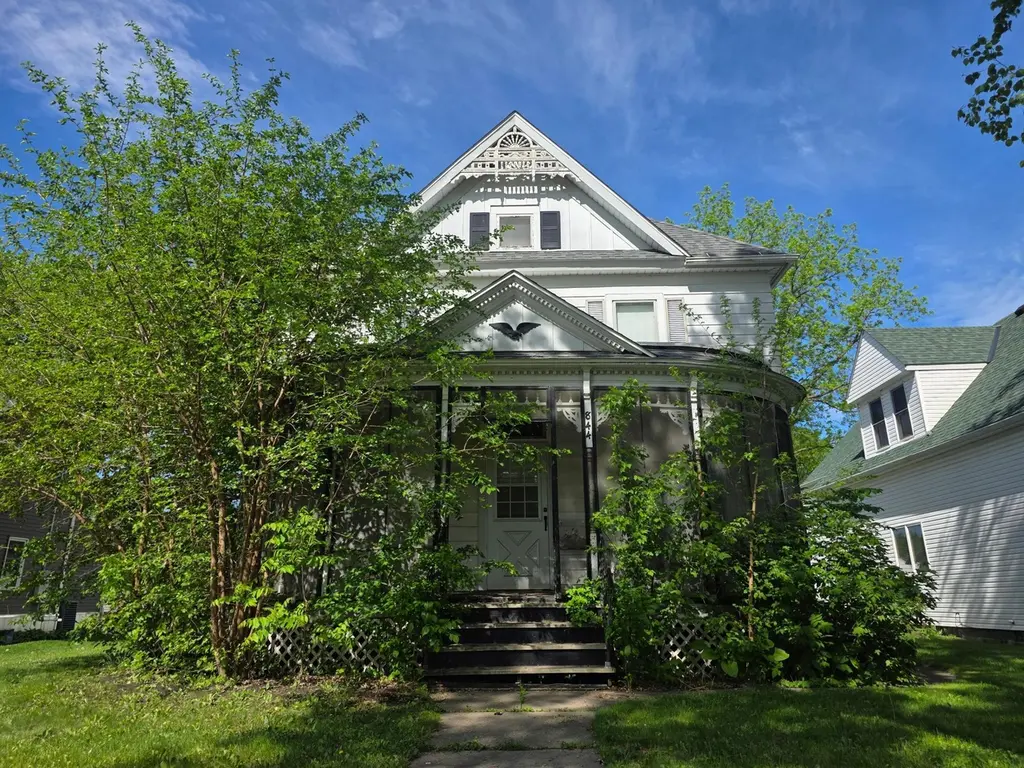
SUMMER NIGHTS ON THE SCREENED FRONT PORCH IN THE SWING . . .JUST A START OF THE OLD CHARM DISPLAYED THRU THIS 2+ STORY HOME.NEWER 2+ STALL GAR.4 BR ON ONE LEVEL.CLAWFOOT TUB.APPLIANCES STAY.HARDWOOD FLRS, STAINED GLASS, GREAT OLD WOODWORK.ALUMINUM SIDING.
Key facts
- 9,931 sq ft lot
- 2 garage spots
- Built 1915
Property features AI
Exterior
- Parking: Gravel parking; 2-car garage (32 x 31, 8' garage door height)
- Utilities: City water (connected); City sewer (connected); Natural gas fuel; Electric service available
- Home design: Residential property; More than 2 stories; Above-grade finished living area approximately 2,810 (total above grade 2,882); below-grade area approximately 1,405; Other structure: attached garage(s)
- Construction: Frame construction; Roof age 8 years or newer; Foundation dimensions: 32 x 36 and 23 x 11
- Exterior features: Front porch; Metal exterior; Light tree coverage
Interior
- Kitchen: Range; Refrigerator
- Bedrooms: 4 bedrooms (4 on one level)
- Bathrooms: 2 full bathrooms; additional 3/4 bath on main floor; basement rough-in for bath
- Heating & cooling: Forced air heating; Central air conditioning
- Interior features: Eat-in kitchen and separate/formal dining room; Full, unfinished basement
- Laundry & utility: Washer and dryer; Laundry in basement
Neighborhood map
What this means for you Summary
Snapshot
- This is a 4-bed/2.0-bath single-family listed at $115k.
Deal economics
- At list price, monthly cash flow is $172 ($2k/yr) — positive.
- The deal already cash-flows at list — no discount required.
- Meets the 1% rule at list price ($1k rent vs $115k).
- Recommended offer: $113k (1.5% below list) — sets the bar for market timing.
Location & tenants
- Location reads 66/100 on livability (#503 in MN) — a middle-class / working-renter tenant base. Strengths: cost of living A+, housing A+; Watch: employment C-, health & safety D+, amenities F.
- G.F.W. (rural): math 40% / reading 48% proficiency, ranked #186 of 301 in MN (top 62%) — families likely to look elsewhere, expect single-tenant / working-renter base with shorter leases.
- Market conditions: 8 active listings in the ZIP; 27 units permitted in Sibley County in 2024 (0 in 5+ unit buildings).
Forward outlook
- In year one you build about $7k of equity ($795 loan paydown + $6k appreciation (5.3% local appreciation)).
- Sibley County population projected at -16% by 2050 — secular population decline; favor cash flow + early exit over multi-decade hold.
- At projected returns (5.3% appreciation + 3.0% rent growth), your $32k cash investment doubles in ~4 years — after that, you're playing with house money.
- By year 5, paydown + projected appreciation supports a ~$30k cash-out refi (75% LTV) — recoverable capital for the next deal without selling this one.
Negotiation context
- It's been on market 18 days — a 2% lower offer ($113k) is reasonable based on typical stale-listing flexibility.
- Current owner paid $85k; 35% above their basis — modest negotiation headroom, anchor on the comps not their cost.
Risks & watch-outs
- Watch-outs: property tax is 2.6% of price; built in 1915 — expect roof / HVAC / electrical / plumbing capex.
Questions for the listing agent
- Built in 1915 — when were the roof, HVAC, electrical panel, plumbing, and water heater last replaced?
- Property tax is high relative to price — has the assessment been appealed recently, and will the sale trigger a re-assessment?
- Is there a deadline driving the sale (1031 exchange, divorce, estate, relocation)? That informs how much negotiation room exists.
- What's the average days-on-market for RENTAL listings here right now (not sales)? A rising rental-DOM trend means longer vacancies and softer asking-rent achievability than the comps imply.
- What's the recent tenant-quality profile in this submarket — average credit score on applications, eviction rate, late-payment / NSF rate, and stable-employment percentage? A property-management company in the area should have these aggregated.
- How much new for-sale + rental construction is in the pipeline within 1–3 miles? Heavy new supply typically softens prices + rents 12–24 months out; constrained supply supports both.
Investment metrics
- 1% rule
- 1.18% ✓
- Cap rate
- 8.09%
- Cash-on-cash
- 6.42%
- DSCR
- 1.29
- GRM
- 7.1
CMA / ARV
- ARV (on-the-fly)
- $320,340
- Comps found
- 1
Show comp detail 1 sale within ~0.75 mi
| Address | Dist | Beds/Ba | Sqft | Sold | Price | $/sf | Match |
|---|---|---|---|---|---|---|---|
| 124 W 7th St | 0.18mi | 3/3.0 (-1) | 2,753 (-2%) | 3mo | $315,000 | $114 | 77 |
Match score weights: distance 35% · size 25% · config 20% · recency 20%. Top-matched comps best support the ARV.
Projected returns pro-forma
5.29% appreciation · 3.0% rent growth · sell at horizon
- IRR
- 19.1%
- Equity multiple
- 2.23×
- Total profit
- $39,481
- Equity at exit
- $67,213
- IRR
- 18.9%
- Equity multiple
- 4.39×
- Total profit
- $109,188
- Equity at exit
- $117,726
Cash invested: $32,200 (down + closing). Projections, not guarantees.
Landlord ↔ Tenant lean methodology
- Overall (STATE)
- 46 Balanced
- State Minnesota
- 46 Balanced · D+2
- County
- — inherits STATE
- City
- — inherits STATE
ZIP-level market 55335
- Home prices YoY
- 2.8%
- Active inventory
- 8
- Price-to-rent
- 7.1×
Monthly cashflow live
- Estimated rent
- $1,359 medium interval (Pro) →
- Mortgage (P&I)
- −$603
- Tax from tax record
- −$251 /mo · $3,008/yr
- Insurance
- −$48
- HOA
- −$0
- Vacancy / Maint / Mgmt
- −$285
- Net cashflow
- $172
Break-even live
Sensitivity live
| Price | -10% $237 | -5% $205 | +0% $172 | +5% $140 | +10% $107 |
|---|---|---|---|---|---|
| Rent | -10% $65 | -5% $119 | +0% $172 | +5% $226 | +10% $280 |
| Rate | -1.0pp $230 | -0.5pp $201 | base $172 | +0.5pp $142 | +1.0pp $112 |
UW: 25.0% down · 7.5% · 30yr · 1.5% tax · 5.0% vac · 8.0% maint · 8.0% mgmt
Financing live
Cash to close
- Down payment
- $28,750
- Closing costs
- $3,450
- Reserves months
- —
- Total cash needed
- —
Loan-product check · same deal, 3 products live
Conventional
25% down · 7.5% · 30yr
- Down + closing
- —
- Monthly P&I
- —
- Monthly cashflow
- —
- DSCR
- —
- Eligible?
- —
Personal DTI + credit; lowest rate.
DSCR
20% down · 8.5% · 30yr
- Down + closing
- —
- Monthly P&I
- —
- Monthly cashflow
- —
- DSCR
- —
- Eligible?
- —
No personal income docs; deal must DSCR.
Hard money
10% down · 12.0% · 12mo
- Down + closing
- —
- Monthly P&I
- —
- Monthly cashflow
- —
- DSCR
- —
- Eligible?
- —
Short-term bridge; refi at stabilization.
Listing history 14 events
-
2026-06-21days on market $115,000 Active 18 DOM
-
2026-06-18days on market $115,000 Active 16 DOM
-
2026-06-17days on market $115,000 Active 15 DOM
-
2026-06-16days on market $115,000 Active 14 DOM
-
2026-06-15days on market $115,000 Active 13 DOM
-
2026-06-13days on market $115,000 Active 11 DOM
-
2026-06-12pricedays on market $115,000 Active 10 DOM
-
2026-06-09days on market $125,000 Active 7 DOM
-
2026-06-08days on market $125,000 Active 6 DOM
-
2026-06-07days on market $125,000 Active 5 DOM
-
2026-06-07days on market $125,000 Active 4 DOM
-
2026-06-04status $125,000 Active 1 DOM
-
2026-06-01remarks 681-char remark
-
2026-06-01$125,000 Coming Soon 1 DOM
ⓘ Source: listings_history table (triggers on properties + properties_extension) + one-shot
backfill from property_details.listing_events for pre-trigger history.
Tax reassessment forecast MN · Partial reset (capped growth)
- Current annual tax
- $3,008 · $251/mo
- Projected year-2 tax
- $3,008 · $251/mo
- Expected delta
- $0/yr ($0/mo · 0.0%)
ⓘ Screening estimate from a state-policy table — verify with the county assessor before closing.
Climate risk First Street
- Flood 1/10 Low 0% chance over 30 yrs
- Wildfire 1/10 Low
- Heat 2/10 Low 7 d/yr ≥100°F today · 15 d/yr by 30 yrs out
- Wind 2/10 Low
- Air quality 1/10 Low 0 unhealthy d/yr today · 0 by 30 yrs out
Nearby sold comps map
Loading sold comps map…
Walkable amenities ~0.75 mi
Loading nearby amenities…
Taxation est. · year 1
- Rental income
- $16,312
- − Mortgage interest
- −$6,442
- − Property taxes
- −$3,008
- − Insurance
- −$575
- − Repairs & maintenance
- −$1,305
- − Management
- −$1,305
- − Depreciation
- −$3,345
- Taxable income
- $332
- Est. tax owed @ 24.0%
- −$80
- After-tax cash flow
- $1,987/yr
For passive investors: Depreciation is non-cash, so a rental often shows a tax loss while cash-flowing — sheltering income. Rental losses are passive: they offset passive income freely, and up to $25,000/yr can offset ordinary (W-2) income if you actively participate and your MAGI is under $100k (phasing out to $0 by $150k); unused losses carry forward. On sale, claimed depreciation is recaptured at up to 25%, and gains may owe capital-gains tax (a 1031 exchange can defer both). Figures are a year-1 estimate at your 24.0% rate — not tax advice; consult a CPA.
Schools (NCES district)
- District
- G.F.W.
- NCES district ID
- 2712580
- Math proficiency
- 40% ▼ -12.00%
- Reading proficiency
- 48% ▼ -13.00%
- Median HH income
- $50,233
- Composite
- 37.81/100
- National rank
- #4335
- State rank
- #186 of 301 in MN
Livability — Gibbon
- Score
- 66/100
- State rank
- #503
- US rank
- #12030
Category grades
Schools grade is shown separately in the Schools card above.
Census & demographics
- Census place
- Gibbon, MN
- Population (ZIP)
- 1,633
Population outlook (Sibley County) Hauer SSP2
- Today (2025)
- 14,246 people
- By 2030
- 13,850 · -2.8%
- By 2040
- 12,941 · -9.2%
- By 2050
- 11,946 · -16.1%
- By 2075
- 10,410 · -26.9%
- By 2100
- 9,444 · -33.7%
Race, ethnicity, and origin ACS 2023
- Neighborhood character
- Predominantly White (90%)
- Race & ethnicity
- White 90% Hispanic / Latino 6% Two or more races 4% Black 1%
- Hispanic origin (detail)
- Mexican 3%
- Common ancestry
- Portuguese 8% Romanian 3% Iranian 1%
- Foreign-born
- 2% · Canada
- Languages at home
- 97% English-only · Spanish 2% German/W. Germanic 1%
Political lean MEDSL · Sibley
- 2024 margin
- Solid R (+43.0) · D 27.6% · R 70.7% · Other 1.7%
- 2008→2024 swing
- -23.7pp toward R · 2008: -19.3pp · 2024: -43.0pp
- All cycles
- 2024: R+43.0 2020: R+40.8 2016: R+41.9 2012: R+22.8 2008: R+19.3
Not yet ingested
- Civics
- —
Market trends
- HPI YoY
- ▲ 5.29%
- Current HPI
- 197.6521
- Rent YoY
- —
- Metro
- —
- State GDP YoY
- ▲ 2.41%
- F500 in state
- 34
Industry mix (Fortune 500 HQ in MN)
| Industry | F500 HQs | Revenue |
|---|---|---|
| Healthcare | 2 | $407B |
|
||
| Retail | 2 | $150B |
|
||
| Consumer Goods | 2 | $32B |
|
||
| Industrial Machinery | 2 | $6B |
|
||
| Agriculture | 1 | $40B |
|
||
| Healthcare / Medical Devices | 1 | $32B |
|
||
Price history
+47.2% since first listed4 events — show timeline
- 2026-06-01 Coming Soon $125,000 NORTHSTARMLS as Distributed by MLS Grid
- 2005-11-04 Sold (MLS) $85,000 NORTHSTARMLS as Distributed by MLS Grid
- 2005-09-26 Listing Removed — NORTHSTARMLS as Distributed by MLS Grid
- 2005-05-13 Listed $84,900 NORTHSTARMLS as Distributed by MLS Grid
Property tax history
+6.0%/yrLatest (2026): $3,008 · -0.3% YoY. Source: county tax records.
Cash-flow waterfall
monthlySold comps — $/sqft
last 12 mo · ≤1 miLoading sold comps…