 Fourplex
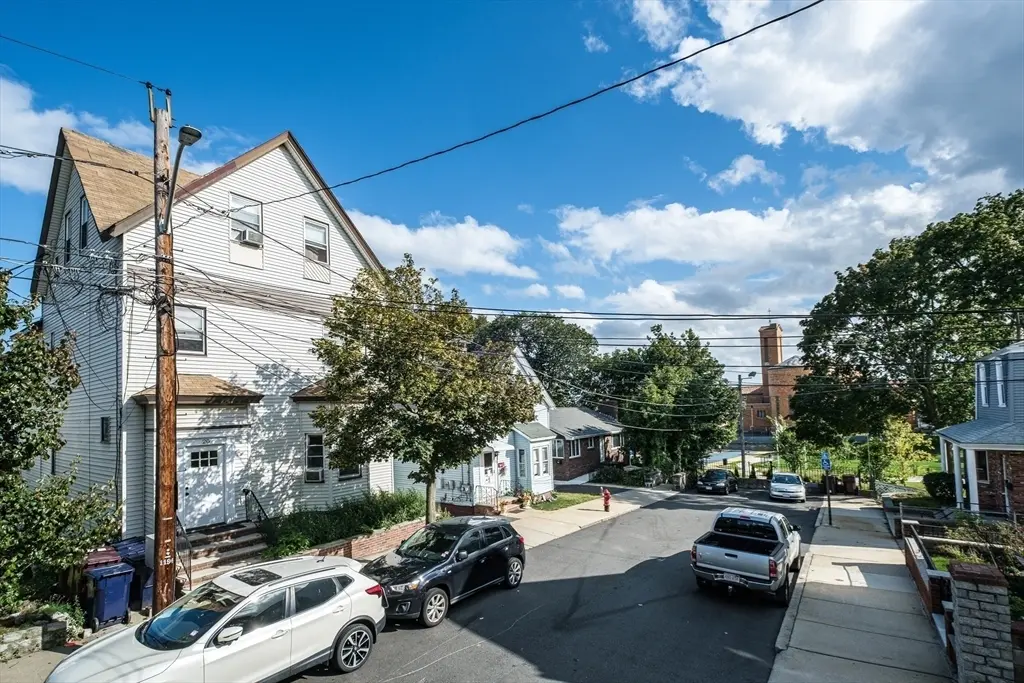
20 Hatch St · Everett, MA
Flood risk 4/10 · Minor
- FEMA flood zone
- X (unshaded)
- Chance of flooding over 30 yrs
- 0.22%
- Est. flood insurance / yr
- $473 – $860
Fire risk 1/10 · Minimal
- Est. fire insurance / yr
- $915 – $1,699
Heat risk 6/10 · Moderate
- Hot days now (above 96°F)
- 7 days/yr
- Hot days in 30 yrs
- 15 days/yr
Wind risk 6/10 · Moderate
- Chance of severe wind over 30 yrs
- 67.0%
Air-quality risk 3/10 · Minor
- Unhealthy air days now
- 3 days/yr
- Unhealthy air days in 30 yrs
- 3 days/yr
Risk factors via First Street. Map © Google.
Why this score? — see what drove the C+ grade
The composite is a weighted blend of 9 inputs, each scored 0–100. Each bar is that input's sub-score; the figure is the points it added to the 100-point composite (weight × sub-score).
- Cash flow +30.0/30.0
- DSCR +10.0/10.0
- 1% rule +8.1/10.0
- Livability +4.0/5.0
- Rent growth +3.0/5.0
- Condition / age +2.5/5.0
- Schools +1.8/10.0
- ARV discount +1.7/15.0
- Appreciation +0.0/10.0
$1,149,000
🖨 Deal sheet 📄 Offer letter ✓ Due diligence
Multi-family units
County records classify this as Multi-Family (5+ Unit). Listing-text estimate: 4 units. estimate disagrees with records
5+ unit building — per-unit beds/baths from public records are typically unavailable; the breakdown below (if shown) is an estimate from the listing text.
Listing remarks MLS
Great investment opportunity! Perfect property for an investor or owner occupant. 4 unit multi-family on a beautiful, quiet, dead end street. Excellent location in Everett with easy access to restaurants, public transporation and Boston. Just over 1 mile to the new Encore casino. 6 total bedrooms and 4 bathrooms on 3 levels. OFF STREET parking for at least 6 cars! New hardwood floors in 3 out of 4 units, as well as 4 new water heaters. All seperate utilities. One unit is owner occupied and the other three are TAW and below market rents. Many possibilities for a savvy investor. Do not miss this! Offers to be reviewed Monday July 26th at 4pm. Seller reserves right to accept an offer beforehand.
Key facts
- In-building laundry
- Separate utilities
- Off-street parking
Tags
Property features AI
Finance
- HOA & community: Near public transportation, T-station access, shopping, medical facility, laundromat, highway access, and places of worship
Exterior
- Parking: 6 off-street parking spaces; Paved driveway and shared driveway
- Utilities: Public water; Public sewer; Gas available for range and oven
- Home design: 4-family up/down configuration; 4 total stories
- Construction: Block foundation; Built (year per public records)
- Exterior features: Public road frontage; 0.09-acre lot
Interior
- Flooring: Carpet; Hardwood; Varied flooring
- Bathrooms: 4 full bathrooms
- Interior features: 13 total rooms; Unfinished basement
Neighborhood map
What this means for you Summary
Snapshot
- This is a 4 × 6-bed/4.0-bath units multifamily listed at $1.15M.
Deal economics
- At list price, monthly cash flow is $4k ($54k/yr) — positive. Per door: $1k/mo.
- The deal already cash-flows at list — no discount required.
- Meets the 1% rule at list price ($15k rent vs $1.15M).
- Recommended offer: $1.11M (3.0% below list) — sets the bar for market timing.
- Cap rate 11.0% vs local median 3.8% in Everett — top-decile yield for the area; either an underpriced asset or a hidden risk that comps aren't pricing in. Stress-test before assuming the spread holds.
Location & tenants
- Location reads 80/100 on livability (#35 in MA, #1,665 nationally) — a professional / high-income tenant draw. Strengths: amenities A+, commute A+, health & safety A+; Watch: cost of living F.
- Everett (suburban): math 15% / reading 26% proficiency, ranked #289 of 302 in MA (top 96%) — low school quality limits family demand, transient renter base, plan for 1-2y turnover; 69% free/reduced lunch — lower-income household profile, screen leases tightly.
- Market conditions: Rents rising (+2.0%/yr); 45 active listings in the ZIP; 1 comparable units currently listed for rent nearby; solid renter incomes; 3,670 units permitted in Middlesex County in 2024 (2,611 in 5+ unit buildings).
- At $15,090/mo this rent would consume 212% of the median local household income ($85k/yr) (locally 2888% of renters already pay >50% of income on rent) — very limited rent-growth headroom before tenants either downsize or default.
Forward outlook
- Local home prices are declining (-3.0%/yr); year-one equity from $8k of loan paydown is wiped out by about $34k of value loss. Plan a longer hold.
- Middlesex County population projected at +20% by 2050 — long-run rental-demand tailwind backs the buy-and-hold thesis.
- At projected returns (-3.0% appreciation + 2.0% rent growth), your $322k cash investment doubles in ~8 years — after that, you're playing with house money.
Negotiation context
- It's been on market 50 days — a 3% lower offer ($1.11M) is reasonable based on typical stale-listing flexibility.
- 2 sale attempts since 5y ago with the ask held roughly flat each time — persistent listings suggest the price (not the market) is what's stuck; bring a comps-based counter.
Risks & watch-outs
- Watch-outs: built in 1880 — expect roof / HVAC / electrical / plumbing capex.
- Climate carrying-cost: major wind risk, 67% chance of damaging wind over 30y; extreme-heat days projected 7→15/yr by 2055 (HVAC capex compounding) — expect insurance premiums to compound above CPI over the hold.
Questions for the listing agent
- It's been on market 50 days. Have you received any prior offers? Is the seller open to a 3% concession, seller financing, or rate buy-down credit?
- Can we see the unit-by-unit rent roll, current vacancy, and any below-market leases? What's the average tenancy length?
- What capital expenditures (roof, boiler, parking lot, exteriors) have been made in the last 5 years, and what's planned in the next 2?
- Built in 1880 — when were the roof, HVAC, electrical panel, plumbing, and water heater last replaced?
- Is there a deadline driving the sale (1031 exchange, divorce, estate, relocation)? That informs how much negotiation room exists.
- What's the average days-on-market for RENTAL listings here right now (not sales)? A rising rental-DOM trend means longer vacancies and softer asking-rent achievability than the comps imply.
- What's the recent tenant-quality profile in this submarket — average credit score on applications, eviction rate, late-payment / NSF rate, and stable-employment percentage? A property-management company in the area should have these aggregated.
- How much new apartment / multifamily construction is in the pipeline within 1–3 miles? Heavy new supply (>2% of stock underway) typically softens rents 12–24 months out; light construction supports rent growth.
Investment metrics
- 1% rule
- 1.31% ✓
- Cap rate
- 10.95%
- Cash-on-cash
- 16.65%
- DSCR
- 1.74
- GRM
- 6.3
CMA / ARV
- ARV (median comp)
- $1,016,839
- List price
- $1,149,000
- Delta
- 13.00%
- Verdict
- OVERPRICED
- Comps
- 20 within 1.0 mi
Show comp detail 12 sales within ~0.75 mi
| Address | Dist | Beds/Ba | Sqft | Sold | Price | $/sf | Match |
|---|---|---|---|---|---|---|---|
| 44-46 Cabot St | 0.33mi | 6/3.0 | 3,241 (+1%) | 2mo | $1,075,000 | $332 | 78 |
| 6-8 Christina Cir | 0.26mi | 6/3.0 | 3,400 (+6%) | 4mo | $1,000,000 | $294 | 70 |
| 17 Upland Rd | 0.53mi | 6/4.0 | 3,378 (+5%) | 1mo | $1,100,000 | $326 | 66 |
| 7-9 Gladstone St | 0.23mi | 6/3.0 | 2,929 (-9%) | 6mo | $980,000 | $335 | 65 |
| 7 Hampshire St | 0.40mi | 5/3.5 (-1) | 3,367 (+5%) | 1mo | $1,255,000 | $373 | 65 |
| 139-141 Bucknam St | 0.44mi | 6/3.0 | 3,454 (+8%) | 2mo | $1,042,000 | $302 | 61 |
| 7 Andrew | 0.42mi | 6/3.5 | 2,873 (-10%) | 8mo | $930,000 | $324 | 54 |
| 37 Argyle St | 0.41mi | 7/3.0 (+1) | 2,860 (-11%) | 1mo | $980,000 | $343 | 53 |
| 32-34 Harley Ave | 0.52mi | 6/2.5 | 2,835 (-12%) | 2mo | $959,900 | $339 | 49 |
| 105 Summer St | 0.54mi | 6/2.0 | 2,843 (-11%) | 1mo | $885,000 | $311 | 47 |
| 139-141 Bradford St | 0.64mi | 7/2.0 (+1) | 2,966 (-8%) | 0mo | $985,000 | $332 | 45 |
| 39-41 Kinsman St | 0.45mi | 5/3.0 (-1) | 2,760 (-14%) | 5mo | $990,000 | $359 | 42 |
Match score weights: distance 35% · size 25% · config 20% · recency 20%. Top-matched comps best support the ARV.
Projected returns pro-forma
-3.0% appreciation · 2.03% rent growth · sell at horizon
- IRR
- 6.7%
- Equity multiple
- 1.26×
- Total profit
- $83,451
- Equity at exit
- $171,320
- IRR
- 15.2%
- Equity multiple
- 2.18×
- Total profit
- $379,764
- Equity at exit
- $99,345
Cash invested: $321,720 (down + closing). Projections, not guarantees.
Landlord ↔ Tenant lean methodology
- Overall (STATE)
- 20 Strongly Tenant-Friendly
- State Massachusetts
- 20 Strongly Tenant-Friendly · D+15
- County
- — inherits STATE
- City
- — inherits STATE
ZIP-level market 02149
- Home prices YoY
- -24.2%
- Rents YoY
- 2.0%
- Active inventory
- 45
- Price-to-rent
- 25.4×
Monthly cashflow live
- Estimated rent
- $15,090 medium interval (Pro) →
- Mortgage (P&I)
- −$6,025
- Tax from tax record
- −$953 /mo · $11,438/yr
- Insurance
- −$479
- HOA
- −$0
- Vacancy / Maint / Mgmt
- −$3,169
- Net cashflow
- $4,464
Break-even live
4-unit breakdown (identical units grouped — click to expand)
| Units | Beds | Baths | Est. rent |
|---|---|---|---|
| 4× units | 6 | 4 | $15,092 |
| #1 | 6 | 4 | $3,773 |
| #2 | 6 | 4 | $3,773 |
| #3 | 6 | 4 | $3,773 |
| #4 | 6 | 4 | $3,773 |
| Total (4 units) | $15,090 | ||
UW: 25.0% down · 7.5% · 30yr · 1.5% tax · 5.0% vac · 8.0% maint · 8.0% mgmt
Financing live
Cash to close
- Down payment
- $287,250
- Closing costs
- $34,470
- Reserves months
- —
- Total cash needed
- —
Loan-product check · same deal, 3 products live
Conventional
25% down · 7.5% · 30yr
- Down + closing
- —
- Monthly P&I
- —
- Monthly cashflow
- —
- DSCR
- —
- Eligible?
- —
Personal DTI + credit; lowest rate.
DSCR
20% down · 8.5% · 30yr
- Down + closing
- —
- Monthly P&I
- —
- Monthly cashflow
- —
- DSCR
- —
- Eligible?
- —
No personal income docs; deal must DSCR.
Hard money
10% down · 12.0% · 12mo
- Down + closing
- —
- Monthly P&I
- —
- Monthly cashflow
- —
- DSCR
- —
- Eligible?
- —
Short-term bridge; refi at stabilization.
Rent comps 1 comps
| Address | Beds | Baths | Sqft | Rent | $/sqft | DOM | Units | Dist |
|---|---|---|---|---|---|---|---|---|
| 51 Ashland St Unit 2 Everett, MA | 5.0 | 2.0 | 2500 | $4,000 | $1.60 | 24d | 1 | 0.68mi |
Listing history 20 events
-
2026-06-18days on market $1,149,000 Active 50 DOM
-
2026-06-17days on market $1,149,000 Active 49 DOM
-
2026-06-16days on market $1,149,000 Active 48 DOM
-
2026-06-15days on market $1,149,000 Active 47 DOM
-
2026-06-13days on market $1,149,000 Active 45 DOM
-
2026-06-13days on market $1,149,000 Active 44 DOM
-
2026-06-09days on market $1,149,000 Active 41 DOM
-
2026-06-08statusdays on market $1,149,000 Active 40 DOM
-
2026-06-07pricestatusdays on market $1,149,000 Price Changed 39 DOM
-
2026-06-04days on market $1,199,000 Active 36 DOM
-
2026-06-03days on market $1,199,000 Active 35 DOM
-
2026-06-02days on market $1,199,000 Active 34 DOM
-
2026-06-01days on market $1,199,000 Active 33 DOM
-
2026-05-31days on market $1,199,000 Active 32 DOM
-
2026-04-29$1,199,000 New 924-char remark
-
2021-09-16soldstatus $1,000,000 Sold 701-char remark
Show marketing remark (701 chars)
Great investment opportunity! Perfect property for an investor or owner occupant. 4 unit multi-family on a beautiful, quiet, dead end street. Excellent location in Everett with easy access to restaurants, public transporation and Boston. Just over 1 mile to the new Encore casino. 6 total bedrooms and 4 bathrooms on 3 levels. OFF STREET parking for at least 6 cars! New hardwood floors in 3 out of 4 units, as well as 4 new water heaters. All seperate utilities. One unit is owner occupied and the other three are TAW and below market rents. Many possibilities for a savvy investor. Do not miss this! Offers to be reviewed Monday July 26th at 4pm. Seller reserves right to accept an offer beforehand.
-
2021-08-09status Under Agreement 701-char remark
Show marketing remark (701 chars)
Great investment opportunity! Perfect property for an investor or owner occupant. 4 unit multi-family on a beautiful, quiet, dead end street. Excellent location in Everett with easy access to restaurants, public transporation and Boston. Just over 1 mile to the new Encore casino. 6 total bedrooms and 4 bathrooms on 3 levels. OFF STREET parking for at least 6 cars! New hardwood floors in 3 out of 4 units, as well as 4 new water heaters. All seperate utilities. One unit is owner occupied and the other three are TAW and below market rents. Many possibilities for a savvy investor. Do not miss this! Offers to be reviewed Monday July 26th at 4pm. Seller reserves right to accept an offer beforehand.
-
2021-07-27historical Contingent 701-char remark
Show marketing remark (701 chars)
Great investment opportunity! Perfect property for an investor or owner occupant. 4 unit multi-family on a beautiful, quiet, dead end street. Excellent location in Everett with easy access to restaurants, public transporation and Boston. Just over 1 mile to the new Encore casino. 6 total bedrooms and 4 bathrooms on 3 levels. OFF STREET parking for at least 6 cars! New hardwood floors in 3 out of 4 units, as well as 4 new water heaters. All seperate utilities. One unit is owner occupied and the other three are TAW and below market rents. Many possibilities for a savvy investor. Do not miss this! Offers to be reviewed Monday July 26th at 4pm. Seller reserves right to accept an offer beforehand.
-
2021-07-21$949,000 New 701-char remark
Show marketing remark (701 chars)
Great investment opportunity! Perfect property for an investor or owner occupant. 4 unit multi-family on a beautiful, quiet, dead end street. Excellent location in Everett with easy access to restaurants, public transporation and Boston. Just over 1 mile to the new Encore casino. 6 total bedrooms and 4 bathrooms on 3 levels. OFF STREET parking for at least 6 cars! New hardwood floors in 3 out of 4 units, as well as 4 new water heaters. All seperate utilities. One unit is owner occupied and the other three are TAW and below market rents. Many possibilities for a savvy investor. Do not miss this! Offers to be reviewed Monday July 26th at 4pm. Seller reserves right to accept an offer beforehand.
-
1989-01-30soldstatus $216,000
ⓘ Source: listings_history table (triggers on properties + properties_extension) + one-shot
backfill from property_details.listing_events for pre-trigger history.
Tax reassessment forecast MA · Partial reset (capped growth)
- Current annual tax
- $11,438 · $953/mo
- Projected year-2 tax
- $12,785 · $1,065/mo
- Expected delta
- +$1,347/yr (+$112/mo · 11.8%)
ⓘ Screening estimate from a state-policy table — verify with the county assessor before closing.
Climate risk First Street
- Flood 4/10 Moderate FEMA zone X (unshaded) · 22% chance over 30 yrs
- Wildfire 1/10 Low
- Heat 6/10 Major 7 d/yr ≥96°F today · 15 d/yr by 30 yrs out
- Wind 6/10 Major 67% chance of damaging wind over 30 yrs
- Air quality 3/10 Moderate 3 unhealthy d/yr today · 3 by 30 yrs out
Nearby sold comps map
Loading sold comps map…
Walkable amenities ~0.75 mi
Loading nearby amenities…
Taxation est. · year 1
- Rental income
- $181,080
- − Mortgage interest
- −$64,362
- − Property taxes
- −$11,438
- − Insurance
- −$5,745
- − Repairs & maintenance
- −$14,486
- − Management
- −$14,486
- − Depreciation
- −$33,425
- Taxable income
- $37,137
- Est. tax owed @ 24.0%
- −$8,913
- After-tax cash flow
- $44,652/yr
For passive investors: Depreciation is non-cash, so a rental often shows a tax loss while cash-flowing — sheltering income. Rental losses are passive: they offset passive income freely, and up to $25,000/yr can offset ordinary (W-2) income if you actively participate and your MAGI is under $100k (phasing out to $0 by $150k); unused losses carry forward. On sale, claimed depreciation is recaptured at up to 25%, and gains may owe capital-gains tax (a 1031 exchange can defer both). Figures are a year-1 estimate at your 24.0% rate — not tax advice; consult a CPA.
Schools (NCES district)
- District
- Everett
- NCES district ID
- 2504770
- Math proficiency
- 15% ▼ -22.00%
- Reading proficiency
- 26% ▼ -12.00%
- Median HH income
- $51,780
- Composite
- 18.46/100
- National rank
- #8926
- State rank
- #289 of 302 in MA
Livability — Everett
- Score
- 80/100
- State rank
- #35
- US rank
- #1665
Category grades
Schools grade is shown separately in the Schools card above.
Census & demographics
- Census place
- Everett, MA
- County
- Middlesex County · 1,437,704 people
- City population
- 50,045
- Metro
- Boston-Cambridge-Newton, MA-NH
- Population (ZIP)
- 50,045
- Household income
- $85,218
- Rent vs Own
- Severe rent burden
- 2888.0
Population outlook (Middlesex County) Hauer SSP2
- Today (2025)
- 1,740,269 people
- By 2030
- 1,817,187 · +4.4%
- By 2040
- 1,963,195 · +12.8%
- By 2050
- 2,087,461 · +20.0%
- By 2075
- 2,344,036 · +34.7%
- By 2100
- 2,383,776 · +37.0%
Race, ethnicity, and origin ACS 2023
- Neighborhood character
- Highly diverse neighborhood (Simpson 0.74)
- Race & ethnicity
- White 38% Hispanic / Latino 31% Two or more races 23% Black 12% Asian 8%
- Hispanic origin (detail)
- Mexican 1% Puerto Rican 4%
- Common ancestry
- Estonian 10% Hispanic 5% Russian 3%
- Foreign-born
- 45% · Canada, Vietnam, China
- Languages at home
- 37% English-only · Spanish 26% Other Indo-European 22% French/Haitian/Cajun 8%
Political lean MEDSL · Middlesex
- 2024 margin
- Solid D (+39.5) · D 68.5% · R 29.0% · Other 2.5%
- 2008→2024 swing
- +9.3pp toward D · 2008: 30.1pp · 2024: 39.5pp
- All cycles
- 2024: D+39.5 2020: D+45.2 2016: D+38.1 2012: D+26.9 2008: D+30.1
Not yet ingested
- Civics
- —
Market trends
- HPI YoY
- ▼ -115.43%
- Current HPI
- 361.8972
- Rent YoY
- ▲ 2.03%
- Metro
- Boston-Cambridge-Newton, MA-NH
- State GDP YoY
- ▲ 2.28%
- F500 in state
- 38
Industry mix (Fortune 500 HQ in MA)
| Industry | F500 HQs | Revenue |
|---|---|---|
| Technology | 3 | $17B |
|
||
| Insurance | 2 | $84B |
|
||
| Retail | 2 | $76B |
|
||
| Life Sciences | 1 | $43B |
|
||
| Energy Technology | 1 | $31B |
|
||
| Aerospace / Defense | 1 | $18B |
|
||
Price history
+431.9% since first listed7 events — show timeline
- 2026-06-04 Price Changed $1,149,000 MLS PIN
- 2026-04-29 Listed $1,199,000 MLS PIN
- 2021-09-16 Sold (MLS) $1,000,000 MLS PIN
- 2021-08-09 Pending — MLS PIN
- 2021-07-27 Contingent — MLS PIN
- 2021-07-21 Listed $949,000 MLS PIN
- 1989-01-30 Sold (Public Records) $216,000 Public Records
Property tax history
+7.6%/yrLatest (2025): $11,438 · +7.3% YoY. Source: county tax records.
Cash-flow waterfall
monthlySold comps — $/sqft
last 12 mo · ≤1 miLoading sold comps…