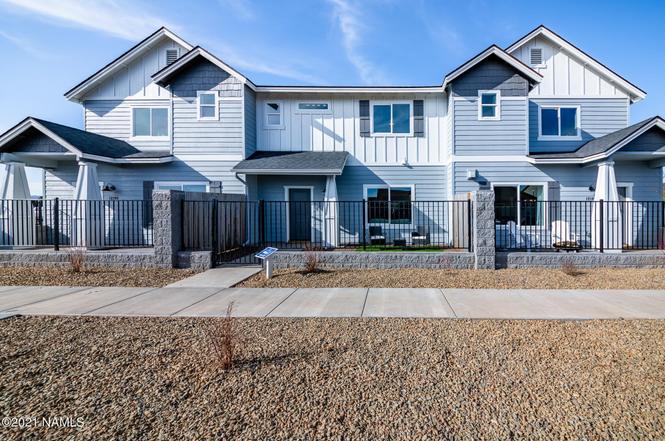
12084 Curtis Ct · Bellemont, AZ
Flood risk No data
- FEMA flood zone
- —
- Chance of flooding over 30 yrs
- —
- Est. flood insurance / yr
- —
Fire risk No data
- Est. fire insurance / yr
- —
Heat risk No data
- Hot days now (above threshold)
- —
- Hot days in 30 yrs
- —
Wind risk No data
- Chance of severe wind over 30 yrs
- —
Air-quality risk No data
- Unhealthy air days now
- —
- Unhealthy air days in 30 yrs
- —
Risk factors via First Street. Map © Google.
Why this score? — see what drove the D+ grade
The composite is a weighted blend of 9 inputs, each scored 0–100. Each bar is that input's sub-score; the figure is the points it added to the 100-point composite (weight × sub-score).
- Cash flow +17.3/30.0
- DSCR +5.4/10.0
- 1% rule +5.0/10.0
- ARV discount +5.0/15.0
- Condition / age +4.8/5.0
- Appreciation +3.5/10.0
- Rent growth +2.5/5.0
- Livability +2.5/5.0
- Schools +2.1/10.0
$469,950
🖨 Deal sheet (PDF) 📄 Offer letter ✓ Due diligence
Listing remarks
COVETED NATIONAL FOREST VIEW LOT IN SHADOW MOUNTAIN VILLAGE AVAILABLE! One of the best new home values in the entire Flagstaff area. The new phase features 84 townhomes with current and modern finishes. Builder includes upgraded items like granite/quartz countertops (kitchen & bathrooms), Samsung® stainless steel appliances, shaker style cabinets with soft close drawers/doors, spray foam insulation with 2x6 construction, fiber-optic internet ready, luxury vinyl plank flooring, an extended warranty and many more items STANDARD. The townhomes each have an oversize 2 car garage and a gated/fenced front yard. Inside the community you will have a playground, a couple picnic gazebo's, a
Key facts
- Dog park
- Oversize garage
- Pickleball court
Tags
Property features AI
Finance
- Other: Builder: SOLID HOMES; Approximate building area: 1,600 (source: listing)
- HOA & community: Homeowners association (Shadow Mountain Village at Bellemont); Monthly association fee of $106; Community tennis courts; Playground
Exterior
- Parking: Attached 2-car garage with garage door opener
- Security: Smoke detector(s)
- Utilities: Electricity available; Natural gas available
- Home design: Multi/split levels; Under construction (new construction by SOLID HOMES)
- Construction: Stem wall and slab foundation
- Exterior features: Patio; Perimeter fencing; Landscaped lot; Level lot; Mountain and forest views; Paved road access
Interior
- Kitchen: Gas range; ENERGY STAR qualified dishwasher
- Bedrooms: Upper level laundry (bedroom level info not specified)
- Flooring: Carpet
- Bathrooms: 2.5 bathrooms
- Heating & cooling: Natural gas heating; Refrigeration cooling
- Interior features: Pantry; Breakfast bar; Satellite dish; Smoke detectors
- Laundry & utility: Laundry on upper level
Neighborhood map
What this means for you Summary
Snapshot
- This is a 3-bed/2.5-bath townhouse listed at $470k. Condition is rated excellent.
Deal economics
- At list price, monthly cash flow is $341 ($4k/yr) — positive.
- The deal already cash-flows at list — no discount required.
- To meet the 1% rule (rent ≥ 1% of price), the offer needs to be $468k (0.5% below list).
- Recommended offer: $468k (0.5% below list) — sets the bar for 1% rule.
Location & tenants
- Location reads: area grade D — affects rentability + tenant quality, not the cash-flow math above.
- Flagstaff Unified District (4192) (urban): math 18% / reading 29% proficiency, ranked #158 of 249 in AZ (top 64%) — low school quality limits family demand, transient renter base, plan for 1-2y turnover.
- Market conditions: 45 active listings in the ZIP; 698 units permitted in Coconino County in 2024 (354 in 5+ unit buildings).
Forward outlook
- Local home prices are declining (-2.9%/yr); year-one equity from $3k of loan paydown is wiped out by about $14k of value loss. Plan a longer hold.
- Coconino County population projected at +20% by 2050 — long-run rental-demand tailwind backs the buy-and-hold thesis.
Negotiation context
- Only 4 days on market — expect competitive offers; lowballing is unlikely to land.
Questions for the listing agent
- What does the HOA fee cover, when was the last increase, and are there any pending special assessments or reserve-fund shortfalls?
- Is there a deadline driving the sale (1031 exchange, divorce, estate, relocation)? That informs how much negotiation room exists.
- The area grade is low — what's the realistic commute time and amenity access for the typical tenant pool here? Any planned neighborhood developments (good or bad) we should know about?
- What's the average days-on-market for RENTAL listings here right now (not sales)? A rising rental-DOM trend means longer vacancies and softer asking-rent achievability than the comps imply.
- What's the recent tenant-quality profile in this submarket — average credit score on applications, eviction rate, late-payment / NSF rate, and stable-employment percentage? A property-management company in the area should have these aggregated.
- How much new for-sale + rental construction is in the pipeline within 1–3 miles? Heavy new supply typically softens prices + rents 12–24 months out; constrained supply supports both.
Investment metrics
- 1% rule
- 1.00% ✗
- Cap rate
- 7.16%
- Cash-on-cash
- 3.11%
- DSCR
- 1.14
- GRM
- 8.4
CMA / ARV
- ARV (on-the-fly)
- $444,800
- Comps found
- 12
Show comp detail 12 sales within ~0.75 mi
| Address | Dist | Beds/Ba | Sqft | Sold | Price | $/sf | Match |
|---|---|---|---|---|---|---|---|
| 12266 Curtis Ct | 0.14mi | 3/2.5 | 1,600 (0%) | 1mo | $463,000 | $289 | 93 |
| 12105 Bliss Ave | 0.10mi | 3/2.5 | 1,600 (0%) | 4mo | $449,950 | $281 | 92 |
| 12101 Bliss Ave | 0.10mi | 3/2.5 | 1,600 (0%) | 6mo | $445,000 | $278 | 90 |
| 12189 Bliss Ave | 0.12mi | 3/2.5 | 1,600 (0%) | 6mo | $450,000 | $281 | 90 |
| 12207 Curtis Ct | 0.09mi | 3/2.5 | 1,600 (0%) | 10mo | $465,000 | $291 | 88 |
| 12098 Bliss Ave | 0.09mi | 3/2.5 | 1,686 (+5%) | 1mo | $449,950 | $267 | 86 |
| 12296 Curtis Ct | 0.17mi | 3/2.5 | 1,600 (0%) | 9mo | $440,000 | $275 | 84 |
| 12103 Bliss Ave | 0.10mi | 3/2.5 | 1,686 (+5%) | 8mo | $445,370 | $264 | 79 |
| 12094 Bliss Ave | 0.09mi | 3/2.5 | 1,818 (+14%) | 1mo | $499,950 | $275 | 72 |
| 12245 Solid Rock Dr | 0.14mi | 3/2.5 | 1,818 (+14%) | 6mo | $499,500 | $275 | 66 |
| 12107 Bliss Ave | 0.11mi | 3/2.5 | 1,818 (+14%) | 7mo | $505,000 | $278 | 66 |
| 12262 Curtis Ct | 0.14mi | 3/2.5 | 1,818 (+14%) | 8mo | $510,000 | $281 | 64 |
Match score weights: distance 35% · size 25% · config 20% · recency 20%. Top-matched comps best support the ARV.
Projected returns pro-forma
-2.91% appreciation · 3.0% rent growth · sell at horizon
- IRR
- -10.9%
- Equity multiple
- 0.60×
- Total profit
- $-52,484
- Equity at exit
- $71,972
- IRR
- -1.7%
- Equity multiple
- 0.88×
- Total profit
- $-15,630
- Equity at exit
- $43,905
Cash invested: $131,586 (down + closing). Projections, not guarantees.
Landlord ↔ Tenant lean methodology
- Overall (STATE)
- 87 Strongly Landlord-Friendly
- State Arizona
- 87 Strongly Landlord-Friendly · R+3
- County
- — inherits STATE
- City
- — inherits STATE
ZIP-level market 86015
- Home prices YoY
- -1.3%
- Active inventory
- 45
- Price-to-rent
- 8.4×
Monthly cashflow live
- Estimated rent
- $4,677 medium interval (Pro) →
- Mortgage (P&I)
- −$2,464
- Tax est. 1.5%
- −$587 /mo · $7,049/yr
- Insurance
- −$196
- HOA
- −$106
- Vacancy / Maint / Mgmt
- −$982
- Net cashflow
- $341
Break-even live
Sensitivity live
| Price | -10% $666 | -5% $504 | +0% $341 | +5% $179 | +10% $17 |
|---|---|---|---|---|---|
| Rent | -10% $-28 | -5% $157 | +0% $341 | +5% $526 | +10% $711 |
| Rate | -1.0pp $578 | -0.5pp $461 | base $341 | +0.5pp $220 | +1.0pp $96 |
UW: 25.0% down · 7.5% · 30yr · 1.5% tax · 5.0% vac · 8.0% maint · 8.0% mgmt
Financing live
Cash to close
- Down payment
- $117,488
- Closing costs
- $14,098
- Reserves months
- —
- Total cash needed
- —
Loan-product check · same deal, 3 products live
Conventional
25% down · 7.5% · 30yr
- Down + closing
- —
- Monthly P&I
- —
- Monthly cashflow
- —
- DSCR
- —
- Eligible?
- —
Personal DTI + credit; lowest rate.
DSCR
20% down · 8.5% · 30yr
- Down + closing
- —
- Monthly P&I
- —
- Monthly cashflow
- —
- DSCR
- —
- Eligible?
- —
No personal income docs; deal must DSCR.
Hard money
10% down · 12.0% · 12mo
- Down + closing
- —
- Monthly P&I
- —
- Monthly cashflow
- —
- DSCR
- —
- Eligible?
- —
Short-term bridge; refi at stabilization.
HOA detail
- Monthly dues
- $106 · $1,272/yr
- Likely covers
- internetsecurity
Listing history 4 events
-
2026-06-21days on market $469,950 Active 4 DOM
-
2026-06-19days on market $469,950 Active 2 DOM
-
2026-06-17remarks 691-char remark
-
2026-06-17$469,950 Active 1 DOM
ⓘ Source: listings_history table (triggers on properties + properties_extension) + one-shot
backfill from property_details.listing_events for pre-trigger history.
Nearby sold comps map
Loading sold comps map…
Walkable amenities ~0.75 mi
Loading nearby amenities…
Taxation est. · year 1
- Rental income
- $56,129
- − Mortgage interest
- −$26,325
- − Property taxes
- −$7,049
- − Insurance
- −$2,350
- − Repairs & maintenance
- −$4,490
- − Management
- −$4,490
- − HOA
- −$1,272
- − Depreciation
- −$13,671
- Taxable loss
- −$3,519
- Est. tax savings @ 24.0%
- +$844
- After-tax cash flow
- $4,942/yr
For passive investors: Depreciation is non-cash, so a rental often shows a tax loss while cash-flowing — sheltering income. Rental losses are passive: they offset passive income freely, and up to $25,000/yr can offset ordinary (W-2) income if you actively participate and your MAGI is under $100k (phasing out to $0 by $150k); unused losses carry forward. On sale, claimed depreciation is recaptured at up to 25%, and gains may owe capital-gains tax (a 1031 exchange can defer both). Figures are a year-1 estimate at your 24.0% rate — not tax advice; consult a CPA.
Condition & rehab AI · 13 photos
This townhouse is in excellent condition with modern finishes and well-maintained exterior. Minor improvements to the exterior and landscaping can further enhance its value.
Value-add opportunities
- Resale Painting the exterior siding — Enhances curb appeal and can increase property value
- Both Landscaping improvements — Enhances curb appeal and can increase property value
Renovation cost estimate screening
Value-add ROI direction
- Resale Painting the exterior siding — Enhances curb appeal and can increase property value ↑
- Both Landscaping improvements — Enhances curb appeal and can increase property value ↑
ⓘ Cost ranges are severity-bucket heuristics (US national rule-of-thumb). Get contractor quotes + a written scope before underwriting a rehab budget.
Schools (NCES district)
- District
- Flagstaff Unified District (4192)
- NCES district ID
- 0402860
- Math proficiency
- 18% ▼ -16.00%
- Reading proficiency
- 29% ▼ -10.00%
- Median HH income
- $53,510
- Composite
- 21.11/100
- National rank
- #8437
- State rank
- #158 of 249 in AZ
Livability — Bellemont
No livability data for this city. (Only ~50 U.S. cities are tracked.)
Census & demographics
- Census place
- Bellemont, AZ
- Population (ZIP)
- 1,447
Population outlook (Coconino County) Hauer SSP2
- Today (2025)
- 150,645 people
- By 2030
- 156,857 · +4.1%
- By 2040
- 168,714 · +12.0%
- By 2050
- 181,082 · +20.2%
- By 2075
- 218,399 · +45.0%
- By 2100
- 238,853 · +58.6%
Race, ethnicity, and origin ACS 2023
- Neighborhood character
- Highly diverse neighborhood (Simpson 0.77)
- Race & ethnicity
- White 44% Native American 23% Two or more races 22% Hispanic / Latino 17% Asian 4%
- Hispanic origin (detail)
- Mexican 15% Puerto Rican 1%
- Common ancestry
- Slovak 4% Iranian 2% Italian 2%
- Foreign-born
- 4%
- Languages at home
- 71% English-only · Other Asian/Pacific 3% Spanish 3% Tagalog/Filipino 1%
Political lean MEDSL · Coconino
- 2024 margin
- D (+19.9) · D 59.2% · R 39.4% · Other 1.4%
- 2008→2024 swing
- +2.9pp toward D · 2008: 17.0pp · 2024: 19.9pp
- All cycles
- 2024: D+19.9 2020: D+24.1 2016: D+19.4 2012: D+14.9 2008: D+17.0
Not yet ingested
- Civics
- —
Market trends
- HPI YoY
- ▼ -2.91%
- Current HPI
- 219.9374
- Rent YoY
- —
- Metro
- —
- State GDP YoY
- ▲ 4.54%
- F500 in state
- 20
Industry mix (Fortune 500 HQ in AZ)
| Industry | F500 HQs | Revenue |
|---|---|---|
| Technology | 2 | $13B |
|
||
| Mining / Metals | 1 | $23B |
|
||
| Environmental Services | 1 | $16B |
|
||
| Metals / Steel | 1 | $14B |
|
||
| Technology Distribution | 1 | $9B |
|
||
| Homebuilding | 1 | $8B |
|
||
Price history
1 event — show timeline
- 2026-06-17 Listed $469,950 NAZMLS
Cash-flow waterfall
monthlySold comps — $/sqft
last 12 mo · ≤1 miLoading sold comps…