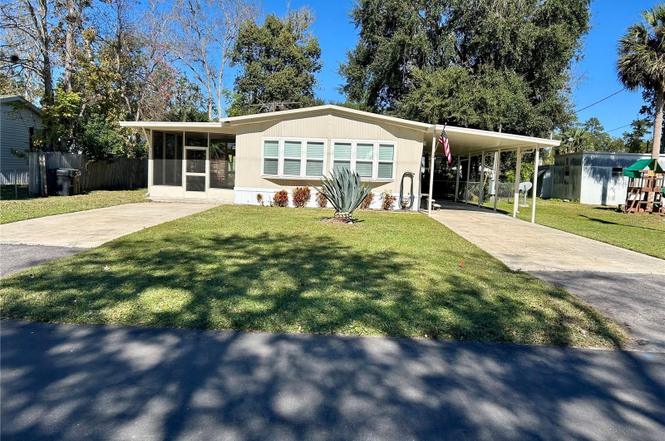
23917 Deer Rd · Astor, FL
Flood risk 1/10 · Minimal
- FEMA flood zone
- X (unshaded)
- Chance of flooding over 30 yrs
- 0.0%
- Est. flood insurance / yr
- $507 – $1,088
Fire risk 3/10 · Minor
- Est. fire insurance / yr
- $947 – $1,759
Heat risk 8/10 · Major
- Hot days now (above 107°F)
- 7 days/yr
- Hot days in 30 yrs
- 21 days/yr
Wind risk 9/10 · Severe
- Chance of severe wind over 30 yrs
- 99.0%
Air-quality risk 3/10 · Minor
- Unhealthy air days now
- 2 days/yr
- Unhealthy air days in 30 yrs
- 3 days/yr
Risk factors via First Street. Map © Google.
Why this score? — see what drove the D grade
The composite is a weighted blend of 9 inputs, each scored 0–100. Each bar is that input's sub-score; the figure is the points it added to the 100-point composite (weight × sub-score).
- Cash flow +10.6/30.0
- ARV discount +7.5/15.0
- Appreciation +6.0/10.0
- Schools +4.2/10.0
- Livability +3.3/5.0
- DSCR +3.1/10.0
- Rent growth +2.5/5.0
- Condition / age +2.5/5.0
- 1% rule +2.4/10.0
$195,000
🖨 Deal sheet (PDF) 📄 Offer letter ✓ Due diligence
Listing remarks MLS
Great mobile home with enclosed porch, fully furnished, nice lot.
Key facts
- New drywall
- New bay windows
- 2 parking spots
Tags
Property features AI
Finance
- Other: Property type: Residential; Property sub-type: Manufactured Home; Body type: Double Wide; Zoning: R-7; Lot about 0.17 acre (approx. 75 x 100); Living area reported as 768 sq ft; total building area 1,476 sq ft; Foundation: Crawlspace; Furnished: Yes
Exterior
- Parking: Carport with 2 spaces
- Utilities: Public water; Public sewer; Cable available; Electricity connected; Fire hydrant nearby; Phone available; Sewer connected; Water connected
- Home design: Manufactured home (double wide); One level; Faces south
- Construction: Vinyl siding; Roof over
- Exterior features: Shed(s); Asphalt road access; Publicly maintained road
Interior
- Kitchen: Range; Refrigerator; Electric water heater
- Bedrooms: 2 bedrooms
- Flooring: Laminate; Crawlspace foundation
- Bathrooms: 1 full bath; 1 half bath
- Heating & cooling: Electric heating; Mini-split cooling
- Interior features: Thermostat; Window treatments; Blinds; Double-pane windows
- Laundry & utility: Washer; Dryer; Laundry: Other
Neighborhood map
What this means for you Summary
Snapshot
- This is a 2-bed/1.5-bath manufactured listed at $195k.
Deal economics
- At list price, monthly cash flow is $-95 ($-1k/yr) — negative.
- To cash-flow at today's rent, offer at most $178k (8.6% below list).
- To meet the 1% rule (rent ≥ 1% of price), the offer needs to be $145k (25.6% below list).
- Recommended offer: $145k (25.6% below list) — sets the bar for 1% rule.
Location & tenants
- Location reads 66/100 on livability (#613 in FL) — a middle-class / working-renter tenant base. Strengths: crime A+, cost of living A+, housing A+; Watch: amenities F, commute F, health & safety D-.
- Lake (suburban): math 49% / reading 50% proficiency, ranked #37 of 73 in FL (top 51%) — families likely to look elsewhere, expect single-tenant / working-renter base with shorter leases.
- Zoned schools: Spring Creek Charter School (math 45% / reading 44%, grade F, #1,288 of 2,144 statewide, top 62%, 630 students, 100% FRL, charter); Umatilla Middle School (math 58% / reading 46%, grade C+, #217 of 571 statewide, top 40%, 595 students, 57% FRL); Umatilla High School (math 24% / reading 29%, grade F, #489 of 667 statewide, top 74%, 861 students, 51% FRL) — zoned schools average 69% FRL vs 49% district-wide (20 pts higher); higher-poverty schools than district average — tighter screening recommended.
- Market conditions: 77 active listings in the ZIP; 1 comparable units currently listed for rent nearby; 4,799 units permitted in Lake County in 2024 (814 in 5+ unit buildings).
Forward outlook
- In year one you build about $5k of equity ($1k loan paydown + $4k appreciation (1.9% local appreciation)).
- Lake County population projected at +37% by 2050 — long-run rental-demand tailwind backs the buy-and-hold thesis.
- By year 7, paydown + projected appreciation supports a ~$33k cash-out refi (75% LTV) — recoverable capital for the next deal without selling this one.
Negotiation context
- It's been on market 200 days — a 12% lower offer ($172k) is reasonable based on typical stale-listing flexibility.
- 5 sale attempts since 12y ago with the ask held roughly flat each time — persistent listings suggest the price (not the market) is what's stuck; bring a comps-based counter.
- Current owner paid $36k; list at $195k implies a 449% gain — meaningful room to come down on a strong offer.
Risks & watch-outs
- Climate carrying-cost: severe wind risk, 99% chance of damaging wind over 30y; extreme-heat days projected 7→21/yr by 2055 (HVAC capex compounding) — expect insurance premiums to compound above CPI over the hold.
Questions for the listing agent
- What do current leases actually rent for vs. the listed asking? Can we see a recent rent roll and the last 12 months of T-12 income?
- It's been on market 200 days. Have you received any prior offers? Is the seller open to a 26% concession, seller financing, or rate buy-down credit?
- Why hasn't it sold? Are there any deal-killer items the seller is aware of (foundation, flood, title, zoning, code violations)?
- Is there a deadline driving the sale (1031 exchange, divorce, estate, relocation)? That informs how much negotiation room exists.
- Schools are F-rated, which usually means shorter tenancies and higher turnover. Who's the typical renter profile here, and what's been the actual vacancy rate?
- The area grade is low — what's the realistic commute time and amenity access for the typical tenant pool here? Any planned neighborhood developments (good or bad) we should know about?
- What's the average days-on-market for RENTAL listings here right now (not sales)? A rising rental-DOM trend means longer vacancies and softer asking-rent achievability than the comps imply.
- What's the recent tenant-quality profile in this submarket — average credit score on applications, eviction rate, late-payment / NSF rate, and stable-employment percentage? A property-management company in the area should have these aggregated.
- How much new for-sale + rental construction is in the pipeline within 1–3 miles? Heavy new supply typically softens prices + rents 12–24 months out; constrained supply supports both.
Investment metrics
- 1% rule
- 0.74% ✗
- Cap rate
- 5.71%
- Cash-on-cash
- -2.10%
- DSCR
- 0.91
- GRM
- 11.2
CMA / ARV
- ARV (on-the-fly)
- $85,248
- Comps found
- 2
Show comp detail 2 sales within ~0.75 mi
| Address | Dist | Beds/Ba | Sqft | Sold | Price | $/sf | Match |
|---|---|---|---|---|---|---|---|
| 55710 Fern Rd | 0.31mi | 2/1.0 | 720 (-6%) | 2mo | $80,000 | $111 | 72 |
| 24048 Ermine Rd | 0.16mi | 2/2.0 | 672 (-12%) | 7mo | $50,000 | $74 | 64 |
Match score weights: distance 35% · size 25% · config 20% · recency 20%. Top-matched comps best support the ARV.
Projected returns pro-forma
1.95% appreciation · 3.0% rent growth · sell at horizon
- IRR
- 2.3%
- Equity multiple
- 1.12×
- Total profit
- $6,768
- Equity at exit
- $76,397
- IRR
- 6.3%
- Equity multiple
- 1.85×
- Total profit
- $46,354
- Equity at exit
- $109,618
Cash invested: $54,600 (down + closing). Projections, not guarantees.
Landlord ↔ Tenant lean methodology
- Overall (STATE)
- 87 Strongly Landlord-Friendly
- State Florida
- 87 Strongly Landlord-Friendly · R+3
- County
- — inherits STATE
- City
- — inherits STATE
ZIP-level market 32102
- Home prices YoY
- 0.8%
- Active inventory
- 77
- Price-to-rent
- 11.2×
Monthly cashflow live
- Estimated rent
- $1,450 medium interval (Pro) →
- Mortgage (P&I)
- −$1,023
- Tax from tax record
- −$137 /mo · $1,644/yr
- Insurance
- −$81
- HOA
- −$0
- Vacancy / Maint / Mgmt
- −$304
- Net cashflow
- $-95
Break-even live
Sensitivity live
| Price | -10% $15 | -5% $-40 | +0% $-95 | +5% $-151 | +10% $-206 |
|---|---|---|---|---|---|
| Rent | -10% $-210 | -5% $-153 | +0% $-95 | +5% $-38 | +10% $19 |
| Rate | -1.0pp $3 | -0.5pp $-46 | base $-95 | +0.5pp $-146 | +1.0pp $-197 |
UW: 25.0% down · 7.5% · 30yr · 1.5% tax · 5.0% vac · 8.0% maint · 8.0% mgmt
Financing live
Cash to close
- Down payment
- $48,750
- Closing costs
- $5,850
- Reserves months
- —
- Total cash needed
- —
Loan-product check · same deal, 3 products live
Conventional
25% down · 7.5% · 30yr
- Down + closing
- —
- Monthly P&I
- —
- Monthly cashflow
- —
- DSCR
- —
- Eligible?
- —
Personal DTI + credit; lowest rate.
DSCR
20% down · 8.5% · 30yr
- Down + closing
- —
- Monthly P&I
- —
- Monthly cashflow
- —
- DSCR
- —
- Eligible?
- —
No personal income docs; deal must DSCR.
Hard money
10% down · 12.0% · 12mo
- Down + closing
- —
- Monthly P&I
- —
- Monthly cashflow
- —
- DSCR
- —
- Eligible?
- —
Short-term bridge; refi at stabilization.
Rent comps 1 comps
| Address | Beds | Baths | Sqft | Rent | $/sqft | DOM | Units | Dist |
|---|---|---|---|---|---|---|---|---|
| 24048 Ermine Rd Astor, FL | 2.0 | 2.0 | 728 | $1,450 | $1.99 | 7d | 1 | 0.15mi |
Listing history 26 events
-
2026-06-21days on market $195,000 Active 200 DOM
-
2026-06-18days on market $195,000 Active 197 DOM
-
2026-06-17days on market $195,000 Active 196 DOM
-
2026-06-16days on market $195,000 Active 195 DOM
-
2026-06-15days on market $195,000 Active 194 DOM
-
2026-06-13days on market $195,000 Active 192 DOM
-
2026-06-09days on market $195,000 Active 188 DOM
-
2026-06-08days on market $195,000 Active 187 DOM
-
2026-06-07days on market $195,000 Active 186 DOM
-
2026-06-04days on market $195,000 Active 183 DOM
-
2026-06-03days on market $195,000 Active 182 DOM
-
2026-06-02days on market $195,000 Active 181 DOM
-
2026-06-02days on market $195,000 Active 180 DOM
-
2026-05-31days on market $195,000 Active 179 DOM
-
2026-05-15status Active
-
2026-05-15status Pending
-
2025-12-03$195,000 Active
-
2016-08-31soldstatus $35,500 Sold 65-char remark
Show marketing remark (65 chars)
Great mobile home with enclosed porch, fully furnished, nice lot.
-
2016-08-23status Pending 65-char remark
Show marketing remark (65 chars)
Great mobile home with enclosed porch, fully furnished, nice lot.
-
2016-07-08$39,500 Active 65-char remark
Show marketing remark (65 chars)
Great mobile home with enclosed porch, fully furnished, nice lot.
-
2015-10-24historical
-
2014-06-14status Active
-
2014-06-10historical
-
2014-04-27$49,000 Active
-
2002-04-08soldstatus $51,000
-
1996-12-17soldstatus $37,500
ⓘ Source: listings_history table (triggers on properties + properties_extension) + one-shot
backfill from property_details.listing_events for pre-trigger history.
Tax reassessment forecast FL · Resets to sale price
- Current annual tax
- $1,644 · $137/mo
- Projected year-2 tax
- $1,644 · $137/mo
- Expected delta
- $0/yr ($0/mo · 0.0%)
ⓘ Screening estimate from a state-policy table — verify with the county assessor before closing.
Climate risk First Street
- Flood 1/10 Low FEMA zone X (unshaded) · 0% chance over 30 yrs
- Wildfire 3/10 Moderate
- Heat 8/10 Severe 7 d/yr ≥107°F today · 21 d/yr by 30 yrs out
- Wind 9/10 Extreme 99% chance of damaging wind over 30 yrs
- Air quality 3/10 Moderate 2 unhealthy d/yr today · 3 by 30 yrs out
Nearby sold comps map
Loading sold comps map…
Walkable amenities ~0.75 mi
Loading nearby amenities…
Taxation est. · year 1
- Rental income
- $17,400
- − Mortgage interest
- −$10,923
- − Property taxes
- −$1,644
- − Insurance
- −$975
- − Repairs & maintenance
- −$1,392
- − Management
- −$1,392
- − Depreciation
- −$5,673
- Taxable loss
- −$4,599
- Est. tax savings @ 24.0%
- +$1,104
- After-tax cash flow
- $-40/yr
For passive investors: Depreciation is non-cash, so a rental often shows a tax loss while cash-flowing — sheltering income. Rental losses are passive: they offset passive income freely, and up to $25,000/yr can offset ordinary (W-2) income if you actively participate and your MAGI is under $100k (phasing out to $0 by $150k); unused losses carry forward. On sale, claimed depreciation is recaptured at up to 25%, and gains may owe capital-gains tax (a 1031 exchange can defer both). Figures are a year-1 estimate at your 24.0% rate — not tax advice; consult a CPA.
Schools (NCES district)
- District
- Lake
- NCES district ID
- 1201050
- Math proficiency
- 49% ▼ -7.00%
- Reading proficiency
- 50% ▼ -4.00%
- Median HH income
- $46,632
- Composite
- 42.05/100
- National rank
- #3327
- State rank
- #37 of 73 in FL
Livability — Astor
- Score
- 66/100
- State rank
- #613
- US rank
- #11822
Category grades
Schools grade is shown separately in the Schools card above.
Census & demographics
- Census place
- Astor, FL
- Population (ZIP)
- 2,401
Population outlook (Lake County) Hauer SSP2
- Today (2025)
- 386,640 people
- By 2030
- 417,107 · +7.9%
- By 2040
- 476,676 · +23.3%
- By 2050
- 531,296 · +37.4%
- By 2075
- 648,303 · +67.7%
- By 2100
- 698,530 · +80.7%
Race, ethnicity, and origin ACS 2023
- Neighborhood character
- Predominantly White (89%)
- Race & ethnicity
- White 89% Two or more races 7% Hispanic / Latino 3%
- Common ancestry
- Lithuanian 9% Portuguese 8% Slovak 2%
- Foreign-born
- 2% · Canada
- Languages at home
- 95% English-only · Spanish 3% German/W. Germanic 1% Russian/Polish/Slavic 1%
Political lean MEDSL · Lake
- 2024 margin
- Strong R (+24.7) · D 37.3% · R 62.0%
- 2008→2024 swing
- -11.2pp toward R · 2008: -13.5pp · 2024: -24.7pp
- All cycles
- 2024: R+24.7 2020: R+20.0 2016: R+23.1 2012: R+17.1 2008: R+13.5
Not yet ingested
- Civics
- —
Market trends
- HPI YoY
- ▲ 1.95%
- Current HPI
- 232.7974
- Rent YoY
- —
- Metro
- —
- State GDP YoY
- ▲ 3.28%
- F500 in state
- 36
Industry mix (Fortune 500 HQ in FL)
| Industry | F500 HQs | Revenue |
|---|---|---|
| Industrial Technology | 2 | $29B |
|
||
| Insurance | 2 | $17B |
|
||
| Retail | 1 | $60B |
|
||
| Technology Distribution | 1 | $58B |
|
||
| Homebuilding | 1 | $35B |
|
||
| Technology Manufacturing | 1 | $35B |
|
||
Price history
+420.0% since first listed12 events — show timeline
- 2026-05-15 Relisted — Stellar MLS as Distributed by MLS Grid
- 2026-05-15 Pending — Stellar MLS as Distributed by MLS Grid
- 2025-12-03 Listed $195,000 Stellar MLS as Distributed by MLS Grid
- 2016-08-31 Sold (MLS) $35,500 Stellar MLS as Distributed by MLS Grid
- 2016-08-23 Pending — Stellar MLS as Distributed by MLS Grid
- 2016-07-08 Listed $39,500 Stellar MLS as Distributed by MLS Grid
- 2015-10-24 Listing Removed — Stellar MLS as Distributed by MLS Grid
- 2014-06-14 Relisted — Stellar MLS as Distributed by MLS Grid
- 2014-06-10 Listing Removed — Stellar MLS as Distributed by MLS Grid
- 2014-04-27 Listed $49,000 Stellar MLS as Distributed by MLS Grid
- 2002-04-08 Sold (Public Records) $51,000 Public Records
- 1996-12-17 Sold (Public Records) $37,500 Public Records
Property tax history
+7.2%/yrLatest (2025): $1,644 · +0.6% YoY. Source: county tax records.
Cash-flow waterfall
monthlySold comps — $/sqft
last 12 mo · ≤1 miLoading sold comps…