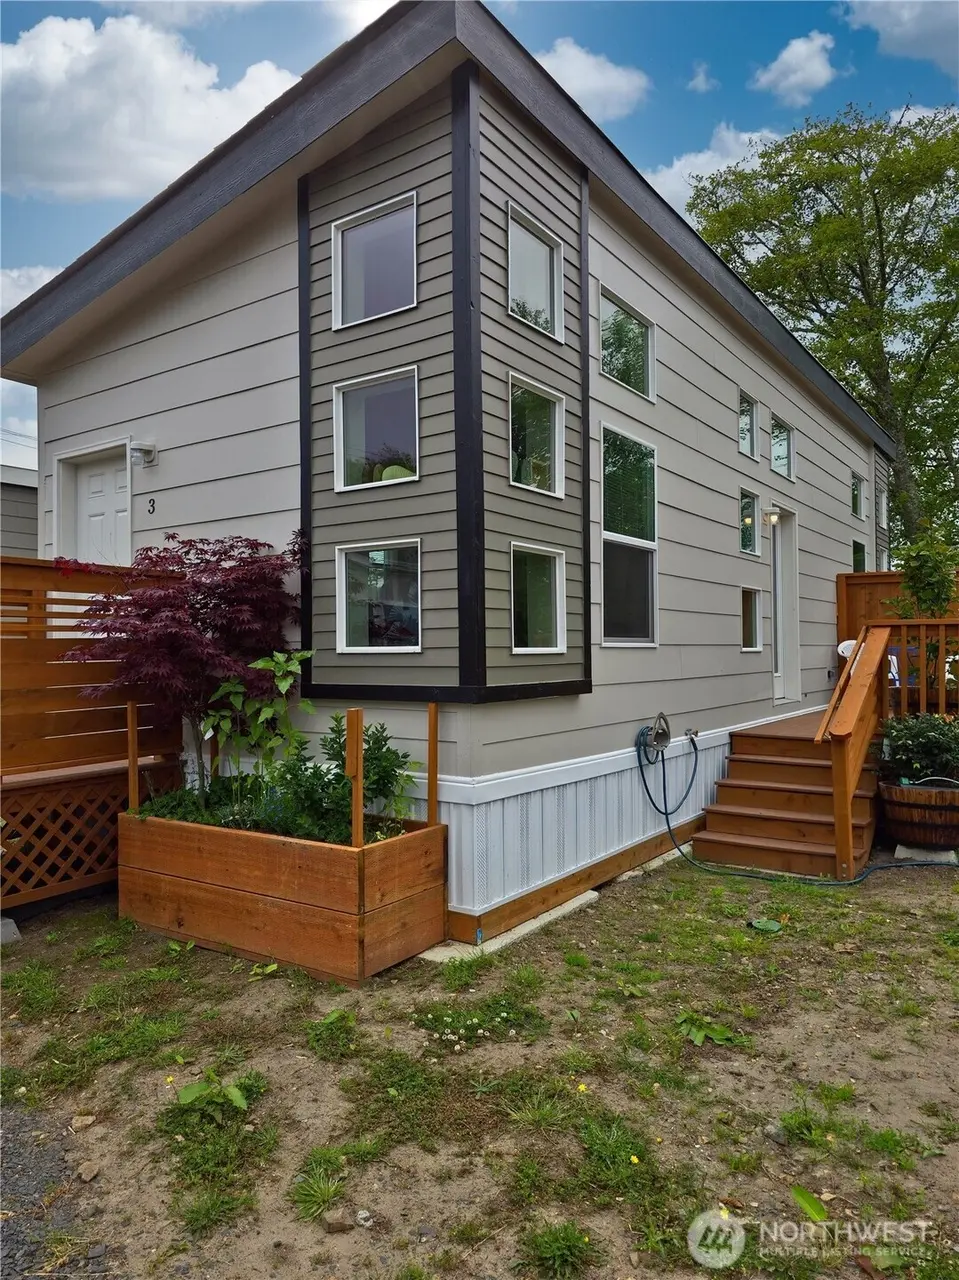
1303 30th #3 · Ilwaco, WA
Flood risk 5/10 · Moderate
- FEMA flood zone
- X (unshaded)
- Chance of flooding over 30 yrs
- 0.24%
- Est. flood insurance / yr
- $507 – $1,088
Fire risk 1/10 · Minimal
- Est. fire insurance / yr
- $604 – $1,122
Heat risk 1/10 · Minimal
- Hot days now (above 74°F)
- 8 days/yr
- Hot days in 30 yrs
- 17 days/yr
Wind risk 1/10 · Minimal
- Chance of severe wind over 30 yrs
- —
Air-quality risk 5/10 · Moderate
- Unhealthy air days now
- 6 days/yr
- Unhealthy air days in 30 yrs
- 6 days/yr
Risk factors via First Street. Map © Google.
Why this score? — see what drove the B grade
The composite is a weighted blend of 9 inputs, each scored 0–100. Each bar is that input's sub-score; the figure is the points it added to the 100-point composite (weight × sub-score).
- Cash flow +30.0/30.0
- 1% rule +10.0/10.0
- DSCR +10.0/10.0
- Appreciation +7.3/10.0
- Condition / age +3.8/5.0
- Schools +3.7/10.0
- Livability +3.7/5.0
- Rent growth +2.5/5.0
- ARV discount +0.0/15.0
$132,500
🖨 Deal sheet 📄 Offer letter ✓ Due diligence
Listing remarks
PALM HARBOR HOME IN A GORGEOUS PARK SETTING. Own for less than rent!! The park is well maintained and managed. Retrograding park included all new underground utilities. Park fee includes water, sewer and front yard maintenance. A perfect place for weekend retreat or full time living, this is a community in and of itself. This unit is an NEW 1-bedroom, 1-bath, 500' square foot home. Vaulted ceilings, open concept floorplan, tons of natural light, all new appliances, and dedicated parking. Located walking distance to the Beach and Discovery Trail and just south of downtown Seaview with convenient access to State Parks, Port of Ilwaco, Long Beach, shopping, restaurants, and Astoria. Schedule a
Key facts
- 2,449 sq ft lot
- Parking
- Built 2024
Tags
Neighborhood map
What this means for you Summary
Snapshot
- This is a 1-bed/1.0-bath manufactured listed at $132k. Condition is rated good.
Deal economics
- At list price, monthly cash flow is $730 ($9k/yr) — positive.
- The deal already cash-flows at list — no discount required.
- Meets the 1% rule at list price ($2k rent vs $132k).
- Recommended offer: $117k (12.0% below list) — sets the bar for market timing.
Location & tenants
- Location reads 73/100 on livability (#205 in WA) — a middle-class / working-renter tenant base. Strengths: crime A+, housing A+, commute B+; Watch: health & safety C-, amenities F.
- Ocean Beach School District (rural): math 34% / reading 50% proficiency, ranked #212 of 291 in WA (top 73%) — families likely to look elsewhere, expect single-tenant / working-renter base with shorter leases.
- Market conditions: 25 active listings in the ZIP; 90 units permitted in Pacific County in 2024 (0 in 5+ unit buildings).
Forward outlook
- In year one you build about $7k of equity ($916 loan paydown + $6k appreciation (4.6% local appreciation)).
- Pacific County population projected at -10% by 2050 — secular population decline; favor cash flow + early exit over multi-decade hold.
- At projected returns (4.6% appreciation + 3.0% rent growth), your $37k cash investment doubles in ~3 years — after that, you're playing with house money.
- By year 5, paydown + projected appreciation supports a ~$30k cash-out refi (75% LTV) — recoverable capital for the next deal without selling this one.
Negotiation context
- It's been on market 282 days — a 12% lower offer ($117k) is reasonable based on typical stale-listing flexibility.
- 4 sale attempts with the ask held roughly flat each time — persistent listings suggest the price (not the market) is what's stuck; bring a comps-based counter.
Risks & watch-outs
- Climate carrying-cost: moderate flood risk — expect insurance premiums to compound above CPI over the hold.
Questions for the listing agent
- It's been on market 282 days. Have you received any prior offers? Is the seller open to a 12% concession, seller financing, or rate buy-down credit?
- Why hasn't it sold? Are there any deal-killer items the seller is aware of (foundation, flood, title, zoning, code violations)?
- Is there a deadline driving the sale (1031 exchange, divorce, estate, relocation)? That informs how much negotiation room exists.
- What's the average days-on-market for RENTAL listings here right now (not sales)? A rising rental-DOM trend means longer vacancies and softer asking-rent achievability than the comps imply.
- What's the recent tenant-quality profile in this submarket — average credit score on applications, eviction rate, late-payment / NSF rate, and stable-employment percentage? A property-management company in the area should have these aggregated.
- How much new for-sale + rental construction is in the pipeline within 1–3 miles? Heavy new supply typically softens prices + rents 12–24 months out; constrained supply supports both.
Investment metrics
- 1% rule
- 1.57% ✓
- Cap rate
- 12.91%
- Cash-on-cash
- 23.62%
- DSCR
- 2.05
- GRM
- 5.3
CMA / ARV
- ARV (median comp)
- $113,352
- List price
- $132,500
- Delta
- 16.89%
- Verdict
- OVERPRICED
- Comps
- 2 within 2.0 mi
Show comp detail 2 sales within ~0.75 mi
| Address | Dist | Beds/Ba | Sqft | Sold | Price | $/sf | Match |
|---|---|---|---|---|---|---|---|
| 1303 30th #2 | 0.00mi | 1/1.0 | 500 (0%) | 10mo | $125,785 | $252 | 92 |
| 1303 30th St #1 | 0.00mi | 1/1.0 | 500 (0%) | 17mo | $121,500 | $243 | 86 |
Match score weights: distance 35% · size 25% · config 20% · recency 20%. Top-matched comps best support the ARV.
Projected returns pro-forma
4.59% appreciation · 3.0% rent growth · sell at horizon
- IRR
- 32.7%
- Equity multiple
- 2.99×
- Total profit
- $74,014
- Equity at exit
- $71,817
- IRR
- 31.6%
- Equity multiple
- 5.99×
- Total profit
- $185,137
- Equity at exit
- $121,325
Cash invested: $37,100 (down + closing). Projections, not guarantees.
Landlord ↔ Tenant lean methodology
- Overall (STATE)
- 28 Tenant-Leaning
- State Washington
- 28 Tenant-Leaning · D+8
- County
- — inherits STATE
- City
- — inherits STATE
ZIP-level market 98644
- Home prices YoY
- 1.8%
- Active inventory
- 25
- Price-to-rent
- 5.3×
Monthly cashflow live
- Estimated rent
- $2,084 medium interval (Pro) →
- Mortgage (P&I)
- −$695
- Tax est. 1.5%
- −$166 /mo · $1,988/yr
- Insurance
- −$55
- HOA
- −$0
- Vacancy / Maint / Mgmt
- −$438
- Net cashflow
- $730
Break-even live
UW: 25.0% down · 7.5% · 30yr · 1.5% tax · 5.0% vac · 8.0% maint · 8.0% mgmt
Financing live
Cash to close
- Down payment
- $33,125
- Closing costs
- $3,975
- Reserves months
- —
- Total cash needed
- —
Loan-product check · same deal, 3 products live
Conventional
25% down · 7.5% · 30yr
- Down + closing
- —
- Monthly P&I
- —
- Monthly cashflow
- —
- DSCR
- —
- Eligible?
- —
Personal DTI + credit; lowest rate.
DSCR
20% down · 8.5% · 30yr
- Down + closing
- —
- Monthly P&I
- —
- Monthly cashflow
- —
- DSCR
- —
- Eligible?
- —
No personal income docs; deal must DSCR.
Hard money
10% down · 12.0% · 12mo
- Down + closing
- —
- Monthly P&I
- —
- Monthly cashflow
- —
- DSCR
- —
- Eligible?
- —
Short-term bridge; refi at stabilization.
Listing history 22 events
-
2026-06-18days on market $132,500 Active 282 DOM
-
2026-06-17days on market $132,500 Active 281 DOM
-
2026-06-16days on market $132,500 Active 280 DOM
-
2026-06-15days on market $132,500 Active 279 DOM
-
2026-06-15days on market $132,500 Active 278 DOM
-
2026-06-13days on market $132,500 Active 277 DOM
-
2026-06-12days on market $132,500 Active 276 DOM
-
2026-06-09days on market $132,500 Active 273 DOM
-
2026-06-08days on market $132,500 Active 272 DOM
-
2026-06-08days on market $132,500 Active 271 DOM
-
2026-06-07remarks 699-char remark
-
2026-06-07days on market $132,500 Active 270 DOM
-
2026-06-03days on market $132,500 Active 267 DOM
-
2026-06-02days on market $132,500 Active 266 DOM
-
2026-06-01days on market $132,500 Active 265 DOM
-
2026-05-31days on market $132,500 Active 264 DOM
-
2026-05-18status Active
-
2025-09-13status Active
-
2025-09-12status Pending
-
2025-09-11status Active
-
2025-07-09status Pending
-
2025-07-03$132,500 Active
ⓘ Source: listings_history table (triggers on properties + properties_extension) + one-shot
backfill from property_details.listing_events for pre-trigger history.
Climate risk First Street
- Flood 5/10 Major FEMA zone X (unshaded) · 24% chance over 30 yrs
- Wildfire 1/10 Low
- Heat 1/10 Low 8 d/yr ≥74°F today · 17 d/yr by 30 yrs out
- Wind 1/10 Low
- Air quality 5/10 Major 6 unhealthy d/yr today · 6 by 30 yrs out
Nearby sold comps map
Loading sold comps map…
Walkable amenities ~0.75 mi
Loading nearby amenities…
Taxation est. · year 1
- Rental income
- $25,003
- − Mortgage interest
- −$7,422
- − Property taxes
- −$1,988
- − Insurance
- −$662
- − Repairs & maintenance
- −$2,000
- − Management
- −$2,000
- − Depreciation
- −$3,855
- Taxable income
- $7,076
- Est. tax owed @ 24.0%
- −$1,698
- After-tax cash flow
- $7,066/yr
For passive investors: Depreciation is non-cash, so a rental often shows a tax loss while cash-flowing — sheltering income. Rental losses are passive: they offset passive income freely, and up to $25,000/yr can offset ordinary (W-2) income if you actively participate and your MAGI is under $100k (phasing out to $0 by $150k); unused losses carry forward. On sale, claimed depreciation is recaptured at up to 25%, and gains may owe capital-gains tax (a 1031 exchange can defer both). Figures are a year-1 estimate at your 24.0% rate — not tax advice; consult a CPA.
Condition & rehab AI · 1 photo
This manufactured home is in good condition with minimal repairs needed. It offers a good investment opportunity with potential for value increase through cosmetic updates and maintenance.
Value-add opportunities
- Both Painting the exterior and interior walls — Fresh paint can enhance the curb appeal and interior aesthetics.
- Both Landscaping improvements — A well-maintained yard can increase both resale and rental value.
- Both HVAC maintenance — A clean and efficient HVAC system can improve comfort and energy efficiency, boosting both resale and rental value.
- Both Interior cleaning — A clean interior can make the home more appealing to potential buyers or renters.
- Both Appliance maintenance — Ensuring all appliances are in good working order can attract more buyers or renters and maintain a good reputation for the property.
Renovation cost estimate screening
Value-add ROI direction
- Both Painting the exterior and interior walls — Fresh paint can enhance the curb appeal and interior aesthetics. ↑
- Both Landscaping improvements — A well-maintained yard can increase both resale and rental value. ↑
- Both HVAC maintenance — A clean and efficient HVAC system can improve comfort and energy efficiency, boosting both resale and rental value. ↑
- Both Interior cleaning — A clean interior can make the home more appealing to potential buyers or renters. ↑
- Both Appliance maintenance — Ensuring all appliances are in good working order can attract more buyers or renters and maintain a good reputation for the property. ↑
ⓘ Cost ranges are severity-bucket heuristics (US national rule-of-thumb). Get contractor quotes + a written scope before underwriting a rehab budget.
Schools (NCES district)
- District
- Ocean Beach School District
- NCES district ID
- 5306060
- Math proficiency
- 34% ▼ -1.00%
- Reading proficiency
- 50% ▲ 1.00%
- Median HH income
- $38,549
- Composite
- 37.37/100
- National rank
- #8929
- State rank
- #212 of 291 in WA
Livability — Ilwaco
- Score
- 73/100
- State rank
- #205
- US rank
- #5623
Category grades
Schools grade is shown separately in the Schools card above.
Census & demographics
- Population (ZIP)
- 686
Population outlook (Pacific County) Hauer SSP2
- Today (2025)
- 20,636 people
- By 2030
- 20,137 · -2.4%
- By 2040
- 19,041 · -7.7%
- By 2050
- 18,504 · -10.3%
- By 2075
- 17,403 · -15.7%
- By 2100
- 16,241 · -21.3%
Race, ethnicity, and origin ACS 2023
- Neighborhood character
- Predominantly White (80%)
- Race & ethnicity
- White 80% Hispanic / Latino 12% Two or more races 6% Native American 3%
- Hispanic origin (detail)
- Mexican 12%
- Common ancestry
- Slovak 7% Italian 6% Iranian 5%
- Foreign-born
- 8% · Canada
- Languages at home
- 79% English-only · Spanish 12% French/Haitian/Cajun 9%
Political lean MEDSL · Pacific
- 2024 margin
- Toss-up / Even · D 48.1% · R 49.4% · Other 2.4%
- 2008→2024 swing
- -15.4pp toward R · 2008: 14.1pp · 2024: -1.3pp
- All cycles
- 2024: R+1.3 2020: R+1.1 2016: R+6.9 2012: D+11.4 2008: D+14.1
Not yet ingested
- Civics
- —
Market trends
- HPI YoY
- ▲ 4.59%
- Current HPI
- 254.3311
- Rent YoY
- —
- Metro
- —
- State GDP YoY
- ▲ 4.65%
- F500 in state
- 22
Industry mix (Fortune 500 HQ in WA)
| Industry | F500 HQs | Revenue |
|---|---|---|
| Retail | 2 | $269B |
|
||
| Technology / Retail | 1 | $638B |
|
||
| Technology | 1 | $245B |
|
||
| Telecommunications | 1 | $38B |
|
||
| Food / Beverage | 1 | $36B |
|
||
| Automotive / Trucks | 1 | $34B |
|
||
Price history
6 events — show timeline
- 2026-05-18 Relisted — NWMLS as Distributed by MLS Grid
- 2025-09-13 Relisted — NWMLS as Distributed by MLS Grid
- 2025-09-12 Pending — NWMLS as Distributed by MLS Grid
- 2025-09-11 Relisted — NWMLS as Distributed by MLS Grid
- 2025-07-09 Pending — NWMLS as Distributed by MLS Grid
- 2025-07-03 Listed $132,500 NWMLS as Distributed by MLS Grid
Cash-flow waterfall
monthlySold comps — $/sqft
last 12 mo · ≤1 miLoading sold comps…