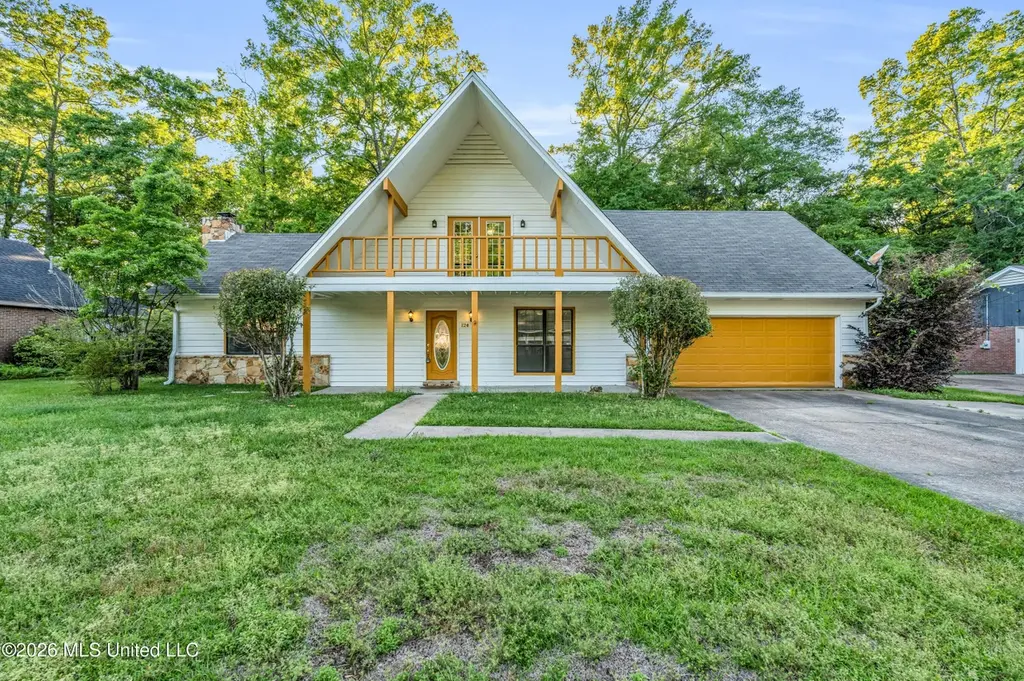
124 Cedar Dr · Columbus, MS
Flood risk 1/10 · Minimal
- FEMA flood zone
- X (unshaded)
- Chance of flooding over 30 yrs
- 0.0%
- Est. flood insurance / yr
- $507 – $1,088
Fire risk 4/10 · Minor
- Est. fire insurance / yr
- $1,241 – $2,305
Heat risk 6/10 · Moderate
- Hot days now (above 109°F)
- 7 days/yr
- Hot days in 30 yrs
- 21 days/yr
Wind risk 6/10 · Moderate
- Chance of severe wind over 30 yrs
- 49.0%
Air-quality risk 1/10 · Minimal
- Unhealthy air days now
- 0 days/yr
- Unhealthy air days in 30 yrs
- 0 days/yr
Risk factors via First Street. Map © Google.
Why this score? — see what drove the C- grade
The composite is a weighted blend of 9 inputs, each scored 0–100. Each bar is that input's sub-score; the figure is the points it added to the 100-point composite (weight × sub-score).
- Cash flow +18.8/30.0
- ARV discount +14.8/15.0
- DSCR +5.9/10.0
- 1% rule +4.0/10.0
- Livability +3.0/5.0
- Rent growth +2.5/5.0
- Condition / age +2.5/5.0
- Schools +1.0/10.0
- Appreciation +0.0/10.0
$279,000
🖨 Deal sheet 📄 Offer letter ✓ Due diligence
Listing remarks MLS
Spacious home located less than 10 minutes from Columbus Air Force Base, offering convenience and functionality for everyday living. This property features vaulted ceilings, a dedicated office space, and an upstairs balcony ideal for morning coffee or quiet evenings. The layout provides a comfortable flow with ample natural light and well-sized living areas. Enjoy a large backyard with room for outdoor activities or entertaining. Ideal for buyers seeking space, accessibility, and a practical layout in a well-established area. This spacious home is designed to give you room to live, work, and relax comfortably. From open living areas to generously sized bedrooms, every part of this home offers the space you need to make it your own.
Key facts
- Upstairs balcony
- Large backyard
- 0.34 acre lot
Tags
Neighborhood map
What this means for you Summary
Snapshot
- This is a 3-bed/1.5-bath single-family listed at $279k.
Deal economics
- At list price, monthly cash flow is $280 ($3k/yr) — positive.
- The deal already cash-flows at list — no discount required.
- To meet the 1% rule (rent ≥ 1% of price), the offer needs to be $250k (10.4% below list).
- Recommended offer: $250k (10.4% below list) — sets the bar for 1% rule.
Location & tenants
- Location reads 60/100 on livability (#219 in MS) — a middle-class / working-renter tenant base. Strengths: cost of living A+, housing A, crime B+; Watch: health & safety D, schools F, amenities F.
- Columbus Municipal School District (town): math 9% / reading 17% proficiency, ranked #113 of 130 in MS (top 87%) — low school quality limits family demand, transient renter base, plan for 1-2y turnover; 84% free/reduced lunch — lower-income household profile, screen leases tightly.
- Market conditions: 13 active listings in the ZIP; 1 comparable units currently listed for rent nearby; 130 units permitted in Lowndes County in 2024 (0 in 5+ unit buildings).
Forward outlook
- Local home prices are declining (-3.0%/yr); year-one equity from $2k of loan paydown is wiped out by about $8k of value loss. Plan a longer hold.
- Lowndes County population projected to shrink 9% by 2050 — rents likely to lag national; underwrite the cash flow, not the appreciation.
Negotiation context
- It's been on market 78 days — a 6% lower offer ($262k) is reasonable based on typical stale-listing flexibility.
Risks & watch-outs
- Climate carrying-cost: major wind risk, 49% chance of damaging wind over 30y; extreme-heat days projected 7→21/yr by 2055 (HVAC capex compounding) — expect insurance premiums to compound above CPI over the hold.
Questions for the listing agent
- It's been on market 78 days. Have you received any prior offers? Is the seller open to a 10% concession, seller financing, or rate buy-down credit?
- Why hasn't it sold? Are there any deal-killer items the seller is aware of (foundation, flood, title, zoning, code violations)?
- Is there a deadline driving the sale (1031 exchange, divorce, estate, relocation)? That informs how much negotiation room exists.
- Schools are F-rated, which usually means shorter tenancies and higher turnover. Who's the typical renter profile here, and what's been the actual vacancy rate?
- What's the average days-on-market for RENTAL listings here right now (not sales)? A rising rental-DOM trend means longer vacancies and softer asking-rent achievability than the comps imply.
- What's the recent tenant-quality profile in this submarket — average credit score on applications, eviction rate, late-payment / NSF rate, and stable-employment percentage? A property-management company in the area should have these aggregated.
- How much new for-sale + rental construction is in the pipeline within 1–3 miles? Heavy new supply typically softens prices + rents 12–24 months out; constrained supply supports both.
Investment metrics
- 1% rule
- 0.90% ✗
- Cap rate
- 7.50%
- Cash-on-cash
- 4.30%
- DSCR
- 1.19
- GRM
- 9.3
CMA / ARV
- ARV (median comp)
- $333,167
- List price
- $279,000
- Delta
- -13.05%
- Verdict
- UNDERPRICED
- Comps
- 2 within 2.0 mi
Show comp detail 1 sale within ~0.75 mi
| Address | Dist | Beds/Ba | Sqft | Sold | Price | $/sf | Match |
|---|---|---|---|---|---|---|---|
| 356 Merry Valley Dr | 0.62mi | 4/3.0 (+1) | 2,272 (-11%) | 23mo | $270,000 | $119 | 23 |
Match score weights: distance 35% · size 25% · config 20% · recency 20%. Top-matched comps best support the ARV.
Projected returns pro-forma
-3.0% appreciation · 3.0% rent growth · sell at horizon
- IRR
- -9.6%
- Equity multiple
- 0.65×
- Total profit
- $-27,496
- Equity at exit
- $41,600
- IRR
- -0.3%
- Equity multiple
- 0.98×
- Total profit
- $-1,427
- Equity at exit
- $24,123
Cash invested: $78,120 (down + closing). Projections, not guarantees.
Landlord ↔ Tenant lean methodology
- Overall (STATE)
- 90 Strongly Landlord-Friendly
- State Mississippi
- 90 Strongly Landlord-Friendly · R+11
- County
- — inherits STATE
- City
- — inherits STATE
ZIP-level market 39705
- Home prices YoY
- -14.8%
- Active inventory
- 13
- Price-to-rent
- 9.3×
Monthly cashflow live
- Estimated rent
- $2,500 medium interval (Pro) →
- Mortgage (P&I)
- −$1,463
- Tax from tax record
- −$116 /mo · $1,390/yr
- Insurance
- −$116
- HOA
- −$0
- Vacancy / Maint / Mgmt
- −$525
- Net cashflow
- $280
Break-even live
UW: 25.0% down · 7.5% · 30yr · 1.5% tax · 5.0% vac · 8.0% maint · 8.0% mgmt
Financing live
Cash to close
- Down payment
- $69,750
- Closing costs
- $8,370
- Reserves months
- —
- Total cash needed
- —
Loan-product check · same deal, 3 products live
Conventional
25% down · 7.5% · 30yr
- Down + closing
- —
- Monthly P&I
- —
- Monthly cashflow
- —
- DSCR
- —
- Eligible?
- —
Personal DTI + credit; lowest rate.
DSCR
20% down · 8.5% · 30yr
- Down + closing
- —
- Monthly P&I
- —
- Monthly cashflow
- —
- DSCR
- —
- Eligible?
- —
No personal income docs; deal must DSCR.
Hard money
10% down · 12.0% · 12mo
- Down + closing
- —
- Monthly P&I
- —
- Monthly cashflow
- —
- DSCR
- —
- Eligible?
- —
Short-term bridge; refi at stabilization.
Rent comps 1 comps
| Address | Beds | Baths | Sqft | Rent | $/sqft | DOM | Units | Dist |
|---|---|---|---|---|---|---|---|---|
| 89 Sir Henry Dr Columbus, MS | 3.0 | 2.0 | 2451 | $2,500 | $1.02 | 43d | 1 | 0.44mi |
Listing history 19 events
-
2026-06-19days on market $279,000 Active 78 DOM
-
2026-06-18days on market $279,000 Active 77 DOM
-
2026-06-17pricedays on market $279,000 Active 76 DOM
-
2026-06-16days on market $289,676 Active 75 DOM
-
2026-06-15days on market $289,676 Active 74 DOM
-
2026-06-14days on market $289,676 Active 72 DOM
-
2026-06-12days on market $289,676 Active 71 DOM
-
2026-06-09days on market $289,676 Active 68 DOM
-
2026-06-08days on market $289,676 Active 67 DOM
-
2026-06-07days on market $289,676 Active 66 DOM
-
2026-06-05days on market $289,676 Active 63 DOM
-
2026-06-03days on market $289,676 Active 62 DOM
-
2026-06-02days on market $289,676 Active 61 DOM
-
2026-06-01days on market $289,676 Active 60 DOM
-
2026-05-31days on market $289,676 Active 59 DOM
-
2026-05-30days on market $289,676 Active 58 DOM
-
2026-04-02$289,676 Active 741-char remark
Show marketing remark (741 chars)
Spacious home located less than 10 minutes from Columbus Air Force Base, offering convenience and functionality for everyday living. This property features vaulted ceilings, a dedicated office space, and an upstairs balcony ideal for morning coffee or quiet evenings. The layout provides a comfortable flow with ample natural light and well-sized living areas. Enjoy a large backyard with room for outdoor activities or entertaining. Ideal for buyers seeking space, accessibility, and a practical layout in a well-established area. This spacious home is designed to give you room to live, work, and relax comfortably. From open living areas to generously sized bedrooms, every part of this home offers the space you need to make it your own.
-
2022-04-14soldstatus
-
2018-06-26soldstatus
ⓘ Source: listings_history table (triggers on properties + properties_extension) + one-shot
backfill from property_details.listing_events for pre-trigger history.
Tax reassessment forecast MS · Resets to sale price
- Current annual tax
- $1,390 · $116/mo
- Projected year-2 tax
- $2,204 · $184/mo
- Expected delta
- +$814/yr (+$68/mo · 58.5%)
ⓘ Screening estimate from a state-policy table — verify with the county assessor before closing.
Climate risk First Street
- Flood 1/10 Low FEMA zone X (unshaded) · 0% chance over 30 yrs
- Wildfire 4/10 Moderate
- Heat 6/10 Major 7 d/yr ≥109°F today · 21 d/yr by 30 yrs out
- Wind 6/10 Major 49% chance of damaging wind over 30 yrs
- Air quality 1/10 Low 0 unhealthy d/yr today · 0 by 30 yrs out
Nearby sold comps map
Loading sold comps map…
Walkable amenities ~0.75 mi
Loading nearby amenities…
Taxation est. · year 1
- Rental income
- $30,000
- − Mortgage interest
- −$15,628
- − Property taxes
- −$1,390
- − Insurance
- −$1,395
- − Repairs & maintenance
- −$2,400
- − Management
- −$2,400
- − Depreciation
- −$8,116
- Taxable loss
- −$1,330
- Est. tax savings @ 24.0%
- +$319
- After-tax cash flow
- $3,677/yr
For passive investors: Depreciation is non-cash, so a rental often shows a tax loss while cash-flowing — sheltering income. Rental losses are passive: they offset passive income freely, and up to $25,000/yr can offset ordinary (W-2) income if you actively participate and your MAGI is under $100k (phasing out to $0 by $150k); unused losses carry forward. On sale, claimed depreciation is recaptured at up to 25%, and gains may owe capital-gains tax (a 1031 exchange can defer both). Figures are a year-1 estimate at your 24.0% rate — not tax advice; consult a CPA.
Schools (NCES district)
- District
- Columbus Municipal School District
- NCES district ID
- 2801200
- Math proficiency
- 9% ▼ -11.00%
- Reading proficiency
- 17% ▼ -6.00%
- Median HH income
- $33,376
- Composite
- 10.49/100
- National rank
- #9782
- State rank
- #113 of 130 in MS
Livability — Columbus
- Score
- 60/100
- State rank
- #219
- US rank
- #18952
Category grades
Schools grade is shown separately in the Schools card above.
Census & demographics
- City population
- 35,442
- Population (ZIP)
- 12,195
Population outlook (Lowndes County) Hauer SSP2
- Today (2025)
- 59,842 people
- By 2030
- 59,312 · -0.9%
- By 2040
- 57,282 · -4.3%
- By 2050
- 54,348 · -9.2%
- By 2075
- 45,423 · -24.1%
- By 2100
- 34,724 · -42.0%
Race, ethnicity, and origin ACS 2023
- Neighborhood character
- Diverse neighborhood (Simpson 0.56)
- Race & ethnicity
- White 61% Black 26% Two or more races 5% Hispanic / Latino 4% Asian 3%
- Common ancestry
- Serbian 1% Romanian 1% Slovak 1%
- Foreign-born
- 6% · Canada
- Languages at home
- 94% English-only · Other Indo-European 2% Spanish 2% Tagalog/Filipino 1%
Political lean MEDSL · Lowndes
- 2024 margin
- Lean R (+8.2) · D 45.4% · R 53.6%
- 2008→2024 swing
- -5.3pp toward R · 2008: -2.9pp · 2024: -8.2pp
- All cycles
- 2024: R+8.2 2020: R+2.6 2016: R+6.3 2012: R+1.5 2008: R+2.9
Not yet ingested
- Civics
- —
Market trends
- HPI YoY
- ▼ -30.83%
- Current HPI
- 176.841
- Rent YoY
- —
- Metro
- —
- State GDP YoY
- —
- F500 in state
- 0
Price history
3 events — show timeline
- 2026-04-02 Listed $289,676 MLSU
- 2022-04-14 Sold (Public Records) — Public Records
- 2018-06-26 Sold (Public Records) — Public Records
Property tax history
-0.3%/yrLatest (2025): $1,390 · +2.2% YoY. Source: county tax records.
Cash-flow waterfall
monthlySold comps — $/sqft
last 12 mo · ≤1 miLoading sold comps…