17147 Hope Island Ln · La Conner, WA
Flood risk 1/10 · Minimal
- FEMA flood zone
- —
- Chance of flooding over 30 yrs
- 0.0%
- Est. flood insurance / yr
- —
Fire risk 4/10 · Minor
- Est. fire insurance / yr
- $604 – $1,122
Heat risk 1/10 · Minimal
- Hot days now (above 79°F)
- 7 days/yr
- Hot days in 30 yrs
- 20 days/yr
Wind risk 1/10 · Minimal
- Chance of severe wind over 30 yrs
- —
Air-quality risk 5/10 · Moderate
- Unhealthy air days now
- 7 days/yr
- Unhealthy air days in 30 yrs
- 7 days/yr
Risk factors via First Street. Map © Google.
Why this score? — see what drove the D- grade
The composite is a weighted blend of 9 inputs, each scored 0–100. Each bar is that input's sub-score; the figure is the points it added to the 100-point composite (weight × sub-score).
- Cash flow +10.8/30.0
- ARV discount +7.5/15.0
- Livability +4.2/5.0
- Schools +3.9/10.0
- DSCR +3.1/10.0
- Rent growth +2.5/5.0
- Condition / age +2.5/5.0
- 1% rule +1.9/10.0
- Appreciation +0.0/10.0
$450,000
🖨 Deal sheet 📄 Offer letter ✓ Due diligence
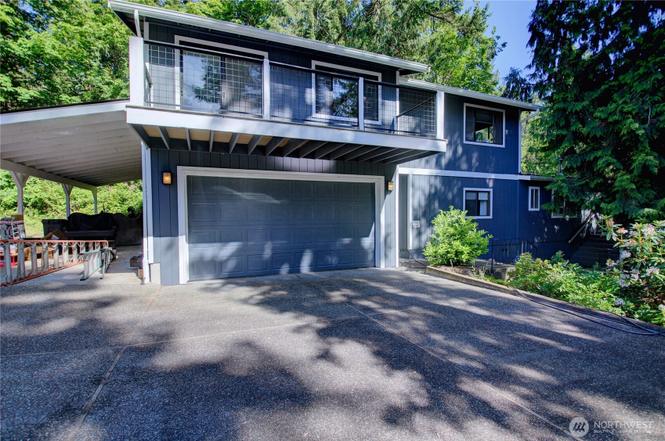
Listing remarks
Escape to the peaceful woods near La Conner! This 2,400+ sq. ft. home offers a rare opportunity to live just a short walk from SneeOosh Beach. This spacious home features 2 primary suites (one on the main), a wood stove, and extensive wraparound decking. Upper level has huge bonus room with vaulted ceiling and tons of light. Spacious primary suite has private deck. Plenty of driveway parking with a 2-car garage, 2-car shop, carport. No HOA (No extra monthly fees). Current lease fee is 4200 per year, (25 yr with option to renew 25). Very quiet and private. Just few miles to La Conner with it's lively mix of shops, eateries, and scenery. Floor plan lends itself well to multi-generational livi
Key facts
- Private deck
- Huge bonus room
- Wood stove
Tags
Neighborhood map
What this means for you Summary
Snapshot
- This is a 4-bed/2.5-bath manufactured listed at $450k.
Deal economics
- At list price, monthly cash flow is $-209 ($-3k/yr) — negative.
- To cash-flow at today's rent, offer at most $413k (8.2% below list).
- To meet the 1% rule (rent ≥ 1% of price), the offer needs to be $309k (31.2% below list).
- Recommended offer: $309k (31.2% below list) — sets the bar for 1% rule.
- Cap rate 5.7% vs local median 1.2% in La Conner — top-decile yield for the area; either an underpriced asset or a hidden risk that comps aren't pricing in. Stress-test before assuming the spread holds.
Location & tenants
- Location reads 83/100 on livability (#56 in WA, #1,009 nationally) — a professional / high-income tenant draw. Strengths: amenities A+, health & safety A+, commute A; Watch: cost of living D+.
- La Conner School District (town): math 34% / reading 50% proficiency, ranked #204 of 291 in WA (top 70%) — families likely to look elsewhere, expect single-tenant / working-renter base with shorter leases.
- Market conditions: 53 active listings in the ZIP; 561 units permitted in Skagit County in 2024 (270 in 5+ unit buildings).
Forward outlook
- Local home prices are declining (-3.0%/yr); year-one equity from $3k of loan paydown is wiped out by about $14k of value loss. Plan a longer hold.
- Skagit County population projected at +11% by 2050 — modest demand growth; plan on rents tracking national, not racing it.
Negotiation context
- It's been on market 55 days — a 3% lower offer ($436k) is reasonable based on typical stale-listing flexibility.
- 2 sale attempts since 23y ago with the ask held roughly flat each time — persistent listings suggest the price (not the market) is what's stuck; bring a comps-based counter.
- Current owner paid $154k; list at $450k implies a 192% gain — meaningful room to come down on a strong offer.
Questions for the listing agent
- What do current leases actually rent for vs. the listed asking? Can we see a recent rent roll and the last 12 months of T-12 income?
- It's been on market 55 days. Have you received any prior offers? Is the seller open to a 31% concession, seller financing, or rate buy-down credit?
- Is there a deadline driving the sale (1031 exchange, divorce, estate, relocation)? That informs how much negotiation room exists.
- Schools are B-rated — typically a magnet for longer-tenancy family renters. What's the average tenant stay here, and is there a school-zone premium baked into asking?
- The area grade is low — what's the realistic commute time and amenity access for the typical tenant pool here? Any planned neighborhood developments (good or bad) we should know about?
- What's the average days-on-market for RENTAL listings here right now (not sales)? A rising rental-DOM trend means longer vacancies and softer asking-rent achievability than the comps imply.
- What's the recent tenant-quality profile in this submarket — average credit score on applications, eviction rate, late-payment / NSF rate, and stable-employment percentage? A property-management company in the area should have these aggregated.
- How much new for-sale + rental construction is in the pipeline within 1–3 miles? Heavy new supply typically softens prices + rents 12–24 months out; constrained supply supports both.
Investment metrics
- 1% rule
- 0.69% ✗
- Cap rate
- 5.74%
- Cash-on-cash
- -1.99%
- DSCR
- 0.91
- GRM
- 12.1
CMA / ARV
No comps found within radius.
Projected returns pro-forma
-3.0% appreciation · 3.0% rent growth · sell at horizon
- IRR
- -19.7%
- Equity multiple
- 0.31×
- Total profit
- $-86,451
- Equity at exit
- $67,096
- IRR
- -12.6%
- Equity multiple
- 0.26×
- Total profit
- $-93,353
- Equity at exit
- $38,908
Cash invested: $126,000 (down + closing). Projections, not guarantees.
Landlord ↔ Tenant lean methodology
- Overall (STATE)
- 28 Tenant-Leaning
- State Washington
- 28 Tenant-Leaning · D+8
- County
- — inherits STATE
- City
- — inherits STATE
ZIP-level market 98257
- Home prices YoY
- -16.7%
- Active inventory
- 53
- Price-to-rent
- 12.1×
Monthly cashflow live
- Estimated rent
- $3,094 medium interval (Pro) →
- Mortgage (P&I)
- −$2,360
- Tax from tax record
- −$106 /mo · $1,271/yr
- Insurance
- −$188
- HOA
- −$0
- Vacancy / Maint / Mgmt
- −$650
- Net cashflow
- $-209
Break-even live
UW: 25.0% down · 7.5% · 30yr · 1.5% tax · 5.0% vac · 8.0% maint · 8.0% mgmt
Financing live
Cash to close
- Down payment
- $112,500
- Closing costs
- $13,500
- Reserves months
- —
- Total cash needed
- —
Loan-product check · same deal, 3 products live
Conventional
25% down · 7.5% · 30yr
- Down + closing
- —
- Monthly P&I
- —
- Monthly cashflow
- —
- DSCR
- —
- Eligible?
- —
Personal DTI + credit; lowest rate.
DSCR
20% down · 8.5% · 30yr
- Down + closing
- —
- Monthly P&I
- —
- Monthly cashflow
- —
- DSCR
- —
- Eligible?
- —
No personal income docs; deal must DSCR.
Hard money
10% down · 12.0% · 12mo
- Down + closing
- —
- Monthly P&I
- —
- Monthly cashflow
- —
- DSCR
- —
- Eligible?
- —
Short-term bridge; refi at stabilization.
Listing history 4 events
-
2025-10-24status Pending
-
2025-08-29$450,000 Active
-
2003-10-16soldstatus $154,000
-
2003-08-26$159,950
ⓘ Source: listings_history table (triggers on properties + properties_extension) + one-shot
backfill from property_details.listing_events for pre-trigger history.
Tax reassessment forecast WA · Resets to sale price
- Current annual tax
- $1,271 · $106/mo
- Projected year-2 tax
- $4,410 · $368/mo
- Expected delta
- +$3,139/yr (+$262/mo · 247.0%)
ⓘ Screening estimate from a state-policy table — verify with the county assessor before closing.
Climate risk First Street
- Flood 1/10 Low 0% chance over 30 yrs
- Wildfire 4/10 Moderate
- Heat 1/10 Low 7 d/yr ≥79°F today · 20 d/yr by 30 yrs out
- Wind 1/10 Low
- Air quality 5/10 Major 7 unhealthy d/yr today · 7 by 30 yrs out
Nearby sold comps map
Loading sold comps map…
Walkable amenities ~0.75 mi
Loading nearby amenities…
Taxation est. · year 1
- Rental income
- $37,131
- − Mortgage interest
- −$25,207
- − Property taxes
- −$1,271
- − Insurance
- −$2,250
- − Repairs & maintenance
- −$2,971
- − Management
- −$2,971
- − Depreciation
- −$13,091
- Taxable loss
- −$10,629
- Est. tax savings @ 24.0%
- +$2,551
- After-tax cash flow
- $45/yr
For passive investors: Depreciation is non-cash, so a rental often shows a tax loss while cash-flowing — sheltering income. Rental losses are passive: they offset passive income freely, and up to $25,000/yr can offset ordinary (W-2) income if you actively participate and your MAGI is under $100k (phasing out to $0 by $150k); unused losses carry forward. On sale, claimed depreciation is recaptured at up to 25%, and gains may owe capital-gains tax (a 1031 exchange can defer both). Figures are a year-1 estimate at your 24.0% rate — not tax advice; consult a CPA.
Schools (NCES district)
- District
- La Conner School District
- NCES district ID
- 5304110
- Math proficiency
- 34% ▼ -4.00%
- Reading proficiency
- 50% ▼ -3.00%
- Median HH income
- $55,929
- Composite
- 39.03/100
- National rank
- #8280
- State rank
- #204 of 291 in WA
Livability — La Conner
- Score
- 83/100
- State rank
- #56
- US rank
- #1009
Category grades
Schools grade is shown separately in the Schools card above.
Census & demographics
- Population (ZIP)
- 4,448
Population outlook (Skagit County) Hauer SSP2
- Today (2025)
- 131,498 people
- By 2030
- 135,556 · +3.1%
- By 2040
- 141,717 · +7.8%
- By 2050
- 145,714 · +10.8%
- By 2075
- 152,201 · +15.7%
- By 2100
- 147,980 · +12.5%
Race, ethnicity, and origin ACS 2023
- Neighborhood character
- Predominantly White (73%)
- Race & ethnicity
- White 73% Native American 13% Two or more races 8% Hispanic / Latino 7% Asian 1%
- Hispanic origin (detail)
- Mexican 6%
- Common ancestry
- Portuguese 12% Lithuanian 3% Romanian 3%
- Foreign-born
- 5% · Canada
- Languages at home
- 94% English-only · Spanish 2% Russian/Polish/Slavic 1%
Political lean MEDSL · Skagit
- 2024 margin
- Lean D (+8.9) · D 52.9% · R 44.0% · Other 3.0%
- 2008→2024 swing
- -0.7pp no change · 2008: 9.6pp · 2024: 8.9pp
- All cycles
- 2024: D+8.9 2020: D+7.5 2016: D+3.2 2012: D+5.8 2008: D+9.6
Not yet ingested
- Civics
- —
Market trends
- HPI YoY
- ▼ -50.71%
- Current HPI
- 253.6348
- Rent YoY
- —
- Metro
- —
- State GDP YoY
- ▲ 4.65%
- F500 in state
- 22
Industry mix (Fortune 500 HQ in WA)
| Industry | F500 HQs | Revenue |
|---|---|---|
| Retail | 2 | $269B |
|
||
| Technology / Retail | 1 | $638B |
|
||
| Technology | 1 | $245B |
|
||
| Telecommunications | 1 | $38B |
|
||
| Food / Beverage | 1 | $36B |
|
||
| Automotive / Trucks | 1 | $34B |
|
||
Price history
+181.3% since first listed4 events — show timeline
- 2025-10-24 Pending — NWMLS as Distributed by MLS Grid
- 2025-08-29 Listed $450,000 NWMLS as Distributed by MLS Grid
- 2003-10-16 Sold (MLS) $154,000 NWMLS as Distributed by MLS Grid
- 2003-08-26 Listed $159,950 NWMLS as Distributed by MLS Grid
Property tax history
-6.5%/yrLatest (2014): $1,271 · -15.6% YoY. Source: county tax records.
Cash-flow waterfall
monthlySold comps — $/sqft
last 12 mo · ≤1 miLoading sold comps…