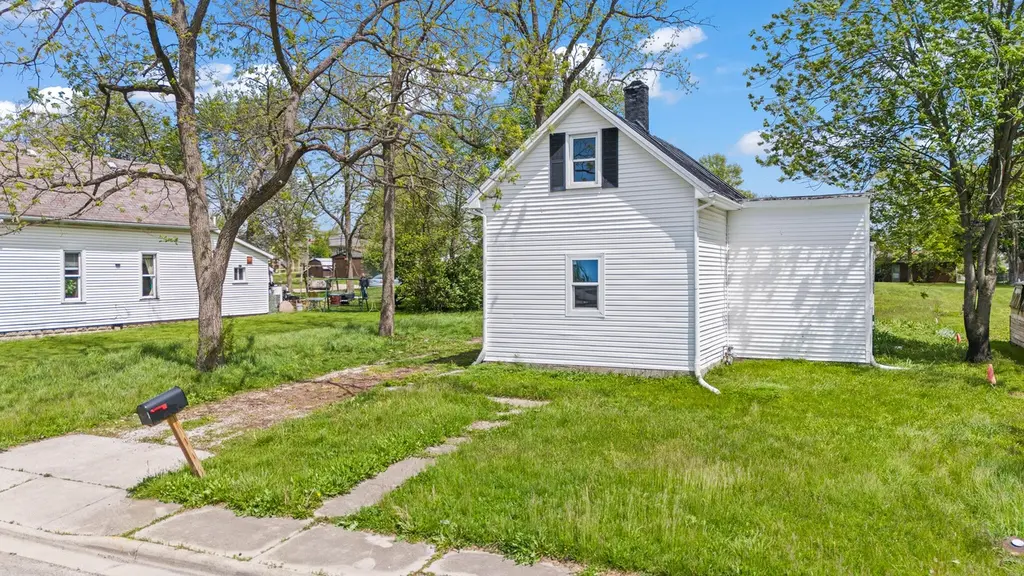
309 S Market St · Union City, OH
Flood risk 1/10 · Minimal
- FEMA flood zone
- X (unshaded)
- Chance of flooding over 30 yrs
- 0.0%
- Est. flood insurance / yr
- $507 – $1,088
Fire risk 1/10 · Minimal
- Est. fire insurance / yr
- $713 – $1,323
Heat risk 3/10 · Minor
- Hot days now (above 99°F)
- 7 days/yr
- Hot days in 30 yrs
- 18 days/yr
Wind risk 2/10 · Minimal
- Chance of severe wind over 30 yrs
- —
Air-quality risk 3/10 · Minor
- Unhealthy air days now
- 2 days/yr
- Unhealthy air days in 30 yrs
- 3 days/yr
Risk factors via First Street. Map © Google.
Why this score? — see what drove the D grade
The composite is a weighted blend of 9 inputs, each scored 0–100. Each bar is that input's sub-score; the figure is the points it added to the 100-point composite (weight × sub-score).
- Cash flow +12.8/30.0
- Appreciation +10.0/10.0
- Schools +4.5/10.0
- DSCR +3.8/10.0
- Livability +3.2/5.0
- Rent growth +2.5/5.0
- Condition / age +2.5/5.0
- 1% rule +2.3/10.0
- ARV discount +0.0/15.0
$158,000
🖨 Deal sheet (PDF) 📄 Offer letter ✓ Due diligence
Listing remarks MLS
Discover a charming retreat nestled in the heart of Union City. This fully remodeled single-family residence offers an inviting atmosphere, tour here to see all of the updates and improvements. The home encompasses 1,295 square feet of thoughtfully arranged living space, providing ample room for relaxation and daily activities. With two comfortable bedrooms and 2 full bathrooms, it offers a practical layout. Kitchen appliances are included with the purchase, all you need to do here is MOVE-IN Enjoy the benefits of a generous lot, spanning 0.19 acres, providing a wonderful outdoor environment for leisure and gardening. The property's location on S Market St provides easy access to local amenities and the community.
Key facts
- Easy access
- Fully remodeled
- Generous lot
Tags
Property features AI
Finance
- Financial info: Offered for sale
Exterior
- Parking: No garage
- Home design: 2-story home; Vinyl siding
- Construction: Vinyl siding construction
- Exterior features: Residential lot (approx. 50 x 166)
Interior
- Kitchen: Eat-in kitchen (14 x 16)
- Bedrooms: Second-floor bedroom (9 x 11); Main-level bedroom (12 x 13)
- Bathrooms: 2 full bathrooms; 1 main-level bathroom
- Heating & cooling: Forced air heating; Central air conditioning
- Interior features: Crawl space basement; Eat-in kitchen
Neighborhood map
What this means for you Summary
Snapshot
- This is a 3-bed/1.0-bath single-family listed at $158k.
Deal economics
- At list price, monthly cash flow is $-14 ($-173/yr) — negative.
- To cash-flow at today's rent, offer at most $155k (1.6% below list).
- To meet the 1% rule (rent ≥ 1% of price), the offer needs to be $116k (26.5% below list).
- Recommended offer: $116k (26.5% below list) — sets the bar for 1% rule.
Location & tenants
- Location reads 63/100 on livability (#854 in OH) — a middle-class / working-renter tenant base. Strengths: cost of living A+, crime A, housing B; Watch: health & safety C-, amenities F, commute F.
- Mississinawa Valley Local (rural): math 56% / reading 51% proficiency, ranked #405 of 656 in OH (top 62%) — acceptable for families but not a draw, mixed tenant base, ~2y average lease; 70% free/reduced lunch — lower-income household profile, screen leases tightly.
- Zoned schools: Mississinawa Valley Elementary School (math 56% / reading 49%, grade C-, #846 of 1,584 statewide, top 54%, 316 students, 99% FRL); Mississinawa Valley Jr/Sr High School (math 57% / reading 57%, grade C, #275 of 781 statewide, top 37%, 280 students, 0% FRL) — zoned schools average 50% FRL vs 70% district-wide (20 pts lower); this property's tenant base skews higher-income than the district average.
- Market conditions: 15 active listings in the ZIP; 43 units permitted in Darke County in 2024 (0 in 5+ unit buildings).
Forward outlook
- In year one you build about $17k of equity ($1k loan paydown + $16k appreciation (10.0% local appreciation)).
- Darke County population projected at -20% by 2050 — secular population decline; favor cash flow + early exit over multi-decade hold.
- At projected returns (10.0% appreciation + 3.0% rent growth), your $44k cash investment doubles in ~3 years — after that, you're playing with house money.
- By year 3, paydown + projected appreciation supports a ~$43k cash-out refi (75% LTV) — recoverable capital for the next deal without selling this one.
Negotiation context
- It's been on market 32 days — a 3% lower offer ($153k) is reasonable based on typical stale-listing flexibility.
- 4 sale attempts with the ask held roughly flat each time — persistent listings suggest the price (not the market) is what's stuck; bring a comps-based counter.
- Current owner paid $31k; list at $158k implies a 407% gain — meaningful room to come down on a strong offer.
Risks & watch-outs
- Watch-outs: built in 1900 — expect roof / HVAC / electrical / plumbing capex.
Questions for the listing agent
- What do current leases actually rent for vs. the listed asking? Can we see a recent rent roll and the last 12 months of T-12 income?
- It's been on market 32 days. Have you received any prior offers? Is the seller open to a 27% concession, seller financing, or rate buy-down credit?
- Built in 1900 — when were the roof, HVAC, electrical panel, plumbing, and water heater last replaced?
- Is there a deadline driving the sale (1031 exchange, divorce, estate, relocation)? That informs how much negotiation room exists.
- The area grade is low — what's the realistic commute time and amenity access for the typical tenant pool here? Any planned neighborhood developments (good or bad) we should know about?
- What's the average days-on-market for RENTAL listings here right now (not sales)? A rising rental-DOM trend means longer vacancies and softer asking-rent achievability than the comps imply.
- What's the recent tenant-quality profile in this submarket — average credit score on applications, eviction rate, late-payment / NSF rate, and stable-employment percentage? A property-management company in the area should have these aggregated.
- How much new for-sale + rental construction is in the pipeline within 1–3 miles? Heavy new supply typically softens prices + rents 12–24 months out; constrained supply supports both.
Investment metrics
- 1% rule
- 0.73% ✗
- Cap rate
- 6.18%
- Cash-on-cash
- -0.39%
- DSCR
- 0.98
- GRM
- 11.3
CMA / ARV
- ARV (on-the-fly)
- $133,385
- Comps found
- 12
Show comp detail 12 sales within ~0.75 mi
| Address | Dist | Beds/Ba | Sqft | Sold | Price | $/sf | Match |
|---|---|---|---|---|---|---|---|
| 309 S Market St | 0.00mi | 3/1.0 | 1,295 (0%) | 8mo | $31,150 | $24 | 94 |
| 226 E Main St | 0.10mi | 3/1.0 | 1,396 (+8%) | 5mo | $149,700 | $107 | 78 |
| 305 E North St | 0.39mi | 3/1.5 | 1,385 (+7%) | 3mo | $45,000 | $32 | 65 |
| 224 S 1st St | 0.06mi | 3/1.5 | 1,476 (+14%) | 9mo | $159,900 | $108 | 65 |
| 225 S State Line St | 0.11mi | 2/1.0 (-1) | 1,212 (-6%) | 18mo | $80,000 | $66 | 64 |
| 635 W Pearl St | 0.54mi | 2/1.0 (-1) | 1,280 (-1%) | 6mo | $48,720 | $38 | 63 |
| 723 E Central St | 0.57mi | 3/1.0 | 1,341 (+4%) | 10mo | $25,000 | $19 | 59 |
| 9299 Worth Rd | 0.63mi | 3/2.0 | 1,360 (+5%) | 4mo | $215,000 | $158 | 54 |
| 706 Lynwood St | 0.68mi | 2/1.5 (-1) | 1,388 (+7%) | 8mo | $142,300 | $103 | 43 |
| 911 E Central St | 0.65mi | 2/1.5 (-1) | 1,455 (+12%) | 1mo | $174,000 | $120 | 42 |
| 709 Lynwood Ct | 0.71mi | 3/1.5 | 1,396 (+8%) | 13mo | $137,500 | $98 | 41 |
| 717 Lynwood Ct | 0.74mi | 3/1.5 | 1,107 (-14%) | 24mo | $129,900 | $117 | 20 |
Match score weights: distance 35% · size 25% · config 20% · recency 20%. Top-matched comps best support the ARV.
Projected returns pro-forma
10.0% appreciation · 3.0% rent growth · sell at horizon
- IRR
- 24.0%
- Equity multiple
- 2.92×
- Total profit
- $85,053
- Equity at exit
- $142,339
- IRR
- 21.3%
- Equity multiple
- 6.67×
- Total profit
- $251,027
- Equity at exit
- $306,959
Cash invested: $44,240 (down + closing). Projections, not guarantees.
Landlord ↔ Tenant lean methodology
- Overall (STATE)
- 73 Landlord-Friendly
- State Ohio
- 73 Landlord-Friendly · R+6
- County
- — inherits STATE
- City
- — inherits STATE
ZIP-level market 45390
- Home prices YoY
- 5.1%
- Active inventory
- 15
- Price-to-rent
- 11.3×
Monthly cashflow live
- Estimated rent
- $1,161 medium interval (Pro) →
- Mortgage (P&I)
- −$829
- Tax from tax record
- −$37 /mo · $445/yr
- Insurance
- −$66
- HOA
- −$0
- Lot rent
- −$0
- Vacancy / Maint / Mgmt
- −$244
- Net cashflow
- $-14
Break-even live
Sensitivity live
| Price | -10% $75 | -5% $30 | +0% $-14 | +5% $-59 | +10% $-104 |
|---|---|---|---|---|---|
| Rent | -10% $-106 | -5% $-60 | +0% $-14 | +5% $31 | +10% $77 |
| Rate | -1.0pp $65 | -0.5pp $26 | base $-14 | +0.5pp $-55 | +1.0pp $-97 |
UW: 25.0% down · 7.5% · 30yr · 1.5% tax · 5.0% vac · 8.0% maint · 8.0% mgmt
Financing live
Cash to close
- Down payment
- $39,500
- Closing costs
- $4,740
- Reserves months
- —
- Total cash needed
- —
Loan-product check · same deal, 3 products live
Conventional
25% down · 7.5% · 30yr
- Down + closing
- —
- Monthly P&I
- —
- Monthly cashflow
- —
- DSCR
- —
- Eligible?
- —
Personal DTI + credit; lowest rate.
DSCR
20% down · 8.5% · 30yr
- Down + closing
- —
- Monthly P&I
- —
- Monthly cashflow
- —
- DSCR
- —
- Eligible?
- —
No personal income docs; deal must DSCR.
Hard money
10% down · 12.0% · 12mo
- Down + closing
- —
- Monthly P&I
- —
- Monthly cashflow
- —
- DSCR
- —
- Eligible?
- —
Short-term bridge; refi at stabilization.
Listing history 29 events
-
2026-06-22days on market $158,000 Active 32 DOM
-
2026-06-21days on market $158,000 Active 31 DOM
-
2026-06-21days on market $158,000 Active 30 DOM
-
2026-06-18days on market $158,000 Active 28 DOM
-
2026-06-17days on market $158,000 Active 27 DOM
-
2026-06-16days on market $158,000 Active 26 DOM
-
2026-06-15days on market $158,000 Active 25 DOM
-
2026-06-13days on market $158,000 Active 23 DOM
-
2026-06-12days on market $158,000 Active 22 DOM
-
2026-06-09days on market $158,000 Active 19 DOM
-
2026-06-08days on market $158,000 Active 18 DOM
-
2026-06-08days on market $158,000 Active 17 DOM
-
2026-06-05days on market $158,000 Active 15 DOM
-
2026-06-04days on market $158,000 Active 13 DOM
-
2026-06-02days on market $158,000 Active 12 DOM
-
2026-06-01days on market $158,000 Active 11 DOM
-
2026-05-31days on market $158,000 Active 10 DOM
-
2026-05-19$158,000 Active 723-char remark
Show marketing remark (723 chars)
Discover a charming retreat nestled in the heart of Union City. This fully remodeled single-family residence offers an inviting atmosphere, tour here to see all of the updates and improvements. The home encompasses 1,295 square feet of thoughtfully arranged living space, providing ample room for relaxation and daily activities. With two comfortable bedrooms and 2 full bathrooms, it offers a practical layout. Kitchen appliances are included with the purchase, all you need to do here is MOVE-IN Enjoy the benefits of a generous lot, spanning 0.19 acres, providing a wonderful outdoor environment for leisure and gardening. The property's location on S Market St provides easy access to local amenities and the community.
-
2026-05-19$158,000 Active
Show marketing remark (723 chars)
Discover a charming retreat nestled in the heart of Union City. This fully remodeled single-family residence offers an inviting atmosphere, tour here to see all of the updates and improvements. The home encompasses 1,295 square feet of thoughtfully arranged living space, providing ample room for relaxation and daily activities. With two comfortable bedrooms and 2 full bathrooms, it offers a practical layout. Kitchen appliances are included with the purchase, all you need to do here is MOVE-IN Enjoy the benefits of a generous lot, spanning 0.19 acres, providing a wonderful outdoor environment for leisure and gardening. The property's location on S Market St provides easy access to local amenities and the community.
-
2025-10-31soldstatus $31,150 Closed 171-char remark
Show marketing remark (171 chars)
Great investment opportunity! This fixer upper has tons of potential and is ready for your vision. Ideal for investors, flippers or anyone wanting to customize their home.
-
2025-10-10$49,500 Active 171-char remark
Show marketing remark (171 chars)
Great investment opportunity! This fixer upper has tons of potential and is ready for your vision. Ideal for investors, flippers or anyone wanting to customize their home.
-
2025-10-02soldstatus $13,500 Closed
-
2025-09-19historical ActiveUnderContract
-
2025-09-16$19,900 Active
-
2006-05-31soldstatus $16,667
-
2002-01-30soldstatus $21,200
-
1997-08-13soldstatus $74,640
-
1989-05-12soldstatus $9,900
-
1988-09-21soldstatus $10,000
ⓘ Source: listings_history table (triggers on properties + properties_extension) + one-shot
backfill from property_details.listing_events for pre-trigger history.
Tax reassessment forecast OH · Partial reset (capped growth)
- Current annual tax
- $445 · $37/mo
- Projected year-2 tax
- $1,455 · $121/mo
- Expected delta
- +$1,010/yr (+$84/mo · 227.0%)
ⓘ Screening estimate from a state-policy table — verify with the county assessor before closing.
Climate risk First Street
- Flood 1/10 Low FEMA zone X (unshaded) · 0% chance over 30 yrs
- Wildfire 1/10 Low
- Heat 3/10 Moderate 7 d/yr ≥99°F today · 18 d/yr by 30 yrs out
- Wind 2/10 Low
- Air quality 3/10 Moderate 2 unhealthy d/yr today · 3 by 30 yrs out
Nearby sold comps map
Loading sold comps map…
Walkable amenities ~0.75 mi
Loading nearby amenities…
Taxation est. · year 1
- Rental income
- $13,930
- − Mortgage interest
- −$8,850
- − Property taxes
- −$445
- − Insurance
- −$790
- − Repairs & maintenance
- −$1,114
- − Management
- −$1,114
- − Depreciation
- −$4,596
- Taxable loss
- −$2,980
- Est. tax savings @ 24.0%
- +$715
- After-tax cash flow
- $542/yr
For passive investors: Depreciation is non-cash, so a rental often shows a tax loss while cash-flowing — sheltering income. Rental losses are passive: they offset passive income freely, and up to $25,000/yr can offset ordinary (W-2) income if you actively participate and your MAGI is under $100k (phasing out to $0 by $150k); unused losses carry forward. On sale, claimed depreciation is recaptured at up to 25%, and gains may owe capital-gains tax (a 1031 exchange can defer both). Figures are a year-1 estimate at your 24.0% rate — not tax advice; consult a CPA.
Schools (NCES district)
- District
- Mississinawa Valley Local
- NCES district ID
- 3904667
- Math proficiency
- 56% ▼ -11.00%
- Reading proficiency
- 51% ▼ -13.00%
- Median HH income
- $40,999
- Composite
- 44.86/100
- National rank
- #2727
- State rank
- #405 of 656 in OH
Livability — Union City
- Score
- 63/100
- State rank
- #854
- US rank
- #15985
Category grades
Schools grade is shown separately in the Schools card above.
Census & demographics
- Census place
- Union City, OH
- County
- Darke · 50,606 people
- Population (ZIP)
- 3,349
- Household income
- $46,974
- Rent vs Own
- Severe rent burden
- 5.9
Population outlook (Darke County) Hauer SSP2
- Today (2025)
- 49,377 people
- By 2030
- 47,494 · -3.8%
- By 2040
- 43,553 · -11.8%
- By 2050
- 39,320 · -20.4%
- By 2075
- 30,091 · -39.1%
- By 2100
- 21,110 · -57.2%
Race, ethnicity, and origin ACS 2023
- Neighborhood character
- Predominantly White (88%)
- Race & ethnicity
- White 88% Hispanic / Latino 9% Two or more races 6% Asian 2%
- Hispanic origin (detail)
- Mexican 4% Cuban 4%
- Common ancestry
- Iranian 1% Slovak 1%
- Foreign-born
- 2% · Canada, China
- Languages at home
- 96% English-only · Spanish 2% Chinese 2%
Political lean MEDSL · Darke
- 2024 margin
- Solid R (+65.4) · D 17.0% · R 82.3%
- 2008→2024 swing
- -29.2pp toward R · 2008: -36.1pp · 2024: -65.4pp
- All cycles
- 2024: R+65.4 2020: R+63.6 2016: R+61.2 2012: R+44.9 2008: R+36.1
Not yet ingested
- Civics
- —
Market trends
- HPI YoY
- ▲ 13.15%
- Current HPI
- 270.1901
- Rent YoY
- —
- Metro
- —
- State GDP YoY
- ▲ 1.98%
- F500 in state
- 48
Industry mix (Fortune 500 HQ in OH)
| Industry | F500 HQs | Revenue |
|---|---|---|
| Insurance | 3 | $145B |
|
||
| Industrial Machinery | 3 | $49B |
|
||
| Financial Services | 3 | $24B |
|
||
| Consumer Goods | 2 | $93B |
|
||
| Aerospace / Defense | 2 | $47B |
|
||
| Utilities | 2 | $33B |
|
||
Price history
+1480.0% since first listed12 events — show timeline
- 2026-05-19 Listed $158,000 Dayton MLS
- 2026-05-19 Listed $158,000 WRIST
- 2025-10-31 Sold (MLS) $31,150 Dayton MLS
- 2025-10-10 Listed $49,500 Dayton MLS
- 2025-10-02 Sold (MLS) $13,500 Dayton MLS
- 2025-09-19 Contingent — Dayton MLS
- 2025-09-16 Listed $19,900 Dayton MLS
- 2006-05-31 Sold (Public Records) $16,667 Public Records
- 2002-01-30 Sold (Public Records) $21,200 Public Records
- 1997-08-13 Sold (Public Records) $74,640 Public Records
- 1989-05-12 Sold (Public Records) $9,900 Public Records
- 1988-09-21 Sold (Public Records) $10,000 Public Records
Property tax history
+4.7%/yrLatest (2025): $445 · -0.2% YoY. Source: county tax records.
Cash-flow waterfall
monthlySold comps — $/sqft
last 12 mo · ≤1 miLoading sold comps…