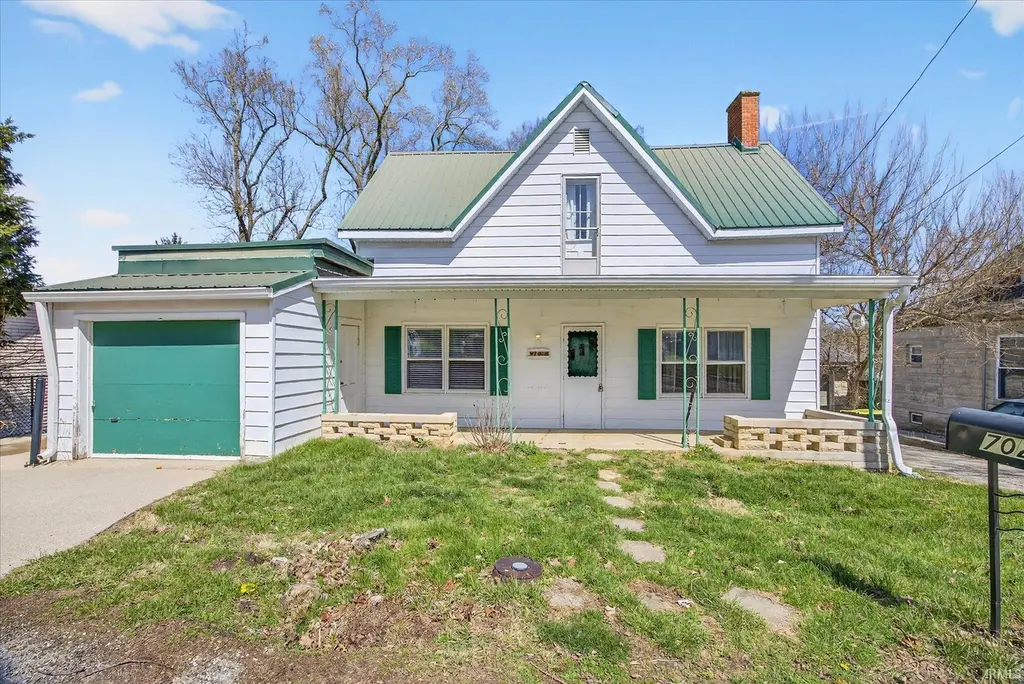
702 W Association St · Ellettsville, IN
Flood risk 1/10 · Minimal
- FEMA flood zone
- X (unshaded)
- Chance of flooding over 30 yrs
- 0.0%
- Est. flood insurance / yr
- $473 – $860
Fire risk 3/10 · Minor
- Est. fire insurance / yr
- $717 – $1,331
Heat risk 4/10 · Minor
- Hot days now (above 104°F)
- 7 days/yr
- Hot days in 30 yrs
- 19 days/yr
Wind risk 2/10 · Minimal
- Chance of severe wind over 30 yrs
- 1.0%
Air-quality risk 1/10 · Minimal
- Unhealthy air days now
- 0 days/yr
- Unhealthy air days in 30 yrs
- 0 days/yr
Risk factors via First Street. Map © Google.
Why this score? — see what drove the B grade
The composite is a weighted blend of 9 inputs, each scored 0–100. Each bar is that input's sub-score; the figure is the points it added to the 100-point composite (weight × sub-score).
- Cash flow +27.7/30.0
- ARV discount +15.0/15.0
- DSCR +9.7/10.0
- 1% rule +8.0/10.0
- Schools +4.0/10.0
- Livability +3.5/5.0
- Rent growth +2.5/5.0
- Condition / age +2.5/5.0
- Appreciation +0.0/10.0
$209,000
🖨 Deal sheet 📄 Offer letter ✓ Due diligence
Listing remarks MLS
Historic downtown two story in need of a little TLC. Lots of space is found here including 3 bedrooms, 1-1/2 baths. Master Bedroom is on the main level. Ceramic tile and hardwood flooring are found throughout. There is a nice landing/sitting area on the upper level. This home is being sold AS IS.
Key facts
- Screened-in porch
- Modern updates
- Walking distance
Tags
Property features AI
Exterior
- Parking: Attached garage (1 space); Additional off-street parking
- Utilities: Public water; Public sewer; Electric service (electric water heater) and natural gas
- Home design: Single-family residence; Site-built home; Two stories
- Construction: Aluminum siding; Stone foundation; Built with walk-out full basement (sump pump)
- Exterior features: Covered porch
Interior
- Kitchen: Dishwasher; Microwave; Refrigerator; Gas range
- Bathrooms: Two full bathrooms; One full bathroom on the main level
- Heating & cooling: Natural gas forced-air heating; Central air conditioning; Ceiling fan(s) (also listed under interior features)
- Interior features: Ceiling fans throughout; Window treatments; Living room fireplace (1)
- Laundry & utility: Washer and dryer included; Main-level laundry; Electric water heater
Neighborhood map
What this means for you Summary
Snapshot
- This is a 3-bed/1.5-bath single-family listed at $209k.
Deal economics
- At list price, monthly cash flow is $628 ($8k/yr) — positive.
- The deal already cash-flows at list — no discount required.
- Meets the 1% rule at list price ($3k rent vs $209k).
- Recommended offer: $196k (6.0% below list) — sets the bar for market timing.
- Cap rate 9.9% vs local median 3.3% in Ellettsville — top-decile yield for the area; either an underpriced asset or a hidden risk that comps aren't pricing in. Stress-test before assuming the spread holds.
Location & tenants
- Location reads 70/100 on livability (#153 in IN) — a middle-class / working-renter tenant base. Strengths: cost of living A+, housing A+, crime A-; Watch: amenities F, commute F, health & safety F.
- Richland-Bean Blossom Community School Corporation (suburban): math 41% / reading 52% proficiency, ranked #82 of 301 in IN (top 27%) — families likely to look elsewhere, expect single-tenant / working-renter base with shorter leases.
- Zoned schools: Edgewood Primary School (650 students, 38% FRL); Edgewood Junior High School (math 30% / reading 51%, grade F, #117 of 330 statewide, top 36%, 603 students, 40% FRL); Edgewood High School (math 42% / reading 77%, grade C+, #49 of 369 statewide, top 16%, 820 students, 33% FRL).
- Market conditions: 64 active listings in the ZIP; 2 comparable units currently listed for rent nearby; 872 units permitted in Monroe County in 2024 (663 in 5+ unit buildings).
Forward outlook
- Local home prices are declining (-3.0%/yr); year-one equity from $1k of loan paydown is wiped out by about $6k of value loss. Plan a longer hold.
- Monroe County population projected at +29% by 2050 — long-run rental-demand tailwind backs the buy-and-hold thesis.
- At projected returns (-3.0% appreciation + 3.0% rent growth), your $59k cash investment doubles in ~9 years — after that, you're playing with house money.
Negotiation context
- It's been on market 81 days — a 6% lower offer ($196k) is reasonable based on typical stale-listing flexibility.
- 5 sale attempts since 8y ago; this cycle's ask has dropped $50k (19%) from the opening price — seller is motivated, your offer sets the floor, not the list.
- Current owner paid $82k; list at $209k implies a 153% gain — meaningful room to come down on a strong offer.
Risks & watch-outs
- Watch-outs: built in 1899 — expect roof / HVAC / electrical / plumbing capex.
Questions for the listing agent
- It's been on market 81 days. Have you received any prior offers? Is the seller open to a 6% concession, seller financing, or rate buy-down credit?
- Built in 1899 — when were the roof, HVAC, electrical panel, plumbing, and water heater last replaced?
- Why hasn't it sold? Are there any deal-killer items the seller is aware of (foundation, flood, title, zoning, code violations)?
- Is there a deadline driving the sale (1031 exchange, divorce, estate, relocation)? That informs how much negotiation room exists.
- What's the average days-on-market for RENTAL listings here right now (not sales)? A rising rental-DOM trend means longer vacancies and softer asking-rent achievability than the comps imply.
- What's the recent tenant-quality profile in this submarket — average credit score on applications, eviction rate, late-payment / NSF rate, and stable-employment percentage? A property-management company in the area should have these aggregated.
- How much new for-sale + rental construction is in the pipeline within 1–3 miles? Heavy new supply typically softens prices + rents 12–24 months out; constrained supply supports both.
Investment metrics
- 1% rule
- 1.30% ✓
- Cap rate
- 9.90%
- Cash-on-cash
- 12.88%
- DSCR
- 1.57
- GRM
- 6.4
CMA / ARV
- ARV (on-the-fly)
- $304,128
- Comps found
- 12
Show comp detail 12 sales within ~0.75 mi
| Address | Dist | Beds/Ba | Sqft | Sold | Price | $/sf | Match |
|---|---|---|---|---|---|---|---|
| 804 W Oak St | 0.08mi | 4/3.0 (+1) | 2,313 (+10%) | 0mo | $287,315 | $124 | 69 |
| 7227 W Mustang Dr | 0.38mi | 4/2.0 (+1) | 2,086 (-1%) | 6mo | $405,400 | $194 | 68 |
| 302 S Edgewood Dr | 0.23mi | 3/2.0 | 2,296 (+9%) | 9mo | $240,000 | $105 | 65 |
| 203 S Sale St | 0.08mi | 4/2.5 (+1) | 1,830 (-13%) | 5mo | $352,500 | $193 | 61 |
| 114 E Chester St | 0.48mi | 4/2.0 (+1) | 2,140 (+1%) | 16mo | $224,722 | $105 | 55 |
| 601 N Robin Dr | 0.63mi | 4/2.5 (+1) | 2,016 (-4%) | 5mo | $210,000 | $104 | 50 |
| 111 E Renee Dr | 0.47mi | 4/2.5 (+1) | 2,016 (-4%) | 16mo | $250,000 | $124 | 48 |
| 501 S Turtleback Creek Rd | 0.59mi | 4/3.0 (+1) | 2,322 (+10%) | 0mo | $335,000 | $144 | 44 |
| 7215 W Mustang Dr | 0.36mi | 4/2.5 (+1) | 1,834 (-13%) | 9mo | $357,000 | $195 | 44 |
| 635 N Robin Dr | 0.74mi | 3/2.0 | 1,862 (-12%) | 3mo | $281,000 | $151 | 41 |
| 412 S Cedar Dr | 0.62mi | 4/1.5 (+1) | 1,870 (-12%) | 14mo | $262,500 | $140 | 36 |
| 525 S Poplar Dr | 0.70mi | 3/2.0 | 1,836 (-13%) | 13mo | $279,000 | $152 | 33 |
Match score weights: distance 35% · size 25% · config 20% · recency 20%. Top-matched comps best support the ARV.
Projected returns pro-forma
-3.0% appreciation · 3.0% rent growth · sell at horizon
- IRR
- 2.8%
- Equity multiple
- 1.11×
- Total profit
- $6,210
- Equity at exit
- $31,163
- IRR
- 12.3%
- Equity multiple
- 1.98×
- Total profit
- $57,241
- Equity at exit
- $18,071
Cash invested: $58,520 (down + closing). Projections, not guarantees.
Landlord ↔ Tenant lean methodology
- Overall (STATE)
- 90 Strongly Landlord-Friendly
- State Indiana
- 90 Strongly Landlord-Friendly · R+11
- County
- — inherits STATE
- City
- — inherits STATE
ZIP-level market 47429
- Home prices YoY
- -26.8%
- Active inventory
- 64
- Price-to-rent
- 6.4×
Monthly cashflow live
- Estimated rent
- $2,708 medium interval (Pro) →
- Mortgage (P&I)
- −$1,096
- Tax from tax record
- −$328 /mo · $3,940/yr
- Insurance
- −$87
- HOA
- −$0
- Vacancy / Maint / Mgmt
- −$569
- Net cashflow
- $628
Break-even live
UW: 25.0% down · 7.5% · 30yr · 1.5% tax · 5.0% vac · 8.0% maint · 8.0% mgmt
Financing live
Cash to close
- Down payment
- $52,250
- Closing costs
- $6,270
- Reserves months
- —
- Total cash needed
- —
Loan-product check · same deal, 3 products live
Conventional
25% down · 7.5% · 30yr
- Down + closing
- —
- Monthly P&I
- —
- Monthly cashflow
- —
- DSCR
- —
- Eligible?
- —
Personal DTI + credit; lowest rate.
DSCR
20% down · 8.5% · 30yr
- Down + closing
- —
- Monthly P&I
- —
- Monthly cashflow
- —
- DSCR
- —
- Eligible?
- —
No personal income docs; deal must DSCR.
Hard money
10% down · 12.0% · 12mo
- Down + closing
- —
- Monthly P&I
- —
- Monthly cashflow
- —
- DSCR
- —
- Eligible?
- —
Short-term bridge; refi at stabilization.
Rent comps 2 comps
| Address | Beds | Baths | Sqft | Rent | $/sqft | DOM | Units | Dist |
|---|---|---|---|---|---|---|---|---|
| 123 N Sale St Unit 3 Ellettsville, IN | 3.0 | 2.0 | 3000 | $3,000 | $1.00 | 21d | 1 | 0.09mi |
| 213 S Poplar Dr Ellettsville, IN | 3.0 | 2.0 | 1654 | $1,800 | $1.09 | 21d | 1 | 0.35mi |
Listing history 26 events
-
2026-06-19days on market $209,000 Active 81 DOM
-
2026-06-18days on market $209,000 Active 80 DOM
-
2026-06-17days on market $209,000 Active 79 DOM
-
2026-06-16days on market $209,000 Active 78 DOM
-
2026-06-15days on market $209,000 Active 77 DOM
-
2026-06-14days on market $209,000 Active 75 DOM
-
2026-06-13days on market $209,000 Active 74 DOM
-
2026-06-10days on market $209,000 Active 72 DOM
-
2026-06-09days on market $209,000 Active 71 DOM
-
2026-06-09price $209,000 Active 70 DOM
-
2026-06-08days on market $219,000 Active 70 DOM
-
2026-06-07days on market $219,000 Active 69 DOM
-
2026-06-03days on market $219,000 Active 65 DOM
-
2026-06-02pricedays on market $219,000 Active 64 DOM
-
2026-06-01days on market $229,000 Active 63 DOM
-
2026-05-31days on market $229,000 Active 62 DOM
-
2026-05-30days on market $229,000 Active 61 DOM
-
2026-05-22status Active
-
2026-05-16historical Active Under Contract
-
2026-04-24price $229,000
-
2026-04-12price $249,000
-
2026-03-30$259,000 Active
-
2020-07-31soldstatus $82,500 297-char remark
Show marketing remark (297 chars)
Historic downtown two story in need of a little TLC. Lots of space is found here including 3 bedrooms, 1-1/2 baths. Master Bedroom is on the main level. Ceramic tile and hardwood flooring are found throughout. There is a nice landing/sitting area on the upper level. This home is being sold AS IS.
-
2020-01-23$92,500 297-char remark
Show marketing remark (297 chars)
Historic downtown two story in need of a little TLC. Lots of space is found here including 3 bedrooms, 1-1/2 baths. Master Bedroom is on the main level. Ceramic tile and hardwood flooring are found throughout. There is a nice landing/sitting area on the upper level. This home is being sold AS IS.
-
2019-05-30$99,000
-
2018-05-10$99,000
ⓘ Source: listings_history table (triggers on properties + properties_extension) + one-shot
backfill from property_details.listing_events for pre-trigger history.
Tax reassessment forecast IN · Partial reset (capped growth)
- Current annual tax
- $3,940 · $328/mo
- Projected year-2 tax
- $3,940 · $328/mo
- Expected delta
- $0/yr ($0/mo · 0.0%)
ⓘ Screening estimate from a state-policy table — verify with the county assessor before closing.
Climate risk First Street
- Flood 1/10 Low FEMA zone X (unshaded) · 0% chance over 30 yrs
- Wildfire 3/10 Moderate
- Heat 4/10 Moderate 7 d/yr ≥104°F today · 19 d/yr by 30 yrs out
- Wind 2/10 Low 100% chance of damaging wind over 30 yrs
- Air quality 1/10 Low 0 unhealthy d/yr today · 0 by 30 yrs out
Nearby sold comps map
Loading sold comps map…
Walkable amenities ~0.75 mi
Loading nearby amenities…
Taxation est. · year 1
- Rental income
- $32,497
- − Mortgage interest
- −$11,707
- − Property taxes
- −$3,940
- − Insurance
- −$1,045
- − Repairs & maintenance
- −$2,600
- − Management
- −$2,600
- − Depreciation
- −$6,080
- Taxable income
- $4,525
- Est. tax owed @ 24.0%
- −$1,086
- After-tax cash flow
- $6,449/yr
For passive investors: Depreciation is non-cash, so a rental often shows a tax loss while cash-flowing — sheltering income. Rental losses are passive: they offset passive income freely, and up to $25,000/yr can offset ordinary (W-2) income if you actively participate and your MAGI is under $100k (phasing out to $0 by $150k); unused losses carry forward. On sale, claimed depreciation is recaptured at up to 25%, and gains may owe capital-gains tax (a 1031 exchange can defer both). Figures are a year-1 estimate at your 24.0% rate — not tax advice; consult a CPA.
Schools (NCES district)
- District
- Richland-Bean Blossom Community School Corporation
- NCES district ID
- 1809480
- Math proficiency
- 41% ▼ -15.00%
- Reading proficiency
- 52% ▼ -8.00%
- Median HH income
- $53,816
- Composite
- 40.21/100
- National rank
- #3780
- State rank
- #82 of 301 in IN
Livability — Ellettsville
- Score
- 70/100
- State rank
- #153
- US rank
- #7613
Category grades
Schools grade is shown separately in the Schools card above.
Census & demographics
- Census place
- Ellettsville, IN
- Population (ZIP)
- 7,402
Population outlook (Monroe County) Hauer SSP2
- Today (2025)
- 160,645 people
- By 2030
- 170,174 · +5.9%
- By 2040
- 188,326 · +17.2%
- By 2050
- 206,892 · +28.8%
- By 2075
- 256,650 · +59.8%
- By 2100
- 303,242 · +88.8%
Race, ethnicity, and origin ACS 2023
- Neighborhood character
- Predominantly White (93%)
- Race & ethnicity
- White 93% Two or more races 6% Hispanic / Latino 2%
- Common ancestry
- Italian 2% Slovak 2% Lithuanian 2%
- Foreign-born
- 1% · Canada
- Languages at home
- 98% English-only · Spanish 1%
Political lean MEDSL · Monroe
- 2024 margin
- Strong D (+27.4) · D 63.0% · R 35.5% · Other 1.5%
- 2008→2024 swing
- -4.7pp toward R · 2008: 32.2pp · 2024: 27.4pp
- All cycles
- 2024: D+27.4 2020: D+28.2 2016: D+23.7 2012: D+16.5 2008: D+32.2
Not yet ingested
- Civics
- —
Market trends
- HPI YoY
- ▼ -97.14%
- Current HPI
- 265.2863
- Rent YoY
- —
- Metro
- —
- State GDP YoY
- ▲ 2.90%
- F500 in state
- 18
Industry mix (Fortune 500 HQ in IN)
| Industry | F500 HQs | Revenue |
|---|---|---|
| Industrial Machinery | 2 | $37B |
|
||
| Healthcare | 1 | $177B |
|
||
| Pharmaceuticals | 1 | $45B |
|
||
| Metals / Steel | 1 | $18B |
|
||
| Agriculture | 1 | $17B |
|
||
| Packaging | 1 | $12B |
|
||
Price history
+131.3% since first listed9 events — show timeline
- 2026-05-22 Relisted — IRMLS
- 2026-05-16 Contingent — IRMLS
- 2026-04-24 Price Changed $229,000 IRMLS
- 2026-04-12 Price Changed $249,000 IRMLS
- 2026-03-30 Listed $259,000 IRMLS
- 2020-07-31 Sold (MLS) $82,500 IRMLS
- 2020-01-23 Listed $92,500 IRMLS
- 2019-05-30 Listed $99,000 IRMLS
- 2018-05-10 Listed $99,000 IRMLS
Property tax history
+14.6%/yrLatest (2024): $3,940 · +0.9% YoY. Source: county tax records.
Cash-flow waterfall
monthlySold comps — $/sqft
last 12 mo · ≤1 miLoading sold comps…