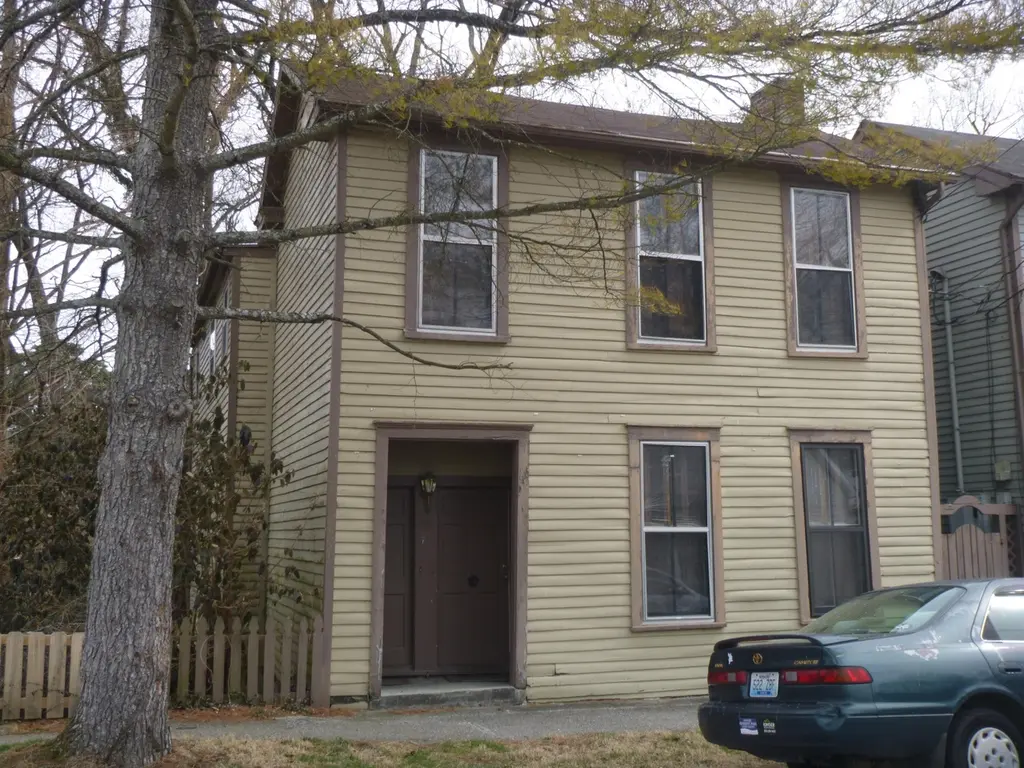
411 Logan St · Frankfort, KY
Flood risk 5/10 · Moderate
- FEMA flood zone
- X
- Chance of flooding over 30 yrs
- 0.24%
- Est. flood insurance / yr
- $507 – $1,088
Fire risk 1/10 · Minimal
- Est. fire insurance / yr
- $839 – $1,559
Heat risk 5/10 · Moderate
- Hot days now (above 104°F)
- 7 days/yr
- Hot days in 30 yrs
- 19 days/yr
Wind risk 2/10 · Minimal
- Chance of severe wind over 30 yrs
- 1.0%
Air-quality risk 2/10 · Minimal
- Unhealthy air days now
- 1 days/yr
- Unhealthy air days in 30 yrs
- 2 days/yr
Risk factors via First Street. Map © Google.
Why this score? — see what drove the C+ grade
The composite is a weighted blend of 9 inputs, each scored 0–100. Each bar is that input's sub-score; the figure is the points it added to the 100-point composite (weight × sub-score).
- Cash flow +25.7/30.0
- DSCR +8.6/10.0
- ARV discount +7.5/15.0
- 1% rule +5.5/10.0
- Rent growth +4.1/5.0
- Livability +3.7/5.0
- Schools +3.2/10.0
- Condition / age +2.5/5.0
- Appreciation +0.0/10.0
$164,900
🖨 Deal sheet (PDF) 📄 Offer letter ✓ Due diligence
Listing remarks
Special Capital-zoned duplex in highly desirable South Frankfort, just a half mile to the Capitol and an easy trip to Andy's Bakery! Each unit offers 2 bedrooms and 1 full bath, with a convenient laundry area located in the eat-in kitchen. Spacious living rooms and well-sized bedrooms provide comfortable living in both units. Historic zoning presents potential eligibility for Historic Tax Credits, adding value and opportunity for investors or owner-occupants alike. Great location with charm, convenience, and income potential! Sold as-is and as a package with 413 Logan (MLS#26005210). Agents read private remarks.
Key facts
- Income potential
- Laundry area
- 3,023 sq ft lot
Tags
Property features AI
Exterior
- Utilities: Electricity connected; Natural gas connected; Water connected; Sewer connected
- Home design: Duplex; 2 stories
- Construction: 2,285 total building area
- Exterior features: Shingle roof
Interior
- Bathrooms: 2 full bathrooms
- Heating & cooling: Forced air heating (natural gas); Central air conditioning
- Interior features: Washer hookup; Electric dryer hookup; Central air
- Laundry & utility: Washer hookup; Electric dryer hookup
Neighborhood map
What this means for you Summary
Snapshot
- This is a 4-bed/2.0-bath other listed at $165k.
Deal economics
- At list price, monthly cash flow is $397 ($5k/yr) — positive.
- The deal already cash-flows at list — no discount required.
- Meets the 1% rule at list price ($2k rent vs $165k).
- Recommended offer: $150k (9.0% below list) — sets the bar for market timing.
- Cap rate 9.2% vs local median 3.3% in Frankfort — top-decile yield for the area; either an underpriced asset or a hidden risk that comps aren't pricing in. Stress-test before assuming the spread holds.
Location & tenants
- Location reads 74/100 on livability (#111 in KY, #4,772 nationally) — a middle-class / working-renter tenant base. Strengths: cost of living A+, housing A+, crime B; Watch: employment C-, amenities F, health & safety F.
- Frankfort Independent (town): math 35% / reading 42% proficiency, ranked #45 of 165 in KY (top 27%) — families likely to look elsewhere, expect single-tenant / working-renter base with shorter leases.
- Zoned schools: Second Street School (math 30% / reading 38%, grade F, #329 of 676 statewide, top 49%, 571 students, 53% FRL); Frankfort High School (math 57% / reading 57%, grade C, #6 of 254 statewide, top 2%, 322 students, 40% FRL).
- Market conditions: Rents rising fast (+6.5%/yr); 303 active listings in the ZIP; 123 units permitted in Franklin County in 2024 (0 in 5+ unit buildings).
- This rent runs 32% of the median local income ($66k/yr) — at the standard rent-burdened threshold; future hikes will face affordability resistance.
Forward outlook
- Local home prices are declining (-3.0%/yr); year-one equity from $1k of loan paydown is wiped out by about $5k of value loss. Plan a longer hold.
- Franklin County population projected at +7% by 2050 — modest demand growth; plan on rents tracking national, not racing it.
- At projected returns (-3.0% appreciation + 6.5% rent growth), your $46k cash investment doubles in ~8 years — after that, you're playing with house money.
Negotiation context
- It's been on market 94 days — a 9% lower offer ($150k) is reasonable based on typical stale-listing flexibility.
- 2 sale attempts; this cycle's ask has dropped $20k (11%) from the opening price — seller is motivated, your offer sets the floor, not the list.
- Current owner paid $23k; list at $165k implies a 617% gain — meaningful room to come down on a strong offer.
Risks & watch-outs
- Climate carrying-cost: moderate flood risk; extreme-heat days projected 7→19/yr by 2055 (HVAC capex compounding) — expect insurance premiums to compound above CPI over the hold.
Questions for the listing agent
- It's been on market 94 days. Have you received any prior offers? Is the seller open to a 9% concession, seller financing, or rate buy-down credit?
- Why hasn't it sold? Are there any deal-killer items the seller is aware of (foundation, flood, title, zoning, code violations)?
- Is there a deadline driving the sale (1031 exchange, divorce, estate, relocation)? That informs how much negotiation room exists.
- Schools are D-rated, which usually means shorter tenancies and higher turnover. Who's the typical renter profile here, and what's been the actual vacancy rate?
- What's the average days-on-market for RENTAL listings here right now (not sales)? A rising rental-DOM trend means longer vacancies and softer asking-rent achievability than the comps imply.
- What's the recent tenant-quality profile in this submarket — average credit score on applications, eviction rate, late-payment / NSF rate, and stable-employment percentage? A property-management company in the area should have these aggregated.
- How much new for-sale + rental construction is in the pipeline within 1–3 miles? Heavy new supply typically softens prices + rents 12–24 months out; constrained supply supports both.
Investment metrics
- 1% rule
- 1.05% ✓
- Cap rate
- 9.18%
- Cash-on-cash
- 10.32%
- DSCR
- 1.46
- GRM
- 8.0
CMA / ARV
No comps found within radius.
Projected returns pro-forma
-3.0% appreciation · 6.55% rent growth · sell at horizon
- IRR
- 2.7%
- Equity multiple
- 1.11×
- Total profit
- $4,876
- Equity at exit
- $24,587
- IRR
- 15.1%
- Equity multiple
- 2.40×
- Total profit
- $64,670
- Equity at exit
- $14,258
Cash invested: $46,172 (down + closing). Projections, not guarantees.
Landlord ↔ Tenant lean methodology
- Overall (STATE)
- 83 Strongly Landlord-Friendly
- State Kentucky
- 83 Strongly Landlord-Friendly · R+16
- County
- — inherits STATE
- City
- — inherits STATE
ZIP-level market 40601
- Home prices YoY
- -26.1%
- Rents YoY
- 6.5%
- Active inventory
- 303
- Price-to-rent
- 8.0×
Monthly cashflow live
- Estimated rent
- $1,726 medium interval (Pro) →
- Mortgage (P&I)
- −$865
- Tax from tax record
- −$33 /mo · $392/yr
- Insurance
- −$69
- HOA
- −$0
- Vacancy / Maint / Mgmt
- −$362
- Net cashflow
- $397
Break-even live
Sensitivity live
| Price | -10% $490 | -5% $444 | +0% $397 | +5% $350 | +10% $304 |
|---|---|---|---|---|---|
| Rent | -10% $261 | -5% $329 | +0% $397 | +5% $465 | +10% $533 |
| Rate | -1.0pp $480 | -0.5pp $439 | base $397 | +0.5pp $354 | +1.0pp $311 |
UW: 25.0% down · 7.5% · 30yr · 1.5% tax · 5.0% vac · 8.0% maint · 8.0% mgmt
Financing live
Cash to close
- Down payment
- $41,225
- Closing costs
- $4,947
- Reserves months
- —
- Total cash needed
- —
Loan-product check · same deal, 3 products live
Conventional
25% down · 7.5% · 30yr
- Down + closing
- —
- Monthly P&I
- —
- Monthly cashflow
- —
- DSCR
- —
- Eligible?
- —
Personal DTI + credit; lowest rate.
DSCR
20% down · 8.5% · 30yr
- Down + closing
- —
- Monthly P&I
- —
- Monthly cashflow
- —
- DSCR
- —
- Eligible?
- —
No personal income docs; deal must DSCR.
Hard money
10% down · 12.0% · 12mo
- Down + closing
- —
- Monthly P&I
- —
- Monthly cashflow
- —
- DSCR
- —
- Eligible?
- —
Short-term bridge; refi at stabilization.
Listing history 20 events
-
2026-06-19days on market $164,900 Active 94 DOM
-
2026-06-18days on market $164,900 Active 93 DOM
-
2026-06-17days on market $164,900 Active 92 DOM
-
2026-06-16days on market $164,900 Active 91 DOM
-
2026-06-15days on market $164,900 Active 90 DOM
-
2026-06-14days on market $164,900 Active 88 DOM
-
2026-06-12days on market $164,900 Active 87 DOM
-
2026-06-09days on market $164,900 Active 84 DOM
-
2026-06-08days on market $164,900 Active 83 DOM
-
2026-06-07days on market $164,900 Active 82 DOM
-
2026-06-02days on market $164,900 Active 77 DOM
-
2026-06-01days on market $164,900 Active 76 DOM
-
2026-05-31days on market $164,900 Active 75 DOM
-
2026-05-30days on market $164,900 Active 74 DOM
-
2026-05-18price $164,900
-
2026-04-07price $175,000
-
2026-04-01status Active
-
2026-03-27historical Contingent
-
2026-03-17$185,000 Active
-
1987-04-01soldstatus $23,000
ⓘ Source: listings_history table (triggers on properties + properties_extension) + one-shot
backfill from property_details.listing_events for pre-trigger history.
Tax reassessment forecast KY · Resets to sale price
- Current annual tax
- $392 · $33/mo
- Projected year-2 tax
- $1,418 · $118/mo
- Expected delta
- +$1,026/yr (+$85/mo · 261.6%)
ⓘ Screening estimate from a state-policy table — verify with the county assessor before closing.
Climate risk First Street
- Flood 5/10 Major FEMA zone X · 24% chance over 30 yrs
- Wildfire 1/10 Low
- Heat 5/10 Major 7 d/yr ≥104°F today · 19 d/yr by 30 yrs out
- Wind 2/10 Low 100% chance of damaging wind over 30 yrs
- Air quality 2/10 Low 1 unhealthy d/yr today · 2 by 30 yrs out
Nearby sold comps map
Loading sold comps map…
Walkable amenities ~0.75 mi
Loading nearby amenities…
Taxation est. · year 1
- Rental income
- $20,708
- − Mortgage interest
- −$9,237
- − Property taxes
- −$392
- − Insurance
- −$824
- − Repairs & maintenance
- −$1,657
- − Management
- −$1,657
- − Depreciation
- −$4,797
- Taxable income
- $2,144
- Est. tax owed @ 24.0%
- −$515
- After-tax cash flow
- $4,251/yr
For passive investors: Depreciation is non-cash, so a rental often shows a tax loss while cash-flowing — sheltering income. Rental losses are passive: they offset passive income freely, and up to $25,000/yr can offset ordinary (W-2) income if you actively participate and your MAGI is under $100k (phasing out to $0 by $150k); unused losses carry forward. On sale, claimed depreciation is recaptured at up to 25%, and gains may owe capital-gains tax (a 1031 exchange can defer both). Figures are a year-1 estimate at your 24.0% rate — not tax advice; consult a CPA.
Schools (NCES district)
- District
- Frankfort Independent
- NCES district ID
- 2101980
- Math proficiency
- 35% ▼ -14.00%
- Reading proficiency
- 42% ▼ -14.00%
- Median HH income
- $35,212
- Composite
- 31.81/100
- National rank
- #5882
- State rank
- #45 of 165 in KY
Livability — Frankfort
- Score
- 74/100
- State rank
- #111
- US rank
- #4772
Category grades
Schools grade is shown separately in the Schools card above.
Census & demographics
- Census place
- Frankfort, KY
- County
- Franklin County · 51,893 people
- City population
- 51,893
- Metro
- Frankfort, KY
- Population (ZIP)
- 51,893
- Household income
- $65,732
- Rent vs Own
- Severe rent burden
- 1621.0
Population outlook (Franklin County) Hauer SSP2
- Today (2025)
- 52,996 people
- By 2030
- 54,049 · +2.0%
- By 2040
- 55,561 · +4.8%
- By 2050
- 56,677 · +6.9%
- By 2075
- 59,458 · +12.2%
- By 2100
- 58,885 · +11.1%
Race, ethnicity, and origin ACS 2023
- Neighborhood character
- Predominantly White (81%)
- Race & ethnicity
- White 81% Black 9% Two or more races 5% Hispanic / Latino 4% Asian 2%
- Common ancestry
- Italian 3% Slovak 2% Lithuanian 1%
- Foreign-born
- 4% · Canada
- Languages at home
- 94% English-only · Spanish 3% Other Asian/Pacific 1% Tagalog/Filipino 1%
Political lean MEDSL · Franklin
- 2024 margin
- Toss-up / Even · D 46.6% · R 51.4% · Other 2.0%
- 2008→2024 swing
- -4.2pp toward R · 2008: -0.6pp · 2024: -4.8pp
- All cycles
- 2024: R+4.8 2020: R+0.9 2016: R+4.6 2012: D+0.8 2008: R+0.6
Not yet ingested
- Civics
- —
Market trends
- HPI YoY
- ▼ -87.43%
- Current HPI
- 248.0324
- Rent YoY
- ▲ 6.55%
- Metro
- Frankfort, KY
- State GDP YoY
- ▲ 1.81%
- F500 in state
- 4
Industry mix (Fortune 500 HQ in KY)
| Industry | F500 HQs | Revenue |
|---|---|---|
| Healthcare | 1 | $118B |
|
||
| Food / Beverage | 1 | $7B |
|
||
Price history
+617.0% since first listed6 events — show timeline
- 2026-05-18 Price Changed $164,900 ImagineMLS
- 2026-04-07 Price Changed $175,000 ImagineMLS
- 2026-04-01 Relisted — ImagineMLS
- 2026-03-27 Contingent — ImagineMLS
- 2026-03-17 Listed $185,000 ImagineMLS
- 1987-04-01 Sold (Public Records) $23,000 Public Records
Property tax history
+1.8%/yrLatest (2025): $392 · -0.1% YoY. Source: county tax records.
Cash-flow waterfall
monthlySold comps — $/sqft
last 12 mo · ≤1 miLoading sold comps…