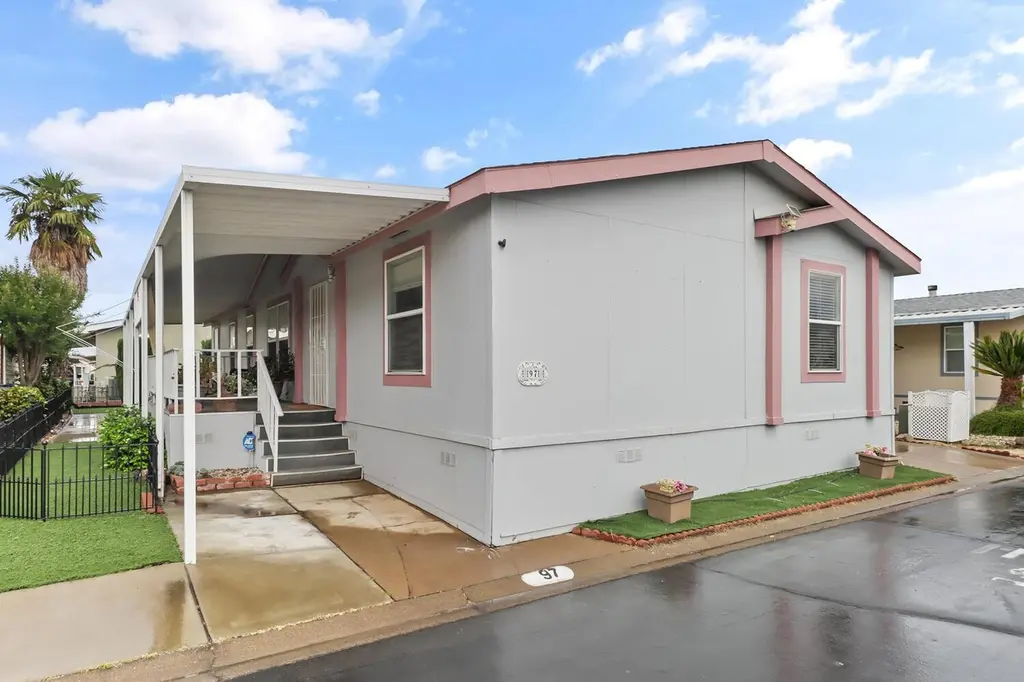
97 Cantabrook St · Florin, CA
Flood risk 3/10 · Minor
- FEMA flood zone
- X (unshaded)
- Chance of flooding over 30 yrs
- 0.18%
- Est. flood insurance / yr
- $507 – $1,088
Fire risk 5/10 · Moderate
- Est. fire insurance / yr
- $659 – $1,223
Heat risk 7/10 · Major
- Hot days now (above 102°F)
- 6 days/yr
- Hot days in 30 yrs
- 13 days/yr
Wind risk 1/10 · Minimal
- Chance of severe wind over 30 yrs
- —
Air-quality risk 10/10 · Severe
- Unhealthy air days now
- 28 days/yr
- Unhealthy air days in 30 yrs
- 33 days/yr
Risk factors via First Street. Map © Google.
Why this score? — see what drove the D+ grade
The composite is a weighted blend of 9 inputs, each scored 0–100. Each bar is that input's sub-score; the figure is the points it added to the 100-point composite (weight × sub-score).
- Cash flow +19.2/30.0
- 1% rule +6.8/10.0
- DSCR +6.1/10.0
- Schools +4.1/10.0
- Condition / age +3.8/5.0
- Livability +2.9/5.0
- Rent growth +2.4/5.0
- Appreciation +1.3/10.0
- ARV discount +0.1/15.0
$219,900
🖨 Deal sheet (PDF) 📄 Offer letter ✓ Due diligence
Listing remarks
Big, bright and sparkling home shows the pride of ownership! This inviting home offers an open and spacious floor plan built in 2000, with 1560 square feet, featuring 3 bedrooms PLUS a den/home office and 2 bathrooms. Located in the desirable Cedarwood Resident Owned Park with NO space rental, for residents 55 years and older. The great room showcases vaulted ceilings and ceiling fans, seamlessly connecting to the kitchen with a dining bar and adjoining living and dining areasperfect for comfortable everyday living and entertaining. The kitchen has an abundance of counter and cabinet space including a large pantry cabinet. Updated luxury vinyl plank flooring (2023) flows throughout the livi
Key facts
- Relaxing soaking tub
- Large pantry cabinet
- Walk-in closet
Tags
Property features AI
Finance
- Other: Property is on a land lease
- HOA & community: Mandatory association with monthly fee of $300; Association covers trash, water and other items; Community amenities include pool, clubhouse, RV storage, game room, guest parking; park has interview and pet restrictions
Exterior
- Parking: Attached covered parking; Guest parking available
- Utilities: Individual electric meter; Individual gas meter; 220V outlet in laundry; Underground utilities; Public sewer; Public water (water district); Internet available
- Home design: Manufactured in park (double wide); Built in 2000; Senior community
- Construction: Fleetwood Suncrest manufactured home; Composition roof
- Exterior features: Storage area; Shed(s); Regular shaped lot with landscaped front and back
Interior
- Kitchen: Pantry cabinet; Laminate counters; Free standing gas range / oven; Free standing refrigerator; Hood over range; Dishwasher; Disposal
- Bedrooms: 3 bedrooms (including a master bedroom)
- Flooring: Carpet
- Bathrooms: 2 full bathrooms; Tub with shower over
- Heating & cooling: Central heating; Central air conditioning; Ceiling fans
- Interior features: Cathedral ceiling; Dual pane full windows with coverings and screens; Covered and uncovered patio; porch with porch steps; Storage area inside and additional shed(s)
- Laundry & utility: Washer space with dryer included; Laundry located inside (utility room); Gas water heater
Neighborhood map
What this means for you Summary
Snapshot
- This is a 3-bed/2.0-bath manufactured listed at $220k. Condition is rated good.
Deal economics
- At list price, monthly cash flow is $238 ($3k/yr) — positive.
- The deal already cash-flows at list — no discount required.
- Meets the 1% rule at list price ($3k rent vs $220k).
- Recommended offer: $213k (3.0% below list) — sets the bar for market timing.
- Cap rate 7.6% vs local median 3.6% in Florin — top-decile yield for the area; either an underpriced asset or a hidden risk that comps aren't pricing in. Stress-test before assuming the spread holds.
Location & tenants
- Location reads 58/100 on livability (#673 in CA) — a working-class tenant base; expect higher turnover. Strengths: housing A; Watch: employment D, crime F, amenities F.
- Elk Grove Unified (suburban): math 40% / reading 51% proficiency, ranked #165 of 517 in CA (top 32%) — families likely to look elsewhere, expect single-tenant / working-renter base with shorter leases.
- Zoned schools: Florin Elementary (math 13% / reading 21%, grade F, #1,340 of 1,571 statewide, top 88%, 494 students, 64% FRL); James Rutter Middle (math 17% / reading 32%, grade F, #277 of 498 statewide, top 73%, 847 students, 65% FRL); Florin High (math 27% / reading 46%, grade F, #602 of 1,170 statewide, top 52%, 1,676 students, 60% FRL) — zoned schools average 63% FRL vs 43% district-wide (20 pts higher); higher-poverty schools than district average — tighter screening recommended.
- Zoned-school proficiency averages 26% at this address vs 46% district-wide (-20 pts) — the specific schools serving this property underperform the Elk Grove Unified average; the district grade overstates school quality for this exact location.
- Market conditions: Rents soft (-0.2%/yr); 215 active listings in the ZIP; 8 comparable units currently listed for rent nearby; rentals at typical pace (median 17d on market — plan ~3-4 weeks tenant-placement turnaround); solid renter incomes; 6,825 units permitted in Sacramento County in 2024 (1,752 in 5+ unit buildings).
- This rent runs 38% of the median local income ($82k/yr) — at the standard rent-burdened threshold; future hikes will face affordability resistance.
Forward outlook
- Local home prices are declining (-3.0%/yr); year-one equity from $2k of loan paydown is wiped out by about $7k of value loss. Plan a longer hold.
- Sacramento County population projected at +17% by 2050 — long-run rental-demand tailwind backs the buy-and-hold thesis.
Negotiation context
- It's been on market 33 days — a 3% lower offer ($213k) is reasonable based on typical stale-listing flexibility.
Risks & watch-outs
- Climate carrying-cost: moderate wildfire risk; extreme-heat days projected 6→13/yr by 2055 (HVAC capex compounding) — expect insurance premiums to compound above CPI over the hold.
Questions for the listing agent
- It's been on market 33 days. Have you received any prior offers? Is the seller open to a 3% concession, seller financing, or rate buy-down credit?
- What does the HOA fee cover, when was the last increase, and are there any pending special assessments or reserve-fund shortfalls?
- Is there a deadline driving the sale (1031 exchange, divorce, estate, relocation)? That informs how much negotiation room exists.
- Schools are D-rated, which usually means shorter tenancies and higher turnover. Who's the typical renter profile here, and what's been the actual vacancy rate?
- Crime grade is F in this area — have there been break-ins, vandalism, or insurance claims at this property in the last 3 years? What carrier currently insures it and at what premium?
- The area grade is low — what's the realistic commute time and amenity access for the typical tenant pool here? Any planned neighborhood developments (good or bad) we should know about?
- What's the average days-on-market for RENTAL listings here right now (not sales)? A rising rental-DOM trend means longer vacancies and softer asking-rent achievability than the comps imply.
- What's the recent tenant-quality profile in this submarket — average credit score on applications, eviction rate, late-payment / NSF rate, and stable-employment percentage? A property-management company in the area should have these aggregated.
- How much new for-sale + rental construction is in the pipeline within 1–3 miles? Heavy new supply typically softens prices + rents 12–24 months out; constrained supply supports both.
Investment metrics
- 1% rule
- 1.18% ✓
- Cap rate
- 7.59%
- Cash-on-cash
- 4.63%
- DSCR
- 1.21
- GRM
- 7.0
CMA / ARV
- ARV (on-the-fly)
- $188,760
- Comps found
- 12
Show comp detail 12 sales within ~0.75 mi
| Address | Dist | Beds/Ba | Sqft | Sold | Price | $/sf | Match |
|---|---|---|---|---|---|---|---|
| 97 Cantabrook St | 0.00mi | 3/2.0 | 1,560 (0%) | 1mo | $220,000 | $141 | 100 |
| 134 Gardenia | 0.27mi | 3/2.0 | 1,440 (-8%) | 1mo | $120,000 | $83 | 74 |
| 7430 Bouvais Cir | 0.31mi | 2/2.0 (-1) | 1,536 (-2%) | 6mo | $225,000 | $146 | 73 |
| 1 Millbrook Cir | 0.16mi | 2/2.0 (-1) | 1,728 (+11%) | 1mo | $145,000 | $84 | 69 |
| 140 Hibiscus | 0.28mi | 2/2.0 (-1) | 1,680 (+8%) | 1mo | $69,500 | $41 | 68 |
| 103 Dahlia Ave | 0.33mi | 3/2.0 | 1,400 (-10%) | 1mo | $89,000 | $64 | 67 |
| 66 Millbrook Cir | 0.09mi | 2/2.0 (-1) | 1,344 (-14%) | 2mo | $205,000 | $153 | 66 |
| 115 Gardenia | 0.28mi | 2/2.0 (-1) | 1,440 (-8%) | 5mo | $105,000 | $73 | 64 |
| 7406 Pardis Ln | 0.28mi | 2/2.0 (-1) | 1,400 (-10%) | 2mo | $170,000 | $121 | 64 |
| 7406 Pardis Ln | 0.28mi | 2/2.0 (-1) | 1,400 (-10%) | 2mo | $170,000 | $121 | 64 |
| 8676 Beauxart Cir | 0.33mi | 2/2.0 (-1) | 1,440 (-8%) | 5mo | $322,000 | $224 | 62 |
| 12 Pina St | 0.39mi | 2/2.0 (-1) | 1,344 (-14%) | 2mo | $75,000 | $56 | 52 |
Match score weights: distance 35% · size 25% · config 20% · recency 20%. Top-matched comps best support the ARV.
Projected returns pro-forma
-3.0% appreciation · 0.0% rent growth · sell at horizon
- IRR
- -13.0%
- Equity multiple
- 0.55×
- Total profit
- $-27,905
- Equity at exit
- $32,788
- IRR
- -10.6%
- Equity multiple
- 0.46×
- Total profit
- $-33,394
- Equity at exit
- $19,013
Cash invested: $61,572 (down + closing). Projections, not guarantees.
Landlord ↔ Tenant lean methodology
- Overall (STATE)
- 18 Strongly Tenant-Friendly
- State California
- 18 Strongly Tenant-Friendly · D+13
- County
- — inherits STATE
- City
- — inherits STATE
ZIP-level market 95828
- Home prices YoY
- -0.8%
- Rents YoY
- -0.2%
- Active inventory
- 215
- Price-to-rent
- 7.0×
Monthly cashflow live
- Estimated rent
- $2,604 high interval (Pro) →
- Mortgage (P&I)
- −$1,153
- Tax est. 1.5%
- −$275 /mo · $3,298/yr
- Insurance
- −$92
- HOA
- −$300
- Vacancy / Maint / Mgmt
- −$547
- Net cashflow
- $238
Break-even live
Sensitivity live
| Price | -10% $390 | -5% $314 | +0% $238 | +5% $162 | +10% $86 |
|---|---|---|---|---|---|
| Rent | -10% $32 | -5% $135 | +0% $238 | +5% $341 | +10% $443 |
| Rate | -1.0pp $348 | -0.5pp $294 | base $238 | +0.5pp $181 | +1.0pp $123 |
UW: 25.0% down · 7.5% · 30yr · 1.5% tax · 5.0% vac · 8.0% maint · 8.0% mgmt
Financing live
Cash to close
- Down payment
- $54,975
- Closing costs
- $6,597
- Reserves months
- —
- Total cash needed
- —
Loan-product check · same deal, 3 products live
Conventional
25% down · 7.5% · 30yr
- Down + closing
- —
- Monthly P&I
- —
- Monthly cashflow
- —
- DSCR
- —
- Eligible?
- —
Personal DTI + credit; lowest rate.
DSCR
20% down · 8.5% · 30yr
- Down + closing
- —
- Monthly P&I
- —
- Monthly cashflow
- —
- DSCR
- —
- Eligible?
- —
No personal income docs; deal must DSCR.
Hard money
10% down · 12.0% · 12mo
- Down + closing
- —
- Monthly P&I
- —
- Monthly cashflow
- —
- DSCR
- —
- Eligible?
- —
Short-term bridge; refi at stabilization.
Rent comps 8 comps
| Address | Beds | Baths | Sqft | Rent | $/sqft | DOM | Units | Dist |
|---|---|---|---|---|---|---|---|---|
| 8604 Maple Grove Ct Sacramento, CA | 2.0 | 2.0 | 1557 | $2,195 | $1.41 | 26d | 1 | 0.36mi |
| 8604 Maple Grove Ct Sacramento, CA | 2.0 | 2.0 | 1557 | $2,195 | $1.41 | 10d | 1 | 0.36mi |
| 7756 Southbreeze Dr Sacramento, CA | 3.0 | 2.0 | 1302 | $2,395 | $1.84 | 4d | 1 | 0.55mi |
| 8620 Tiogawoods Dr Sacramento, CA | 3.0 | 2.0 | 1137 | $2,750 | $2.42 | 10d | 1 | 0.67mi |
| 8807 Spencerport Dr Unit 1 bedroom Sacramento, CA | 4.0 | 2.5 | 1935 | $900 | $0.47 | 46d | 1 | 0.74mi |
| 8019 Pinot Noir Way Sacramento, CA | 4.0 | 2.5 | 2001 | $3,100 | $1.55 | 20d | 1 | 1.43mi |
| 7514 Clear Lake Aly Sacramento, CA | 4.0 | 3.0 | 2185 | $2,900 | $1.33 | 6d | 1 | 1.47mi |
| 7514 Clear Lake Aly Sacramento, CA | 4.0 | 3.0 | 2185 | $2,900 | $1.33 | 17d | 1 | 1.47mi |
HOA detail
- Monthly dues
- $300 · $3,600/yr
Climate risk First Street
- Flood 3/10 Moderate FEMA zone X (unshaded) · 18% chance over 30 yrs
- Wildfire 5/10 Major
- Heat 7/10 Severe 6 d/yr ≥102°F today · 13 d/yr by 30 yrs out
- Wind 1/10 Low
- Air quality 10/10 Extreme 28 unhealthy d/yr today · 33 by 30 yrs out
Nearby sold comps map
Loading sold comps map…
Walkable amenities ~0.75 mi
Loading nearby amenities…
Taxation est. · year 1
- Rental income
- $31,251
- − Mortgage interest
- −$12,318
- − Property taxes
- −$3,298
- − Insurance
- −$1,100
- − Repairs & maintenance
- −$2,500
- − Management
- −$2,500
- − HOA
- −$3,600
- − Depreciation
- −$6,397
- Taxable loss
- −$462
- Est. tax savings @ 24.0%
- +$111
- After-tax cash flow
- $2,963/yr
For passive investors: Depreciation is non-cash, so a rental often shows a tax loss while cash-flowing — sheltering income. Rental losses are passive: they offset passive income freely, and up to $25,000/yr can offset ordinary (W-2) income if you actively participate and your MAGI is under $100k (phasing out to $0 by $150k); unused losses carry forward. On sale, claimed depreciation is recaptured at up to 25%, and gains may owe capital-gains tax (a 1031 exchange can defer both). Figures are a year-1 estimate at your 24.0% rate — not tax advice; consult a CPA.
Condition & rehab AI · 12 photos
This move-in-ready manufactured home offers a good condition with updated flooring and a desirable location in a resident-owned park.
Value-add opportunities
- Both Paint exterior — Enhances curb appeal and value
- Both Replace gutters — Improves drainage and aesthetics
Renovation cost estimate screening
Value-add ROI direction
- Both Paint exterior — Enhances curb appeal and value ↑
- Both Replace gutters — Improves drainage and aesthetics ↑
ⓘ Cost ranges are severity-bucket heuristics (US national rule-of-thumb). Get contractor quotes + a written scope before underwriting a rehab budget.
Schools (NCES district)
- District
- Elk Grove Unified
- NCES district ID
- 0612330
- Math proficiency
- 40% ▼ -5.00%
- Reading proficiency
- 51% ▼ -5.00%
- Median HH income
- $67,860
- Composite
- 40.72/100
- National rank
- #3658
- State rank
- #165 of 517 in CA
Livability — Florin
- Score
- 58/100
- State rank
- #673
- US rank
- #20705
Category grades
Schools grade is shown separately in the Schools card above.
Census & demographics
- Census place
- Florin, CA
- County
- Sacramento County · 1,539,646 people
- City population
- 60,532
- Metro
- Sacramento-Roseville-Folsom, CA
- Population (ZIP)
- 61,686
- Household income
- $81,778
- Rent vs Own
- Severe rent burden
- 1765.0
Population outlook (Sacramento County) Hauer SSP2
- Today (2025)
- 1,660,763 people
- By 2030
- 1,732,990 · +4.3%
- By 2040
- 1,855,755 · +11.7%
- By 2050
- 1,941,335 · +16.9%
- By 2075
- 2,046,162 · +23.2%
- By 2100
- 1,961,444 · +18.1%
Race, ethnicity, and origin ACS 2023
- Neighborhood character
- Highly diverse neighborhood (Simpson 0.75)
- Race & ethnicity
- Asian 37% Hispanic / Latino 26% White 16% Two or more races 12% Black 10% Pacific Islander 4%
- Hispanic origin (detail)
- Mexican 22%
- Common ancestry
- Italian 1% Russian 1% Portuguese 1%
- Foreign-born
- 35% · Vietnam, Canada, China
- Languages at home
- 47% English-only · Spanish 17% Other Asian/Pacific 13% Vietnamese 8%
Political lean MEDSL · Sacramento
- 2024 margin
- D (+19.7) · D 58.1% · R 38.4% · Other 3.5%
- 2008→2024 swing
- +0.7pp no change · 2008: 19.0pp · 2024: 19.7pp
- All cycles
- 2024: D+19.7 2020: D+25.3 2016: D+23.7 2012: D+16.3 2008: D+19.0
Not yet ingested
- Civics
- —
Market trends
- HPI YoY
- ▼ -7.49%
- Current HPI
- 962.47
- Rent YoY
- ▼ -0.24%
- Metro
- Sacramento-Roseville-Folsom, CA
- State GDP YoY
- ▲ 3.21%
- F500 in state
- 116
Industry mix (Fortune 500 HQ in CA)
| Industry | F500 HQs | Revenue |
|---|---|---|
| Technology | 27 | $1,492B |
|
||
| Financial Services | 3 | $174B |
|
||
| Retail | 3 | $44B |
|
||
| Insurance | 3 | $26B |
|
||
| Media / Entertainment | 2 | $115B |
|
||
| Pharmaceuticals / Biotech | 2 | $62B |
|
||
Cash-flow waterfall
monthlySold comps — $/sqft
last 12 mo · ≤1 miLoading sold comps…