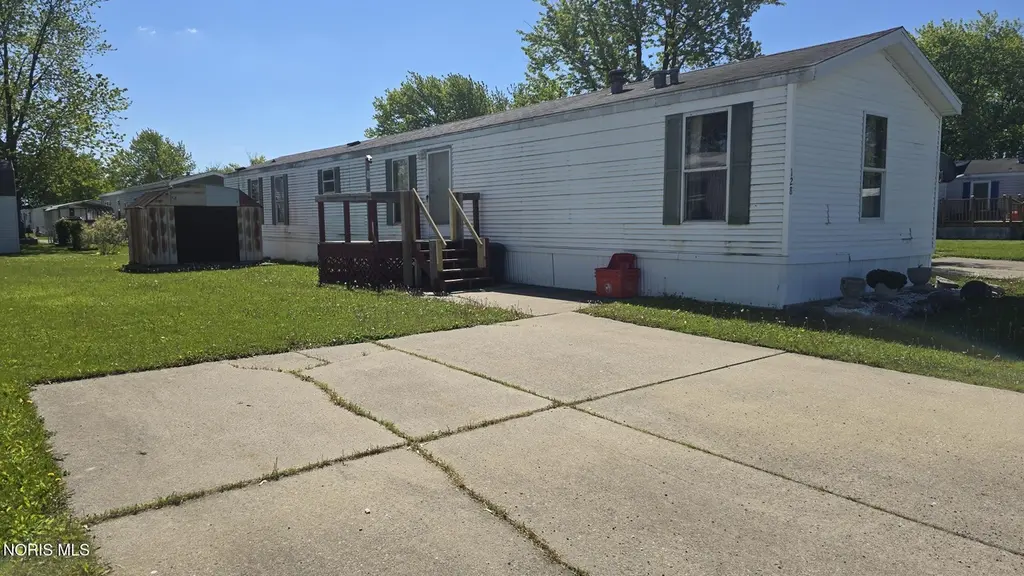
128 Bradford Ave · Napoleon, OH
Flood risk 1/10 · Minimal
- FEMA flood zone
- X
- Chance of flooding over 30 yrs
- 0.0%
- Est. flood insurance / yr
- $507 – $1,088
Fire risk 1/10 · Minimal
- Est. fire insurance / yr
- $713 – $1,323
Heat risk 3/10 · Minor
- Hot days now (above 99°F)
- 7 days/yr
- Hot days in 30 yrs
- 17 days/yr
Wind risk 2/10 · Minimal
- Chance of severe wind over 30 yrs
- —
Air-quality risk 2/10 · Minimal
- Unhealthy air days now
- 1 days/yr
- Unhealthy air days in 30 yrs
- 2 days/yr
Risk factors via First Street. Map © Google.
Why this score? — see what drove the D+ grade
The composite is a weighted blend of 9 inputs, each scored 0–100. Each bar is that input's sub-score; the figure is the points it added to the 100-point composite (weight × sub-score).
- Cash flow +15.0/30.0
- ARV discount +7.5/15.0
- Schools +5.6/10.0
- 1% rule +5.0/10.0
- DSCR +5.0/10.0
- Livability +3.5/5.0
- Rent growth +2.5/5.0
- Condition / age +2.5/5.0
- Appreciation +0.0/10.0
$10,000
🖨 Deal sheet 📄 Offer letter ✓ Due diligence
Listing remarks
MOTIVATED SELLER!! Three-bedroom, 2 full bath mobile home with 8x8 shed and concrete parking area. Must be park approved for purchase. Bring a toolbelt and a vision!
Key facts
- 8x8 shed
- 2 parking spots
- Built 1999
Tags
Property features AI
Finance
- Other: Located in Henry County, Napoleon township; Address: 128 Bradford Avenue, Napoleon, OH 43545
- HOA & community: Association fee $315 monthly; Located in Glenwood Estates park
Exterior
- Parking: Off-street parking; Concrete parking; Additional on-street parking available; Total parking for 2 vehicles
- Utilities: Cable available; Electricity connected (100 amp service, circuit breakers); Natural gas connected; Public water; Public sewer
- Home design: Residential single-wide mobile home; One level / single story; Four Seasons S16 model (76' x 15'); Aluminum skirting
- Construction: Vinyl siding; Shingle roof; Other foundation type; Year built per public records
- Exterior features: Side porch; Shed(s)
Interior
- Kitchen: Eat-in kitchen; Water heater (appliance listed)
- Bedrooms: Bedroom 2 on main level; Bedroom 3 on main level
- Flooring: Carpet; Linoleum
- Bathrooms: 2 full bathrooms
- Heating & cooling: Forced air heating
- Interior features: Eat-in kitchen; Wood-burning fireplace; 6 total rooms
- Laundry & utility: Main-level laundry room
Neighborhood map
What this means for you Summary
Snapshot
- This is a 3-bed/2.0-bath manufactured listed at $10k.
Deal economics
- At list price, monthly cash flow is $378 ($5k/yr) — positive.
- The deal already cash-flows at list — no discount required.
- Meets the 1% rule at list price ($965 rent vs $10k).
- Recommended offer: $10k (3.0% below list) — sets the bar for market timing.
- Cap rate 51.7% vs local median 3.8% in Napoleon — top-decile yield for the area; either an underpriced asset or a hidden risk that comps aren't pricing in. Stress-test before assuming the spread holds.
Location & tenants
- Location reads 70/100 on livability (#484 in OH) — a middle-class / working-renter tenant base. Strengths: cost of living A+, housing A+; Watch: employment D+, amenities F, commute F.
- Napoleon Area City (town): math 62% / reading 69% proficiency, ranked #208 of 656 in OH (top 32%) — acceptable for families but not a draw, mixed tenant base, ~2y average lease.
- Zoned schools: Napoleon Elementary School (math 75% / reading 74%, grade A, #272 of 1,584 statewide, top 19%, 975 students, 37% FRL); Napoleon Junior/Senior High School (math 49% / reading 64%, grade C, #291 of 781 statewide, top 37%, 787 students, 30% FRL).
- Market conditions: 49 active listings in the ZIP; 1 comparable units currently listed for rent nearby; solid renter incomes; 18 units permitted in Henry County in 2024 (0 in 5+ unit buildings).
- This rent is only 15% of the median local income ($78k/yr) — well below the 30% rent-burden line; pricing power to push rent on renewal without tenant pushback.
Forward outlook
- Local home prices are declining (-3.0%/yr); year-one equity from $69 of loan paydown is wiped out by about $300 of value loss. Plan a longer hold.
- Henry County population projected at -14% by 2050 — secular population decline; favor cash flow + early exit over multi-decade hold.
- At projected returns (-3.0% appreciation + 3.0% rent growth), your $3k cash investment doubles in ~1 year — after that, you're playing with house money.
Negotiation context
- It's been on market 34 days — a 3% lower offer ($10k) is reasonable based on typical stale-listing flexibility.
Risks & watch-outs
- Watch-outs: HOA is 33% of rent.
Questions for the listing agent
- It's been on market 34 days. Have you received any prior offers? Is the seller open to a 3% concession, seller financing, or rate buy-down credit?
- What does the HOA fee cover, when was the last increase, and are there any pending special assessments or reserve-fund shortfalls?
- Is there a deadline driving the sale (1031 exchange, divorce, estate, relocation)? That informs how much negotiation room exists.
- Schools are B-rated — typically a magnet for longer-tenancy family renters. What's the average tenant stay here, and is there a school-zone premium baked into asking?
- The area grade is low — what's the realistic commute time and amenity access for the typical tenant pool here? Any planned neighborhood developments (good or bad) we should know about?
- What's the average days-on-market for RENTAL listings here right now (not sales)? A rising rental-DOM trend means longer vacancies and softer asking-rent achievability than the comps imply.
- What's the recent tenant-quality profile in this submarket — average credit score on applications, eviction rate, late-payment / NSF rate, and stable-employment percentage? A property-management company in the area should have these aggregated.
- How much new for-sale + rental construction is in the pipeline within 1–3 miles? Heavy new supply typically softens prices + rents 12–24 months out; constrained supply supports both.
Investment metrics
- 1% rule
- 9.65% ✓
- Cap rate
- 51.68%
- Cash-on-cash
- 162.10%
- DSCR
- 8.21
- GRM
- 0.9
CMA / ARV
- ARV (median comp)
- $28,917
- List price
- $10,000
- Delta
- -65.42%
- Verdict
- UNDERPRICED
- Comps
- 2 within 2.0 mi
Projected returns pro-forma
-3.0% appreciation · 3.0% rent growth · sell at horizon
- IRR
- —
- Equity multiple
- 9.10×
- Total profit
- $22,678
- Equity at exit
- $1,491
- IRR
- —
- Equity multiple
- 19.43×
- Total profit
- $51,614
- Equity at exit
- $865
Cash invested: $2,800 (down + closing). Projections, not guarantees.
Landlord ↔ Tenant lean methodology
- Overall (STATE)
- 73 Landlord-Friendly
- State Ohio
- 73 Landlord-Friendly · R+6
- County
- — inherits STATE
- City
- — inherits STATE
ZIP-level market 43545
- Home prices YoY
- -19.6%
- Active inventory
- 49
- Price-to-rent
- 0.9×
Monthly cashflow live
- Estimated rent
- $965 medium interval (Pro) →
- Mortgage (P&I)
- −$52
- Tax est. 1.5%
- −$12 /mo · $150/yr
- Insurance
- −$4
- HOA
- −$315
- Vacancy / Maint / Mgmt
- −$203
- Net cashflow
- $378
Break-even live
UW: 25.0% down · 7.5% · 30yr · 1.5% tax · 5.0% vac · 8.0% maint · 8.0% mgmt
Financing live
Cash to close
- Down payment
- $2,500
- Closing costs
- $300
- Reserves months
- —
- Total cash needed
- —
Loan-product check · same deal, 3 products live
Conventional
25% down · 7.5% · 30yr
- Down + closing
- —
- Monthly P&I
- —
- Monthly cashflow
- —
- DSCR
- —
- Eligible?
- —
Personal DTI + credit; lowest rate.
DSCR
20% down · 8.5% · 30yr
- Down + closing
- —
- Monthly P&I
- —
- Monthly cashflow
- —
- DSCR
- —
- Eligible?
- —
No personal income docs; deal must DSCR.
Hard money
10% down · 12.0% · 12mo
- Down + closing
- —
- Monthly P&I
- —
- Monthly cashflow
- —
- DSCR
- —
- Eligible?
- —
Short-term bridge; refi at stabilization.
Rent comps 1 comps
| Address | Beds | Baths | Sqft | Rent | $/sqft | DOM | Units | Dist |
|---|---|---|---|---|---|---|---|---|
| 780 Sheffield Ave Napoleon, OH | 2.0 | 1.0 | 700 | $965 | $1.38 | 43d | 1 | 1.03mi |
HOA detail
- Monthly dues
- $315 · $3,780/yr
Listing history 15 events
-
2026-06-18days on market $10,000 Active 34 DOM
-
2026-06-17days on market $10,000 Active 33 DOM
-
2026-06-16days on market $10,000 Active 32 DOM
-
2026-06-15days on market $10,000 Active 31 DOM
-
2026-06-13days on market $10,000 Active 29 DOM
-
2026-06-12days on market $10,000 Active 28 DOM
-
2026-06-09days on market $10,000 Active 25 DOM
-
2026-06-08days on market $10,000 Active 24 DOM
-
2026-06-08days on market $10,000 Active 23 DOM
-
2026-06-07days on market $10,000 Active 22 DOM
-
2026-06-04days on market $10,000 Active 19 DOM
-
2026-06-02days on market $10,000 Active 18 DOM
-
2026-06-01days on market $10,000 Active 17 DOM
-
2026-05-31days on market $10,000 Active 16 DOM
-
2026-05-14$10,000 Active 165-char remark
ⓘ Source: listings_history table (triggers on properties + properties_extension) + one-shot
backfill from property_details.listing_events for pre-trigger history.
Climate risk First Street
- Flood 1/10 Low FEMA zone X · 0% chance over 30 yrs
- Wildfire 1/10 Low
- Heat 3/10 Moderate 7 d/yr ≥99°F today · 17 d/yr by 30 yrs out
- Wind 2/10 Low
- Air quality 2/10 Low 1 unhealthy d/yr today · 2 by 30 yrs out
Nearby sold comps map
Loading sold comps map…
Walkable amenities ~0.75 mi
Loading nearby amenities…
Taxation est. · year 1
- Rental income
- $11,580
- − Mortgage interest
- −$560
- − Property taxes
- −$150
- − Insurance
- −$50
- − Repairs & maintenance
- −$926
- − Management
- −$926
- − HOA
- −$3,780
- − Depreciation
- −$291
- Taxable income
- $4,896
- Est. tax owed @ 24.0%
- −$1,175
- After-tax cash flow
- $3,364/yr
For passive investors: Depreciation is non-cash, so a rental often shows a tax loss while cash-flowing — sheltering income. Rental losses are passive: they offset passive income freely, and up to $25,000/yr can offset ordinary (W-2) income if you actively participate and your MAGI is under $100k (phasing out to $0 by $150k); unused losses carry forward. On sale, claimed depreciation is recaptured at up to 25%, and gains may owe capital-gains tax (a 1031 exchange can defer both). Figures are a year-1 estimate at your 24.0% rate — not tax advice; consult a CPA.
Schools (NCES district)
- District
- Napoleon Area City
- NCES district ID
- 3904443
- Math proficiency
- 62% ▼ -14.00%
- Reading proficiency
- 69% ▼ -4.00%
- Median HH income
- $49,144
- Composite
- 55.53/100
- National rank
- #1243
- State rank
- #208 of 656 in OH
Livability — Napoleon
- Score
- 70/100
- State rank
- #484
- US rank
- #8082
Category grades
Schools grade is shown separately in the Schools card above.
Census & demographics
- Census place
- Napoleon, OH
- County
- Henry · 27,211 people
- City population
- 14,388
- Population (ZIP)
- 14,388
- Household income
- $78,165
- Rent vs Own
- Severe rent burden
- 4.0
Population outlook (Henry County) Hauer SSP2
- Today (2025)
- 27,204 people
- By 2030
- 26,657 · -2.0%
- By 2040
- 25,149 · -7.6%
- By 2050
- 23,361 · -14.1%
- By 2075
- 20,409 · -25.0%
- By 2100
- 18,199 · -33.1%
Race, ethnicity, and origin ACS 2023
- Neighborhood character
- Predominantly White (88%)
- Race & ethnicity
- White 88% Hispanic / Latino 6% Two or more races 4%
- Hispanic origin (detail)
- Mexican 4%
- Common ancestry
- Lithuanian 3% Slovak 2% Romanian 1%
- Foreign-born
- 2% · Canada
- Languages at home
- 95% English-only · Spanish 3% German/W. Germanic 1% Other Indo-European 1%
Political lean MEDSL · Henry
- 2024 margin
- Solid R (+46.7) · D 26.2% · R 72.9%
- 2008→2024 swing
- -33.8pp toward R · 2008: -12.9pp · 2024: -46.7pp
- All cycles
- 2024: R+46.7 2020: R+43.5 2016: R+39.8 2012: R+18.6 2008: R+12.9
Not yet ingested
- Civics
- —
Market trends
- HPI YoY
- ▼ -51.90%
- Current HPI
- 212.3599
- Rent YoY
- —
- Metro
- —
- State GDP YoY
- ▲ 1.98%
- F500 in state
- 48
Industry mix (Fortune 500 HQ in OH)
| Industry | F500 HQs | Revenue |
|---|---|---|
| Insurance | 3 | $145B |
|
||
| Industrial Machinery | 3 | $49B |
|
||
| Financial Services | 3 | $24B |
|
||
| Consumer Goods | 2 | $93B |
|
||
| Aerospace / Defense | 2 | $47B |
|
||
| Utilities | 2 | $33B |
|
||
Price history
1 event — show timeline
- 2026-05-14 Listed $10,000 NORIS
Cash-flow waterfall
monthlySold comps — $/sqft
last 12 mo · ≤1 miLoading sold comps…