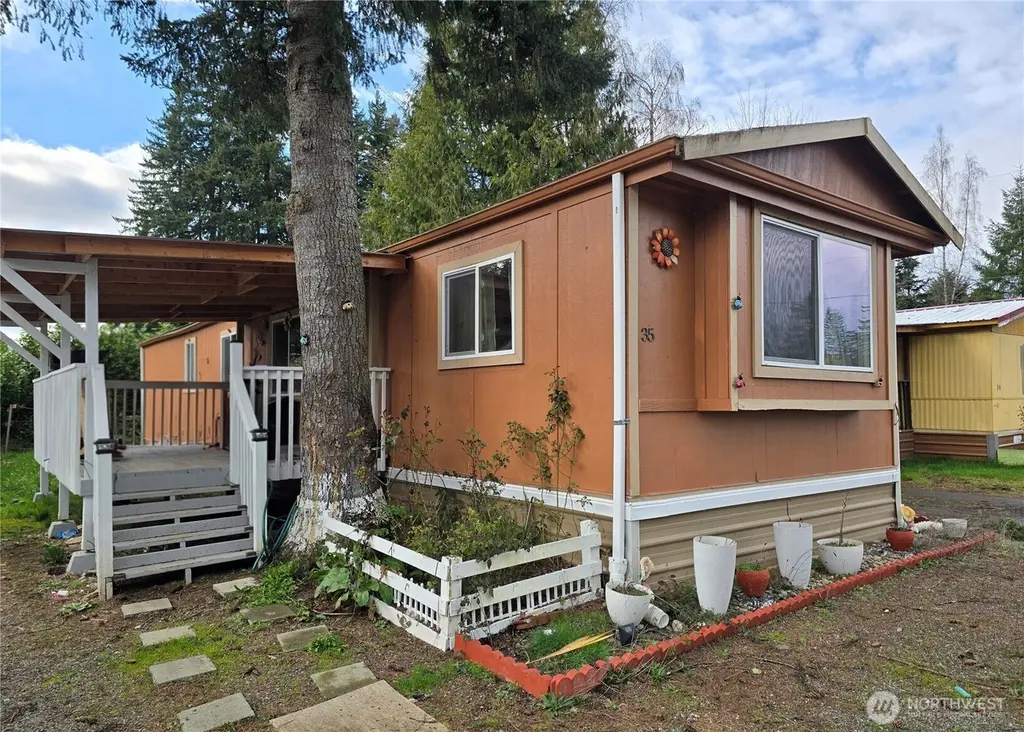
38 Hurd Rd #35 · Satsop, WA
Flood risk 1/10 · Minimal
- FEMA flood zone
- X (unshaded)
- Chance of flooding over 30 yrs
- 0.0%
- Est. flood insurance / yr
- $507 – $1,088
Fire risk 2/10 · Minimal
- Est. fire insurance / yr
- $604 – $1,122
Heat risk 2/10 · Minimal
- Hot days now (above 89°F)
- 7 days/yr
- Hot days in 30 yrs
- 15 days/yr
Wind risk 1/10 · Minimal
- Chance of severe wind over 30 yrs
- —
Air-quality risk 6/10 · Moderate
- Unhealthy air days now
- 8 days/yr
- Unhealthy air days in 30 yrs
- 8 days/yr
Risk factors via First Street. Map © Google.
Why this score? — see what drove the C+ grade
The composite is a weighted blend of 9 inputs, each scored 0–100. Each bar is that input's sub-score; the figure is the points it added to the 100-point composite (weight × sub-score).
- Cash flow +30.0/30.0
- 1% rule +10.0/10.0
- DSCR +10.0/10.0
- Schools +4.5/10.0
- Condition / age +3.8/5.0
- Livability +3.1/5.0
- Rent growth +2.5/5.0
- ARV discount +0.0/15.0
- Appreciation +0.0/10.0
$45,000
🖨 Deal sheet 📄 Offer letter ✓ Due diligence
Listing remarks
Discover comfortable and affordable living in this updated 2-bedroom, 1 full bath manufactured home located in Hunters Prairie Park. This inviting home features modern updates throughout, creating a move-in-ready space. Enjoy outdoor living with a large deck—perfect for relaxing or entertaining—along with a small, easy-to-maintain yard. A convenient carport provides covered parking and added storage options. With no age restrictions and a location just minutes from the greens at Oaksridge Golf Course, this home offers a great blend of comfort, convenience, and recreation in the heart of Elma. Seller is offering Owner Financing.
Key facts
- Large deck
- Small yard
- Convenient carport
Tags
Neighborhood map
What this means for you Summary
Snapshot
- This is a 2-bed/1.0-bath single-family listed at $45k. Condition is rated good.
Deal economics
- At list price, monthly cash flow is $1k ($12k/yr) — positive.
- The deal already cash-flows at list — no discount required.
- Meets the 1% rule at list price ($2k rent vs $45k).
- Recommended offer: $41k (9.0% below list) — sets the bar for market timing.
Location & tenants
- Location reads 62/100 on livability (#423 in WA) — a middle-class / working-renter tenant base. Strengths: housing A+, employment B; Watch: crime C-, cost of living C-, health & safety C-.
- Elma School District (town): math 45% / reading 56% proficiency, ranked #146 of 291 in WA (top 50%) — acceptable for families but not a draw, mixed tenant base, ~2y average lease.
- Market conditions: 103 active listings in the ZIP; 3 comparable units currently listed for rent nearby; rentals leasing fast (median 14d on market — plan ~1-2 weeks tenant-placement turnaround); 297 units permitted in Grays Harbor County in 2024 (17 in 5+ unit buildings).
Forward outlook
- Local home prices are declining (-3.0%/yr); year-one equity from $311 of loan paydown is wiped out by about $1k of value loss. Plan a longer hold.
- Grays Harbor County population projected at -24% by 2050 — secular population decline; favor cash flow + early exit over multi-decade hold.
- At projected returns (-3.0% appreciation + 3.0% rent growth), your $13k cash investment doubles in ~2 years — after that, you're playing with house money.
Negotiation context
- It's been on market 93 days — a 9% lower offer ($41k) is reasonable based on typical stale-listing flexibility.
- 2 sale attempts since 2y ago; this cycle's ask has dropped $5k (10%) from the opening price — seller is motivated, your offer sets the floor, not the list.
Questions for the listing agent
- It's been on market 93 days. Have you received any prior offers? Is the seller open to a 9% concession, seller financing, or rate buy-down credit?
- Built in 1975 — when were the roof, HVAC, electrical panel, plumbing, and water heater last replaced?
- Why hasn't it sold? Are there any deal-killer items the seller is aware of (foundation, flood, title, zoning, code violations)?
- Is there a deadline driving the sale (1031 exchange, divorce, estate, relocation)? That informs how much negotiation room exists.
- What's the average days-on-market for RENTAL listings here right now (not sales)? A rising rental-DOM trend means longer vacancies and softer asking-rent achievability than the comps imply.
- What's the recent tenant-quality profile in this submarket — average credit score on applications, eviction rate, late-payment / NSF rate, and stable-employment percentage? A property-management company in the area should have these aggregated.
- How much new for-sale + rental construction is in the pipeline within 1–3 miles? Heavy new supply typically softens prices + rents 12–24 months out; constrained supply supports both.
Investment metrics
- 1% rule
- 3.56% ✓
- Cap rate
- 33.02%
- Cash-on-cash
- 95.45%
- DSCR
- 5.25
- GRM
- 2.3
CMA / ARV
- ARV (median comp)
- $30,122
- List price
- $45,000
- Delta
- 49.39%
- Verdict
- OVERPRICED
- Comps
- 1 within 2.0 mi
Projected returns pro-forma
-3.0% appreciation · 3.0% rent growth · sell at horizon
- IRR
- 96.3%
- Equity multiple
- 5.49×
- Total profit
- $56,536
- Equity at exit
- $6,710
- IRR
- 99.0%
- Equity multiple
- 11.43×
- Total profit
- $131,404
- Equity at exit
- $3,891
Cash invested: $12,600 (down + closing). Projections, not guarantees.
Landlord ↔ Tenant lean methodology
- Overall (STATE)
- 28 Tenant-Leaning
- State Washington
- 28 Tenant-Leaning · D+8
- County
- — inherits STATE
- City
- — inherits STATE
ZIP-level market 98541
- Active inventory
- 103
- Price-to-rent
- 2.3×
Monthly cashflow live
- Estimated rent
- $1,601 medium interval (Pro) →
- Mortgage (P&I)
- −$236
- Tax from tax record
- −$8 /mo · $90/yr
- Insurance
- −$19
- HOA
- −$0
- Vacancy / Maint / Mgmt
- −$336
- Net cashflow
- $1,002
Break-even live
UW: 25.0% down · 7.5% · 30yr · 1.5% tax · 5.0% vac · 8.0% maint · 8.0% mgmt
Financing live
Cash to close
- Down payment
- $11,250
- Closing costs
- $1,350
- Reserves months
- —
- Total cash needed
- —
Loan-product check · same deal, 3 products live
Conventional
25% down · 7.5% · 30yr
- Down + closing
- —
- Monthly P&I
- —
- Monthly cashflow
- —
- DSCR
- —
- Eligible?
- —
Personal DTI + credit; lowest rate.
DSCR
20% down · 8.5% · 30yr
- Down + closing
- —
- Monthly P&I
- —
- Monthly cashflow
- —
- DSCR
- —
- Eligible?
- —
No personal income docs; deal must DSCR.
Hard money
10% down · 12.0% · 12mo
- Down + closing
- —
- Monthly P&I
- —
- Monthly cashflow
- —
- DSCR
- —
- Eligible?
- —
Short-term bridge; refi at stabilization.
Rent comps 3 comps
| Address | Beds | Baths | Sqft | Rent | $/sqft | DOM | Units | Dist |
|---|---|---|---|---|---|---|---|---|
| 1201 W Main St Apt E Elma, WA | 2.0 | 1.0 | 800 | $1,550 | $1.94 | 13d | 1 | 1.36mi |
| 1201 W Main St Unit H Elma, WA | 2.0 | 1.0 | 800 | $1,550 | $1.94 | 21d | 1 | 1.36mi |
| 1116 Wakefield St Elma, WA | 2.0 | 1.0 | 775 | $1,710 | $2.21 | 13d | 1 | 1.42mi |
Listing history 16 events
-
2026-06-12statusdays on market $45,000 Pending 93 DOM
-
2026-06-09days on market $45,000 Active 92 DOM
-
2026-06-08days on market $45,000 Active 91 DOM
-
2026-06-08days on market $45,000 Active 90 DOM
-
2026-06-05days on market $45,000 Active 88 DOM
-
2026-06-03days on market $45,000 Active 86 DOM
-
2026-06-02days on market $45,000 Active 85 DOM
-
2026-06-01days on market $45,000 Active 84 DOM
-
2026-05-31days on market $45,000 Active 83 DOM
-
2026-05-15price $45,000
-
2026-04-04price $47,000
-
2026-03-09$49,900 Active
-
2024-11-19soldstatus $65,000 Closed
-
2024-11-02status Pending
-
2024-10-23price $65,000
-
2024-09-20$72,000 Active
ⓘ Source: listings_history table (triggers on properties + properties_extension) + one-shot
backfill from property_details.listing_events for pre-trigger history.
Tax reassessment forecast WA · Resets to sale price
- Current annual tax
- $90 · $8/mo
- Projected year-2 tax
- $441 · $37/mo
- Expected delta
- +$351/yr (+$29/mo · 388.3%)
ⓘ Screening estimate from a state-policy table — verify with the county assessor before closing.
Climate risk First Street
- Flood 1/10 Low FEMA zone X (unshaded) · 0% chance over 30 yrs
- Wildfire 2/10 Low
- Heat 2/10 Low 7 d/yr ≥89°F today · 15 d/yr by 30 yrs out
- Wind 1/10 Low
- Air quality 6/10 Major 8 unhealthy d/yr today · 8 by 30 yrs out
Nearby sold comps map
Loading sold comps map…
Walkable amenities ~0.75 mi
Loading nearby amenities…
Taxation est. · year 1
- Rental income
- $19,208
- − Mortgage interest
- −$2,521
- − Property taxes
- −$90
- − Insurance
- −$225
- − Repairs & maintenance
- −$1,537
- − Management
- −$1,537
- − Depreciation
- −$1,309
- Taxable income
- $11,989
- Est. tax owed @ 24.0%
- −$2,877
- After-tax cash flow
- $9,150/yr
For passive investors: Depreciation is non-cash, so a rental often shows a tax loss while cash-flowing — sheltering income. Rental losses are passive: they offset passive income freely, and up to $25,000/yr can offset ordinary (W-2) income if you actively participate and your MAGI is under $100k (phasing out to $0 by $150k); unused losses carry forward. On sale, claimed depreciation is recaptured at up to 25%, and gains may owe capital-gains tax (a 1031 exchange can defer both). Figures are a year-1 estimate at your 24.0% rate — not tax advice; consult a CPA.
Condition & rehab AI · 12 photos
This updated 2-bedroom, 1 full bath manufactured home is move-in ready with modern updates and a well-maintained exterior. It offers a great blend of comfort, convenience, and recreation in the heart of Elma.
Value-add opportunities
- Resale paint exterior — enhances curb appeal
- Both update flooring — modernizes space and adds value
- Resale update kitchen appliances — modernizes space and adds value
Renovation cost estimate screening
Value-add ROI direction
- Resale paint exterior — enhances curb appeal ↑
- Both update flooring — modernizes space and adds value ↑
- Resale update kitchen appliances — modernizes space and adds value ↑
ⓘ Cost ranges are severity-bucket heuristics (US national rule-of-thumb). Get contractor quotes + a written scope before underwriting a rehab budget.
Schools (NCES district)
- District
- Elma School District
- NCES district ID
- 5302490
- Math proficiency
- 45% ▲ 5.00%
- Reading proficiency
- 56% ▲ 5.00%
- Median HH income
- $45,658
- Composite
- 44.76/100
- National rank
- #5959
- State rank
- #146 of 291 in WA
Livability — Satsop
- Score
- 62/100
- State rank
- #423
- US rank
- #16784
Category grades
Schools grade is shown separately in the Schools card above.
Census & demographics
- City population
- 109
- Population (ZIP)
- 10,285
Population outlook (Grays Harbor County) Hauer SSP2
- Today (2025)
- 66,443 people
- By 2030
- 63,255 · -4.8%
- By 2040
- 56,466 · -15.0%
- By 2050
- 50,516 · -24.0%
- By 2075
- 39,296 · -40.9%
- By 2100
- 31,142 · -53.1%
Race, ethnicity, and origin ACS 2023
- Neighborhood character
- Predominantly White (80%)
- Race & ethnicity
- White 80% Hispanic / Latino 13% Two or more races 9% Native American 2%
- Hispanic origin (detail)
- Mexican 12%
- Common ancestry
- Portuguese 6% Slovak 3% Scotch-Irish 2%
- Foreign-born
- 6% · Canada, Jamaica
- Languages at home
- 87% English-only · Spanish 11% Korean 1%
Political lean MEDSL · Grays Harbor
- 2024 margin
- Lean R (+6.0) · D 45.6% · R 51.6% · Other 2.8%
- 2008→2024 swing
- -20.6pp toward R · 2008: 14.6pp · 2024: -6.0pp
- All cycles
- 2024: R+6.0 2020: R+6.6 2016: R+7.1 2012: D+14.0 2008: D+14.6
Not yet ingested
- Civics
- —
Market trends
- HPI YoY
- ▼ -174.43%
- Current HPI
- 199.9988
- Rent YoY
- —
- Metro
- —
- State GDP YoY
- ▲ 4.65%
- F500 in state
- 22
Industry mix (Fortune 500 HQ in WA)
| Industry | F500 HQs | Revenue |
|---|---|---|
| Retail | 2 | $269B |
|
||
| Technology / Retail | 1 | $638B |
|
||
| Technology | 1 | $245B |
|
||
| Telecommunications | 1 | $38B |
|
||
| Food / Beverage | 1 | $36B |
|
||
| Automotive / Trucks | 1 | $34B |
|
||
Price history
-37.5% since first listed7 events — show timeline
- 2026-05-15 Price Changed $45,000 NWMLS as Distributed by MLS Grid
- 2026-04-04 Price Changed $47,000 NWMLS as Distributed by MLS Grid
- 2026-03-09 Listed $49,900 NWMLS as Distributed by MLS Grid
- 2024-11-19 Sold (MLS) $65,000 NWMLS as Distributed by MLS Grid
- 2024-11-02 Pending — NWMLS as Distributed by MLS Grid
- 2024-10-23 Price Changed $65,000 NWMLS as Distributed by MLS Grid
- 2024-09-20 Listed $72,000 NWMLS as Distributed by MLS Grid
Cash-flow waterfall
monthlySold comps — $/sqft
last 12 mo · ≤1 miLoading sold comps…