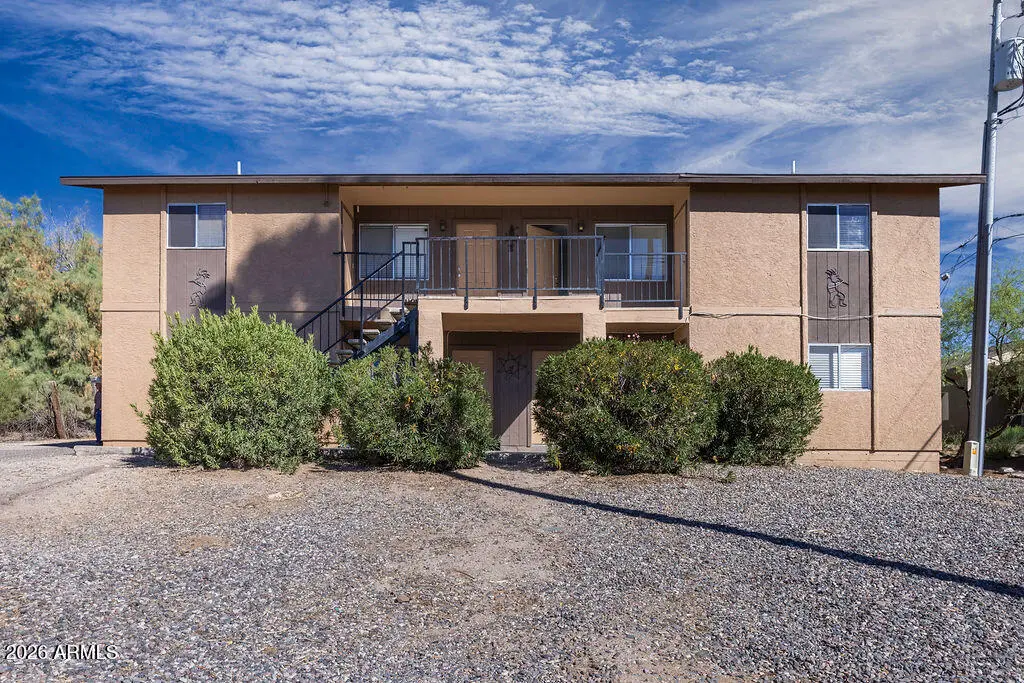
 Fourplex
450 Palm Dr · Wickenburg, AZ
Flood risk 1/10 · Minimal
- FEMA flood zone
- X (shaded)
- Chance of flooding over 30 yrs
- 0.0%
- Est. flood insurance / yr
- $507 – $1,088
Fire risk 5/10 · Moderate
- Est. fire insurance / yr
- $610 – $1,132
Heat risk 8/10 · Major
- Hot days now (above 110°F)
- 7 days/yr
- Hot days in 30 yrs
- 18 days/yr
Wind risk 1/10 · Minimal
- Chance of severe wind over 30 yrs
- —
Air-quality risk 1/10 · Minimal
- Unhealthy air days now
- 0 days/yr
- Unhealthy air days in 30 yrs
- 0 days/yr
Risk factors via First Street. Map © Google.
Why this score? — see what drove the D- grade
The composite is a weighted blend of 9 inputs, each scored 0–100. Each bar is that input's sub-score; the figure is the points it added to the 100-point composite (weight × sub-score).
- Cash flow +11.7/30.0
- ARV discount +7.5/15.0
- Livability +3.5/5.0
- 1% rule +3.4/10.0
- DSCR +3.4/10.0
- Schools +2.9/10.0
- Rent growth +2.5/5.0
- Condition / age +2.5/5.0
- Appreciation +0.0/10.0
$625,000
🖨 Deal sheet 📄 Offer letter ✓ Due diligence
Multi-family units
County records classify this as Multi-Family (2-4 Unit). Listing-text estimate: 4 units. confirmed
Listing remarks MLS
Fully rented fourplex in the heart of Wickenburg--an excellent investment opportunity with immediate income potential! Ideally located within walking distance to historic downtown Wickenburg, this property offers convenience to shopping, dining, and local amenities. Each of the four units features 2 bedrooms and 1 bathroom, providing desirable layouts for tenants and strong rental appeal. With all units currently occupied, this is a turnkey income-producing property ready for its next owner. Whether you're looking to expand your portfolio or secure a solid investment in a growing market, this well-located multi-family property is a must-see!
Key facts
- 9,879 sq ft lot
- 4 parking spots
- Built 1986
Tags
Neighborhood map
What this means for you Summary
Snapshot
- This is a 4 × 2-bed/1-bath units multifamily listed at $625k.
Deal economics
- At list price, monthly cash flow is $-184 ($-2k/yr) — negative. Per door: $-46/mo.
- To cash-flow at today's rent, offer at most $598k (4.3% below list).
- To meet the 1% rule (rent ≥ 1% of price), the offer needs to be $523k (16.3% below list).
- Recommended offer: $523k (16.3% below list) — sets the bar for 1% rule.
- Cap rate 5.9% vs local median 3.0% in Wickenburg — top-decile yield for the area; either an underpriced asset or a hidden risk that comps aren't pricing in. Stress-test before assuming the spread holds.
Location & tenants
- Location reads 70/100 on livability (#41 in AZ) — a middle-class / working-renter tenant base. Strengths: crime A+, housing A+, cost of living A-; Watch: schools D+, amenities F, commute F.
- Wickenburg Unified District (4236) (rural): math 33% / reading 35% proficiency, ranked #92 of 249 in AZ (top 37%) — families likely to look elsewhere, expect single-tenant / working-renter base with shorter leases.
- Market conditions: 378 active listings in the ZIP; 13 comparable units currently listed for rent nearby; rentals at typical pace (median 19d on market — plan ~3-4 weeks tenant-placement turnaround); 36,011 units permitted in Maricopa County in 2024 (12,801 in 5+ unit buildings).
- At $5,234/mo this rent would consume 92% of the median local household income ($69k/yr) (locally 251% of renters already pay >50% of income on rent) — very limited rent-growth headroom before tenants either downsize or default.
Forward outlook
- Local home prices are declining (-3.0%/yr); year-one equity from $4k of loan paydown is wiped out by about $19k of value loss. Plan a longer hold.
- Maricopa County population projected at +38% by 2050 — long-run rental-demand tailwind backs the buy-and-hold thesis.
Negotiation context
- It's been on market 85 days — a 6% lower offer ($588k) is reasonable based on typical stale-listing flexibility.
- 8 sale attempts since 21y ago with the ask held roughly flat each time — persistent listings suggest the price (not the market) is what's stuck; bring a comps-based counter.
- Current owner paid $128k; list at $625k implies a 390% gain — meaningful room to come down on a strong offer.
Risks & watch-outs
- Climate carrying-cost: moderate wildfire risk; extreme-heat days projected 7→18/yr by 2055 (HVAC capex compounding) — expect insurance premiums to compound above CPI over the hold.
Questions for the listing agent
- What do current leases actually rent for vs. the listed asking? Can we see a recent rent roll and the last 12 months of T-12 income?
- It's been on market 85 days. Have you received any prior offers? Is the seller open to a 16% concession, seller financing, or rate buy-down credit?
- Can we see the unit-by-unit rent roll, current vacancy, and any below-market leases? What's the average tenancy length?
- What capital expenditures (roof, boiler, parking lot, exteriors) have been made in the last 5 years, and what's planned in the next 2?
- Why hasn't it sold? Are there any deal-killer items the seller is aware of (foundation, flood, title, zoning, code violations)?
- Is there a deadline driving the sale (1031 exchange, divorce, estate, relocation)? That informs how much negotiation room exists.
- Schools are D-rated, which usually means shorter tenancies and higher turnover. Who's the typical renter profile here, and what's been the actual vacancy rate?
- The area grade is low — what's the realistic commute time and amenity access for the typical tenant pool here? Any planned neighborhood developments (good or bad) we should know about?
- What's the average days-on-market for RENTAL listings here right now (not sales)? A rising rental-DOM trend means longer vacancies and softer asking-rent achievability than the comps imply.
- What's the recent tenant-quality profile in this submarket — average credit score on applications, eviction rate, late-payment / NSF rate, and stable-employment percentage? A property-management company in the area should have these aggregated.
- How much new apartment / multifamily construction is in the pipeline within 1–3 miles? Heavy new supply (>2% of stock underway) typically softens rents 12–24 months out; light construction supports rent growth.
Investment metrics
- 1% rule
- 0.84% ✗
- Cap rate
- 5.94%
- Cash-on-cash
- -1.26%
- DSCR
- 0.94
- GRM
- 10.0
CMA / ARV
No comps found within radius.
Projected returns pro-forma
-3.0% appreciation · 3.0% rent growth · sell at horizon
- IRR
- -18.4%
- Equity multiple
- 0.35×
- Total profit
- $-112,941
- Equity at exit
- $93,190
- IRR
- -10.7%
- Equity multiple
- 0.35×
- Total profit
- $-113,147
- Equity at exit
- $54,039
Cash invested: $175,000 (down + closing). Projections, not guarantees.
Landlord ↔ Tenant lean methodology
- Overall (STATE)
- 87 Strongly Landlord-Friendly
- State Arizona
- 87 Strongly Landlord-Friendly · R+3
- County
- — inherits STATE
- City
- — inherits STATE
ZIP-level market 85390
- Home prices YoY
- -17.4%
- Active inventory
- 378
- Price-to-rent
- 39.8×
Monthly cashflow live
- Estimated rent
- $5,234 medium interval (Pro) →
- Mortgage (P&I)
- −$3,278
- Tax est. 1.5%
- −$781 /mo · $9,375/yr
- Insurance
- −$260
- HOA
- −$0
- Vacancy / Maint / Mgmt
- −$1,099
- Net cashflow
- $-184
Break-even live
4-unit breakdown (identical units grouped — click to expand)
| Units | Beds | Baths | Est. rent |
|---|---|---|---|
| 4× units | 2 | 1 | $5,236 |
| #1 | 2 | 1 | $1,309 |
| #2 | 2 | 1 | $1,309 |
| #3 | 2 | 1 | $1,309 |
| #4 | 2 | 1 | $1,309 |
| Total (4 units) | $5,234 | ||
UW: 25.0% down · 7.5% · 30yr · 1.5% tax · 5.0% vac · 8.0% maint · 8.0% mgmt
Financing live
Cash to close
- Down payment
- $156,250
- Closing costs
- $18,750
- Reserves months
- —
- Total cash needed
- —
Loan-product check · same deal, 3 products live
Conventional
25% down · 7.5% · 30yr
- Down + closing
- —
- Monthly P&I
- —
- Monthly cashflow
- —
- DSCR
- —
- Eligible?
- —
Personal DTI + credit; lowest rate.
DSCR
20% down · 8.5% · 30yr
- Down + closing
- —
- Monthly P&I
- —
- Monthly cashflow
- —
- DSCR
- —
- Eligible?
- —
No personal income docs; deal must DSCR.
Hard money
10% down · 12.0% · 12mo
- Down + closing
- —
- Monthly P&I
- —
- Monthly cashflow
- —
- DSCR
- —
- Eligible?
- —
Short-term bridge; refi at stabilization.
Rent comps 13 comps
| Address | Beds | Baths | Sqft | Rent | $/sqft | DOM | Units | Dist |
|---|---|---|---|---|---|---|---|---|
| 54 Northridge Cir Wickenburg, AZ | 2.0 | 2.5 | 1227 | $1,800 | $1.47 | 16d | 1 | 0.24mi |
| 54 Northridge Cir Unit 1 Wickenburg, AZ | 2.0 | 2.0 | 1227 | $1,800 | $1.47 | 3d | 1 | 0.24mi |
| 54 Northridge Cir Wickenburg, AZ | 2.0 | 2.5 | 1227 | $1,800 | $1.47 | 5d | 1 | 0.24mi |
| 737 Dylan Ct Wickenburg, AZ | 3.0 | 2.0 | 1542 | $1,750 | $1.13 | 43d | 1 | 0.41mi |
| 736 Dylan Ct Wickenburg, AZ | 3.0 | 2.0 | 1543 | $1,750 | $1.13 | 43d | 1 | 0.41mi |
| 741 Dylan Ct Wickenburg, AZ | 3.0 | 2.0 | 1548 | $1,645 | $1.06 | 21d | 1 | 0.41mi |
| 757 Dylan Ct Wickenburg, AZ | 3.0 | 2.0 | 1290 | $1,585 | $1.23 | 5d | 1 | 0.44mi |
| 640 Atchison Cir Wickenburg, AZ | 3.0 | 2.0 | 1611 | $3,500 | $2.17 | 43d | 1 | 0.70mi |
| 900 W Hermosa Dr Wickenburg, AZ | 3.0 | 2.0 | 1737 | $3,000 | $1.73 | 43d | 1 | 0.74mi |
| 600 Desert Canyon Rd Wickenburg, AZ | 3.0 | 2.0 | 1498 | $1,850 | $1.23 | 43d | 1 | 1.05mi |
| 70 W Monte Cristo Dr Wickenburg, AZ | 3.0 | 2.0 | 1338 | $3,000 | $2.24 | 10d | 1 | 1.07mi |
| 70 W Monte Cristo Dr Wickenburg, AZ | 3.0 | 2.0 | 1338 | $3,000 | $2.24 | 1d | 1 | 1.07mi |
| 18 W Monte Cristo Dr Wickenburg, AZ | 3.0 | 2.0 | 1338 | $2,100 | $1.57 | 19d | 1 | 1.12mi |
Listing history 33 events
-
2026-06-18days on market $625,000 Active 85 DOM
-
2026-06-17days on market $625,000 Active 84 DOM
-
2026-06-16days on market $625,000 Active 83 DOM
-
2026-06-15days on market $625,000 Active 82 DOM
-
2026-06-13days on market $625,000 Active 80 DOM
-
2026-06-13days on market $625,000 Active 79 DOM
-
2026-06-09days on market $625,000 Active 76 DOM
-
2026-06-08days on market $625,000 Active 75 DOM
-
2026-06-07days on market $625,000 Active 74 DOM
-
2026-06-04days on market $625,000 Active 71 DOM
-
2026-06-03days on market $625,000 Active 70 DOM
-
2026-06-02days on market $625,000 Active 69 DOM
-
2026-06-01days on market $625,000 Active 68 DOM
-
2026-05-31days on market $625,000 Active 67 DOM
-
2026-03-22historical $1,100
-
2026-03-20$625,000 Active 650-char remark
Show marketing remark (650 chars)
Fully rented fourplex in the heart of Wickenburg--an excellent investment opportunity with immediate income potential! Ideally located within walking distance to historic downtown Wickenburg, this property offers convenience to shopping, dining, and local amenities. Each of the four units features 2 bedrooms and 1 bathroom, providing desirable layouts for tenants and strong rental appeal. With all units currently occupied, this is a turnkey income-producing property ready for its next owner. Whether you're looking to expand your portfolio or secure a solid investment in a growing market, this well-located multi-family property is a must-see!
-
2026-02-25$1,100
-
2024-09-09historical $1,050
-
2024-09-06$1,050
-
2015-02-13soldstatus $127,500
-
2013-12-14historical
-
2013-09-18$325,000 Active
-
2013-03-19historical
-
2013-01-18$295,000 Active
-
2008-09-30historical
-
2007-09-10$475,000
-
2006-10-03historical
-
2006-06-08$385,000
-
2005-07-01historical
-
2005-05-17$305,000
-
2004-09-15soldstatus $130,000
-
1998-07-01soldstatus $107,730
-
1986-05-01soldstatus $65,000
ⓘ Source: listings_history table (triggers on properties + properties_extension) + one-shot
backfill from property_details.listing_events for pre-trigger history.
Climate risk First Street
- Flood 1/10 Low FEMA zone X (shaded) · 0% chance over 30 yrs
- Wildfire 5/10 Major
- Heat 8/10 Severe 7 d/yr ≥110°F today · 18 d/yr by 30 yrs out
- Wind 1/10 Low
- Air quality 1/10 Low 0 unhealthy d/yr today · 0 by 30 yrs out
Nearby sold comps map
Loading sold comps map…
Walkable amenities ~0.75 mi
Loading nearby amenities…
Taxation est. · year 1
- Rental income
- $62,808
- − Mortgage interest
- −$35,010
- − Property taxes
- −$9,375
- − Insurance
- −$3,125
- − Repairs & maintenance
- −$5,025
- − Management
- −$5,025
- − Depreciation
- −$18,182
- Taxable loss
- −$12,933
- Est. tax savings @ 24.0%
- +$3,104
- After-tax cash flow
- $891/yr
For passive investors: Depreciation is non-cash, so a rental often shows a tax loss while cash-flowing — sheltering income. Rental losses are passive: they offset passive income freely, and up to $25,000/yr can offset ordinary (W-2) income if you actively participate and your MAGI is under $100k (phasing out to $0 by $150k); unused losses carry forward. On sale, claimed depreciation is recaptured at up to 25%, and gains may owe capital-gains tax (a 1031 exchange can defer both). Figures are a year-1 estimate at your 24.0% rate — not tax advice; consult a CPA.
Schools (NCES district)
- District
- Wickenburg Unified District (4236)
- NCES district ID
- 0409190
- Math proficiency
- 33% ▼ -10.00%
- Reading proficiency
- 35% ▼ -7.00%
- Median HH income
- $47,369
- Composite
- 29.27/100
- National rank
- #6560
- State rank
- #92 of 249 in AZ
Livability — Wickenburg
- Score
- 70/100
- State rank
- #41
- US rank
- #7975
Category grades
Schools grade is shown separately in the Schools card above.
Census & demographics
- Census place
- Wickenburg, AZ
- County
- Maricopa County · 4,537,380 people
- City population
- 10,298
- Metro
- Phoenix-Mesa-Chandler, AZ
- Population (ZIP)
- 10,298
- Household income
- $68,591
- Rent vs Own
- Severe rent burden
- 251.0
Population outlook (Maricopa County) Hauer SSP2
- Today (2025)
- 4,979,203 people
- By 2030
- 5,378,229 · +8.0%
- By 2040
- 6,156,598 · +23.6%
- By 2050
- 6,872,376 · +38.0%
- By 2075
- 8,401,270 · +68.7%
- By 2100
- 9,247,439 · +85.7%
Race, ethnicity, and origin ACS 2023
- Neighborhood character
- Predominantly White (88%)
- Race & ethnicity
- White 88% Hispanic / Latino 7% Two or more races 4% Native American 1%
- Hispanic origin (detail)
- Mexican 5%
- Common ancestry
- Portuguese 3% Lithuanian 3% Slovak 2%
- Foreign-born
- 3% · Canada
- Languages at home
- 93% English-only · Spanish 5%
Political lean MEDSL · Maricopa
- 2024 margin
- Toss-up / Even · D 47.7% · R 51.2% · Other 1.1%
- 2008→2024 swing
- +7.1pp toward D · 2008: -10.6pp · 2024: -3.5pp
- All cycles
- 2024: R+3.5 2020: D+2.2 2016: R+3.5 2012: R+12.0 2008: R+10.6
Not yet ingested
- Civics
- —
Market trends
- HPI YoY
- ▼ -66.26%
- Current HPI
- 314.3169
- Rent YoY
- —
- Metro
- Phoenix-Mesa-Chandler, AZ
- State GDP YoY
- ▲ 4.54%
- F500 in state
- 20
Industry mix (Fortune 500 HQ in AZ)
| Industry | F500 HQs | Revenue |
|---|---|---|
| Technology | 2 | $13B |
|
||
| Mining / Metals | 1 | $23B |
|
||
| Environmental Services | 1 | $16B |
|
||
| Metals / Steel | 1 | $14B |
|
||
| Technology Distribution | 1 | $9B |
|
||
| Homebuilding | 1 | $8B |
|
||
Price history
-98.3% since first listed19 events — show timeline
- 2026-03-22 Rental Removed $1,100 RENTALBEAST
- 2026-03-20 Listed $625,000 ARMLS
- 2026-02-25 Listed for Rent $1,100 RENTALBEAST
- 2024-09-09 Rental Removed $1,050 RENTALBEAST
- 2024-09-06 Listed for Rent $1,050 RENTALBEAST
- 2015-02-13 Sold (Public Records) $127,500 Public Records
- 2013-12-14 Listing Removed — ARMLS
- 2013-09-18 Listed $325,000 ARMLS
- 2013-03-19 Listing Removed — ARMLS
- 2013-01-18 Listed $295,000 ARMLS
- 2008-09-30 Listing Removed — ARMLS
- 2007-09-10 Listed $475,000 ARMLS
- 2006-10-03 Listing Removed — ARMLS
- 2006-06-08 Listed $385,000 ARMLS
- 2005-07-01 Listing Removed — ARMLS
- 2005-05-17 Listed $305,000 ARMLS
- 2004-09-15 Sold (Public Records) $130,000 Public Records
- 1998-07-01 Sold (Public Records) $107,730 Public Records
- 1986-05-01 Sold (Public Records) $65,000 Public Records
Property tax history
-3.3%/yrLatest (2025): $500 · -1.4% YoY. Source: county tax records.
Cash-flow waterfall
monthlySold comps — $/sqft
last 12 mo · ≤1 miLoading sold comps…