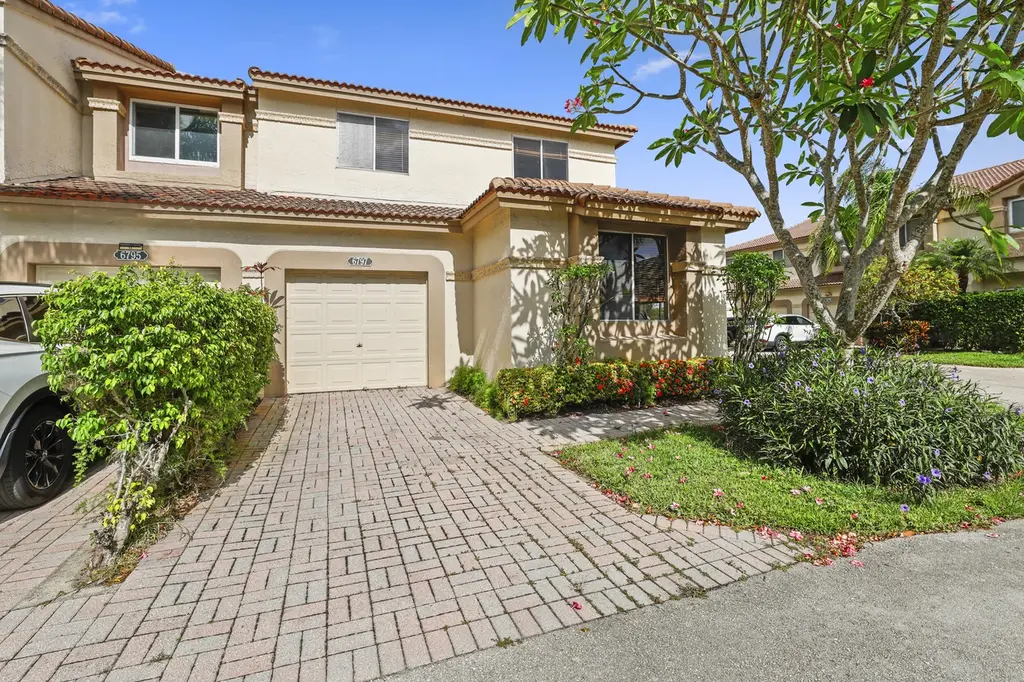
6797 Via Regina #4 · Deerfield Beach, FL
Flood risk 1/10 · Minimal
- FEMA flood zone
- X (unshaded)
- Chance of flooding over 30 yrs
- 0.0%
- Est. flood insurance / yr
- $507 – $1,088
Fire risk 1/10 · Minimal
- Est. fire insurance / yr
- $947 – $1,759
Heat risk 9/10 · Severe
- Hot days now (above 107°F)
- 7 days/yr
- Hot days in 30 yrs
- 27 days/yr
Wind risk 10/10 · Severe
- Chance of severe wind over 30 yrs
- 99.0%
Air-quality risk 2/10 · Minimal
- Unhealthy air days now
- 1 days/yr
- Unhealthy air days in 30 yrs
- 3 days/yr
Risk factors via First Street. Map © Google.
Why this score? — see what drove the D- grade
The composite is a weighted blend of 9 inputs, each scored 0–100. Each bar is that input's sub-score; the figure is the points it added to the 100-point composite (weight × sub-score).
- Cash flow +10.2/30.0
- ARV discount +7.5/15.0
- 1% rule +6.0/10.0
- Schools +4.3/10.0
- Livability +3.8/5.0
- DSCR +2.9/10.0
- Rent growth +2.6/5.0
- Condition / age +2.5/5.0
- Appreciation +0.0/10.0
$399,000
🖨 Deal sheet 📄 Offer letter ✓ Due diligence
Listing remarks MLS
FABULOUS WIDE LAKE VIEWS FROM THE LARGE TILED PATIO! 3BR/2.5BA, 2-STORY TOWNHOUSE HAS 1 CAR GARAGE, ALL TILED DOWNSTAIRS, NEUTRAL DECOR. LOCATED ON QUIET CUL-DE-SAC & NEAR COMMUNITY POOL. MOVE-IN CONDITION!
Key facts
- Prime location
- Spacious layout
- $715 HOA
Tags
Property features AI
Finance
- Financial info: Pets allowed with breed, number, and size restrictions
- HOA & community: HOA managed by Crest Management; Monthly HOA fee of $715; HOA includes cable TV, insurance, internet, and trash; Community amenities include clubhouse and heated pool
Exterior
- Parking: Attached garage (1 garage space, 1 covered space, 2 total parking spaces)
- Security: Gated community with guard
- Utilities: Public water; Public sewer; Electricity connected; Water connected; Sewer connected
- Home design: Condominium; Two-story; Resale property; Faces east
- Construction: CBS construction; Tile roof
- Exterior features: Screened patio; Patio; Waterfront property
Interior
- Kitchen: No kitchen appliance details provided
- Bedrooms: No main level bedrooms
- Flooring: Ceramic tile; Laminate
- Bathrooms: Two full bathrooms and one half bathroom (three total); one bathroom on the main level
- Heating & cooling: Central heating; Central air conditioning
- Interior features: No notable interior features listed; Windows described as other
- Laundry & utility: In-unit laundry
Neighborhood map
What this means for you Summary
Snapshot
- This is a 3-bed/2.5-bath condo listed at $399k.
Deal economics
- At list price, monthly cash flow is $-223 ($-3k/yr) — negative.
- To cash-flow at today's rent, offer at most $360k (9.9% below list).
- Meets the 1% rule at list price ($4k rent vs $399k).
- Recommended offer: $360k (9.9% below list) — sets the bar for cash-flow.
- Cap rate 5.6% vs local median 4.2% in Deerfield Beach — top-decile yield for the area; either an underpriced asset or a hidden risk that comps aren't pricing in. Stress-test before assuming the spread holds.
Location & tenants
- Location reads 75/100 on livability (#250 in FL, #3,970 nationally) — a middle-class / working-renter tenant base. Strengths: housing A+, health & safety A+, cost of living A; Watch: amenities D-, employment D-.
- Palm Beach (suburban): math 46% / reading 53% proficiency, ranked #34 of 73 in FL (top 47%) — families likely to look elsewhere, expect single-tenant / working-renter base with shorter leases.
- Zoned schools: Verde K-8 (math 72% / reading 74%, grade A, #271 of 2,144 statewide, top 13%, 1,296 students, 28% FRL); Boca Raton Community Middle School (math 59% / reading 61%, grade B, #135 of 571 statewide, top 24%, 1,225 students, 41% FRL); West Boca Raton High School (math 55% / reading 70%, grade B-, #93 of 667 statewide, top 14%, 2,271 students, 28% FRL) — zoned schools average 32% FRL vs 52% district-wide (20 pts lower); this property's tenant base skews higher-income than the district average.
- Zoned-school proficiency averages 65% at this address vs 50% district-wide (+16 pts) — the actual schools serving this property are materially stronger than the Palm Beach average implies; a family-tenant draw the district grade alone would hide.
- Market conditions: Rents flat; 430 active listings in the ZIP; 40 comparable units currently listed for rent nearby; rentals at typical pace (median 19d on market — plan ~3-4 weeks tenant-placement turnaround); solid renter incomes; 3,974 units permitted in Palm Beach County in 2024 (1,012 in 5+ unit buildings).
- At $4,381/mo this rent would consume 63% of the median local household income ($84k/yr) (locally 2900% of renters already pay >50% of income on rent) — very limited rent-growth headroom before tenants either downsize or default.
Forward outlook
- Local home prices are declining (-3.0%/yr); year-one equity from $3k of loan paydown is wiped out by about $12k of value loss. Plan a longer hold.
- Palm Beach County population projected at +30% by 2050 — long-run rental-demand tailwind backs the buy-and-hold thesis.
Negotiation context
- Only 7 days on market — expect competitive offers; lowballing is unlikely to land.
- 2 sale attempts since 24y ago with the ask held roughly flat each time — persistent listings suggest the price (not the market) is what's stuck; bring a comps-based counter.
- Current owner paid $275k; 45% above their basis — modest negotiation headroom, anchor on the comps not their cost.
Risks & watch-outs
- Climate carrying-cost: severe wind risk, 99% chance of damaging wind over 30y; extreme-heat days projected 7→27/yr by 2055 (HVAC capex compounding) — expect insurance premiums to compound above CPI over the hold.
Questions for the listing agent
- What do current leases actually rent for vs. the listed asking? Can we see a recent rent roll and the last 12 months of T-12 income?
- What does the HOA fee cover, when was the last increase, and are there any pending special assessments or reserve-fund shortfalls?
- Any open or pending special assessments — roof, HVAC, plumbing, elevator, façade? What's the per-unit balance and payoff schedule, and is the seller paying it off at close or rolling it to the buyer?
- Is there a deadline driving the sale (1031 exchange, divorce, estate, relocation)? That informs how much negotiation room exists.
- Schools are D-rated, which usually means shorter tenancies and higher turnover. Who's the typical renter profile here, and what's been the actual vacancy rate?
- The area grade is low — what's the realistic commute time and amenity access for the typical tenant pool here? Any planned neighborhood developments (good or bad) we should know about?
- What's the average days-on-market for RENTAL listings here right now (not sales)? A rising rental-DOM trend means longer vacancies and softer asking-rent achievability than the comps imply.
- What's the recent tenant-quality profile in this submarket — average credit score on applications, eviction rate, late-payment / NSF rate, and stable-employment percentage? A property-management company in the area should have these aggregated.
- How much new apartment / multifamily construction is in the pipeline within 1–3 miles? Heavy new supply (>2% of stock underway) typically softens rents 12–24 months out; light construction supports rent growth.
Investment metrics
- 1% rule
- 1.10% ✓
- Cap rate
- 5.62%
- Cash-on-cash
- -2.39%
- DSCR
- 0.89
- GRM
- 7.6
CMA / ARV
No comps found within radius.
Projected returns pro-forma
-3.0% appreciation · 0.33% rent growth · sell at horizon
- IRR
- -24.2%
- Equity multiple
- 0.20×
- Total profit
- $-89,685
- Equity at exit
- $59,492
- IRR
- -35.1%
- Equity multiple
- -0.24×
- Total profit
- $-138,395
- Equity at exit
- $34,498
Cash invested: $111,720 (down + closing). Projections, not guarantees.
Landlord ↔ Tenant lean methodology
- Overall (STATE)
- 87 Strongly Landlord-Friendly
- State Florida
- 87 Strongly Landlord-Friendly · R+3
- County
- — inherits STATE
- City
- — inherits STATE
ZIP-level market 33433
- Rents YoY
- 0.3%
- Active inventory
- 430
- Price-to-rent
- 7.6×
Monthly cashflow live
- Estimated rent
- $4,381 high interval (Pro) →
- Mortgage (P&I)
- −$2,092
- Tax from tax record
- −$710 /mo · $8,526/yr
- Insurance
- −$166
- HOA
- −$715
- Vacancy / Maint / Mgmt
- −$920
- Net cashflow
- $-223
Break-even live
UW: 25.0% down · 7.5% · 30yr · 1.5% tax · 5.0% vac · 8.0% maint · 8.0% mgmt
Financing live
Cash to close
- Down payment
- $99,750
- Closing costs
- $11,970
- Reserves months
- —
- Total cash needed
- —
Loan-product check · same deal, 3 products live
Conventional
25% down · 7.5% · 30yr
- Down + closing
- —
- Monthly P&I
- —
- Monthly cashflow
- —
- DSCR
- —
- Eligible?
- —
Personal DTI + credit; lowest rate.
DSCR
20% down · 8.5% · 30yr
- Down + closing
- —
- Monthly P&I
- —
- Monthly cashflow
- —
- DSCR
- —
- Eligible?
- —
No personal income docs; deal must DSCR.
Hard money
10% down · 12.0% · 12mo
- Down + closing
- —
- Monthly P&I
- —
- Monthly cashflow
- —
- DSCR
- —
- Eligible?
- —
Short-term bridge; refi at stabilization.
Rent comps 40 comps
| Address | Beds | Baths | Sqft | Rent | $/sqft | DOM | Units | Dist |
|---|---|---|---|---|---|---|---|---|
| 6688 Via Regina Boca Raton, FL | 2.0 | 3.0 | 1985 | $4,500 | $2.27 | 24d | 1 | 0.03mi |
| 6682 Via Regina Boca Raton, FL | 3.0 | 3.0 | 1630 | $3,350 | $2.06 | 12d | 1 | 0.03mi |
| 6817 Via Regina Boca Raton, FL | 3.0 | 2.5 | 1728 | $4,200 | $2.43 | 24d | 1 | 0.03mi |
| 23045 Clear Echo Dr #76 Boca Raton, FL | 3.0 | 2.5 | 2106 | $4,500 | $2.14 | 24d | 1 | 0.05mi |
| 6675 Quiet Wave Trl Boca Raton, FL | 4.0 | 3.5 | 2402 | $6,000 | $2.50 | 4d | 1 | 0.13mi |
| 22954 Clear Echo Dr #29 Boca Raton, FL | 4.0 | 3.5 | 2298 | $4,850 | $2.11 | 24d | 1 | 0.17mi |
| 22954 Clear Echo Dr #29 Boca Raton, FL | 4.0 | 3.5 | 2298 | $4,800 | $2.09 | 4d | 1 | 0.17mi |
| 23330 Torre Cir Boca Raton, FL | 4.0 | 2.5 | 2472 | $5,900 | $2.39 | 24d | 1 | 0.33mi |
| 22864 Marbella Cir Boca Raton, FL | 3.0 | 2.0 | 1872 | $4,500 | $2.40 | 3d | 1 | 0.40mi |
| 6168 La Vida Ter Boca Raton, FL | 3.0 | 3.0 | 2170 | $4,200 | $1.94 | 4d | 1 | 0.51mi |
| 6860 Calle del Paz S Boca Raton, FL | 3.0 | 2.5 | 1895 | $5,300 | $2.80 | 7d | 1 | 0.54mi |
| 6975 Bianchini Cir Boca Raton, FL | 4.0 | 2.5 | 2215 | $5,100 | $2.30 | 11d | 1 | 0.56mi |
| 6075 Glendale Dr Boca Raton, FL | 3.0 | 2.5 | 2260 | $4,100 | $1.81 | 24d | 1 | 0.56mi |
| 6075 Glendale Dr Unit 6075 Boca Raton, FL | 3.0 | 2.5 | 2105 | $3,960 | $1.88 | 16d | 1 | 0.56mi |
| 6875 Calle del Paz S Boca Raton, FL | 3.0 | 2.0 | 1839 | $4,240 | $2.31 | 7d | 1 | 0.57mi |
| 699 Deer Creek Corona Way Deerfield Beach, FL | 3.0 | 2.5 | 1451 | $3,299 | $2.27 | 15d | 1 | 0.58mi |
| 22861 Ironwedge Dr Boca Raton, FL | 3.0 | 2.5 | 2105 | $4,500 | $2.14 | 18d | 1 | 0.59mi |
| 7145 Promenade Dr #702 Boca Raton, FL | 3.0 | 2.5 | 1870 | $4,800 | $2.57 | 10d | 1 | 0.60mi |
| 7194 Promenade Dr Boca Raton, FL | 3.0 | 2.5 | 1870 | $5,150 | $2.75 | 5d | 1 | 0.60mi |
| 7129 Promenade Dr #802 Boca Raton, FL | 3.0 | 2.0 | 1628 | $3,800 | $2.33 | 24d | 1 | 0.60mi |
| 7201 Promenade Dr #302 Boca Raton, FL | 3.0 | 2.5 | 2330 | $5,000 | $2.15 | 24d | 1 | 0.61mi |
| 608 Northshore Dr Unit 608 Deerfield Beach, FL | 2.0 | 2.0 | 1835 | $3,500 | $1.91 | 2d | 1 | 0.63mi |
| 23085 Aqua Vw #3 Boca Raton, FL | 3.0 | 2.5 | 1625 | $3,500 | $2.15 | 24d | 1 | 0.64mi |
| 22655 Camino del Mar Boca Raton, FL | 3.0–5.0 | 2.5–3.0 | 2173 | $4,925 | $2.27 | 2d | 11 | 0.64mi |
| 3008 Deer Creek Lake Shore Dr Deerfield Beach, FL | 2.0 | 2.0 | 1438 | $2,600 | $1.81 | 24d | 1 | 0.69mi |
| 7218 Panache Way Boca Raton, FL | 3.0 | 2.5 | 1614 | $3,900 | $2.42 | 16d | 1 | 0.72mi |
| 7218 Panache Way Boca Raton, FL | 3.0 | 2.5 | 1614 | $3,900 | $2.42 | 4d | 1 | 0.72mi |
| 7323 Panache Way Boca Raton, FL | 4.0 | 2.5 | 2634 | $3,990 | $1.51 | 24d | 1 | 0.72mi |
| 6183 Vista Linda Ln Boca Raton, FL | 4.0 | 3.0 | 2406 | $7,800 | $3.24 | 24d | 1 | 0.73mi |
| 544 NW 38th Ave Deerfield Beach, FL | 3.0 | 2.0 | 1616 | $5,000 | $3.09 | 24d | 1 | 0.83mi |
| 500 Jefferson Dr Deerfield Beach, FL | 1.0–3.0 | 1.0–2.0 | 1142 | $3,554 | $3.11 | 1d | 78 | 0.83mi |
| 7484 La Paz Blvd #101 Boca Raton, FL | 3.0 | 3.0 | 1710 | $4,000 | $2.34 | 24d | 1 | 0.88mi |
| 7582 Regency Lake Dr Boca Raton, FL | 3.0 | 2.5 | 1595 | $4,600 | $2.88 | 15d | 1 | 0.89mi |
| 7296 Via Palomar Boca Raton, FL | 2.0 | 2.0 | 1954 | $4,500 | $2.30 | 24d | 1 | 0.93mi |
| 431 NW 37th Way Deerfield Beach, FL | 3.0 | 2.0 | 1780 | $4,900 | $2.75 | 24d | 1 | 0.95mi |
| 2801 DC Country Club Blvd Deerfield Beach, FL | 3.0 | 2.0 | 1780 | $3,450 | $1.94 | 24d | 1 | 0.97mi |
| 5744 Vista Linda Ln Boca Raton, FL | 4.0 | 4.0 | 2028 | $7,500 | $3.70 | 24d | 1 | 0.97mi |
| 5653 Stradella Dr Boca Raton, FL | 3.0 | 2.5 | 1826 | $5,450 | $2.98 | 4d | 1 | 0.98mi |
| 5653 Stradella Dr Boca Raton, FL | 3.0 | 2.5 | 1826 | $5,450 | $2.98 | 24d | 1 | 0.98mi |
| 5730 Vista Linda Ln Boca Raton, FL | 3.0 | 2.5 | 2946 | $8,000 | $2.72 | 3d | 1 | 0.99mi |
HOA detail condo
- Monthly dues
- $715 · $8,580/yr
- Likely covers
- pool
- Assessments
- None detected in remarks — confirm with the listing agent.
Listing history 8 events
-
2026-05-22status Pending
-
2026-05-15$399,000 Active
-
2004-04-09soldstatus $275,000
-
2003-01-15soldstatus $243,000
-
2003-01-13soldstatus $243,000 212-char remark
Show marketing remark (212 chars)
FABULOUS WIDE LAKE VIEWS FROM THE LARGE TILED PATIO! 3BR/2.5BA, 2-STORY TOWNHOUSE HAS 1 CAR GARAGE, ALL TILED DOWNSTAIRS, NEUTRAL DECOR. LOCATED ON QUIET CUL-DE-SAC & NEAR COMMUNITY POOL. MOVE-IN CONDITION!
-
2002-10-18historical 212-char remark
Show marketing remark (212 chars)
FABULOUS WIDE LAKE VIEWS FROM THE LARGE TILED PATIO! 3BR/2.5BA, 2-STORY TOWNHOUSE HAS 1 CAR GARAGE, ALL TILED DOWNSTAIRS, NEUTRAL DECOR. LOCATED ON QUIET CUL-DE-SAC & NEAR COMMUNITY POOL. MOVE-IN CONDITION!
-
2002-09-30$249,900 212-char remark
Show marketing remark (212 chars)
FABULOUS WIDE LAKE VIEWS FROM THE LARGE TILED PATIO! 3BR/2.5BA, 2-STORY TOWNHOUSE HAS 1 CAR GARAGE, ALL TILED DOWNSTAIRS, NEUTRAL DECOR. LOCATED ON QUIET CUL-DE-SAC & NEAR COMMUNITY POOL. MOVE-IN CONDITION!
-
1988-03-01soldstatus $213,000
ⓘ Source: listings_history table (triggers on properties + properties_extension) + one-shot
backfill from property_details.listing_events for pre-trigger history.
Tax reassessment forecast FL · Resets to sale price
- Current annual tax
- $8,526 · $710/mo
- Projected year-2 tax
- $8,526 · $710/mo
- Expected delta
- $0/yr ($0/mo · 0.0%)
ⓘ Screening estimate from a state-policy table — verify with the county assessor before closing.
Climate risk First Street
- Flood 1/10 Low FEMA zone X (unshaded) · 0% chance over 30 yrs
- Wildfire 1/10 Low
- Heat 9/10 Extreme 7 d/yr ≥107°F today · 27 d/yr by 30 yrs out
- Wind 10/10 Extreme 99% chance of damaging wind over 30 yrs
- Air quality 2/10 Low 1 unhealthy d/yr today · 3 by 30 yrs out
Nearby sold comps map
Loading sold comps map…
Walkable amenities ~0.75 mi
Loading nearby amenities…
Taxation est. · year 1
- Rental income
- $52,575
- − Mortgage interest
- −$22,350
- − Property taxes
- −$8,526
- − Insurance
- −$1,995
- − Repairs & maintenance
- −$4,206
- − Management
- −$4,206
- − HOA
- −$8,580
- − Depreciation
- −$11,607
- Taxable loss
- −$8,896
- Est. tax savings @ 24.0%
- +$2,135
- After-tax cash flow
- $-541/yr
For passive investors: Depreciation is non-cash, so a rental often shows a tax loss while cash-flowing — sheltering income. Rental losses are passive: they offset passive income freely, and up to $25,000/yr can offset ordinary (W-2) income if you actively participate and your MAGI is under $100k (phasing out to $0 by $150k); unused losses carry forward. On sale, claimed depreciation is recaptured at up to 25%, and gains may owe capital-gains tax (a 1031 exchange can defer both). Figures are a year-1 estimate at your 24.0% rate — not tax advice; consult a CPA.
Schools (NCES district)
- District
- Palm Beach
- NCES district ID
- 1201500
- Math proficiency
- 46% ▼ -16.00%
- Reading proficiency
- 53% ▼ -4.00%
- Median HH income
- $53,943
- Composite
- 42.72/100
- National rank
- #3160
- State rank
- #34 of 73 in FL
Livability — Deerfield Beach
- Score
- 75/100
- State rank
- #250
- US rank
- #3970
Category grades
Schools grade is shown separately in the Schools card above.
Census & demographics
- County
- Palm Beach County · 1,438,312 people
- City population
- 61,449
- Metro
- Miami-Fort Lauderdale-Pompano Beach, FL
- Population (ZIP)
- 47,005
- Household income
- $84,091
- Rent vs Own
- Severe rent burden
- 2900.0
Population outlook (Palm Beach County) Hauer SSP2
- Today (2025)
- 1,637,487 people
- By 2030
- 1,743,255 · +6.5%
- By 2040
- 1,948,712 · +19.0%
- By 2050
- 2,132,979 · +30.3%
- By 2075
- 2,530,027 · +54.5%
- By 2100
- 2,706,979 · +65.3%
Race, ethnicity, and origin ACS 2023
- Neighborhood character
- Predominantly White (68%)
- Race & ethnicity
- White 68% Hispanic / Latino 18% Two or more races 15% Asian 4% Black 2%
- Hispanic origin (detail)
- Mexican 1% Puerto Rican 2% Cuban 2% Dominican 1%
- Common ancestry
- Romanian 6% Scotch-Irish 5% Russian 3%
- Foreign-born
- 27% · Canada, Jamaica, China
- Languages at home
- 65% English-only · Spanish 15% Other Indo-European 10% Russian/Polish/Slavic 3%
Political lean MEDSL · Palm Beach
- 2024 margin
- Toss-up / Even · D 50.0% · R 49.2%
- 2008→2024 swing
- -22.1pp toward R · 2008: 22.9pp · 2024: 0.8pp
- All cycles
- 2024: D+0.8 2020: D+12.8 2016: D+15.3 2012: D+17.0 2008: D+22.9
Not yet ingested
- Civics
- —
Market trends
- HPI YoY
- ▼ -227.85%
- Current HPI
- 306.738
- Rent YoY
- ▲ 0.33%
- Metro
- Miami-Fort Lauderdale-Pompano Beach, FL
- State GDP YoY
- ▲ 3.28%
- F500 in state
- 36
Industry mix (Fortune 500 HQ in FL)
| Industry | F500 HQs | Revenue |
|---|---|---|
| Industrial Technology | 2 | $29B |
|
||
| Insurance | 2 | $17B |
|
||
| Retail | 1 | $60B |
|
||
| Technology Distribution | 1 | $58B |
|
||
| Homebuilding | 1 | $35B |
|
||
| Technology Manufacturing | 1 | $35B |
|
||
Price history
+87.3% since first listed8 events — show timeline
- 2026-05-22 Pending — Beaches MLS
- 2026-05-15 Listed $399,000 Beaches MLS
- 2004-04-09 Sold (Public Records) $275,000 Public Records
- 2003-01-15 Sold (Public Records) $243,000 Public Records
- 2003-01-13 Sold (MLS) $243,000 Beaches MLS
- 2002-10-18 Listing Removed — Beaches MLS
- 2002-09-30 Listed $249,900 Beaches MLS
- 1988-03-01 Sold (Public Records) $213,000 Public Records
Property tax history
+7.8%/yrLatest (2025): $8,526 · +147.8% YoY. Source: county tax records.
Cash-flow waterfall
monthlySold comps — $/sqft
last 12 mo · ≤1 miLoading sold comps…