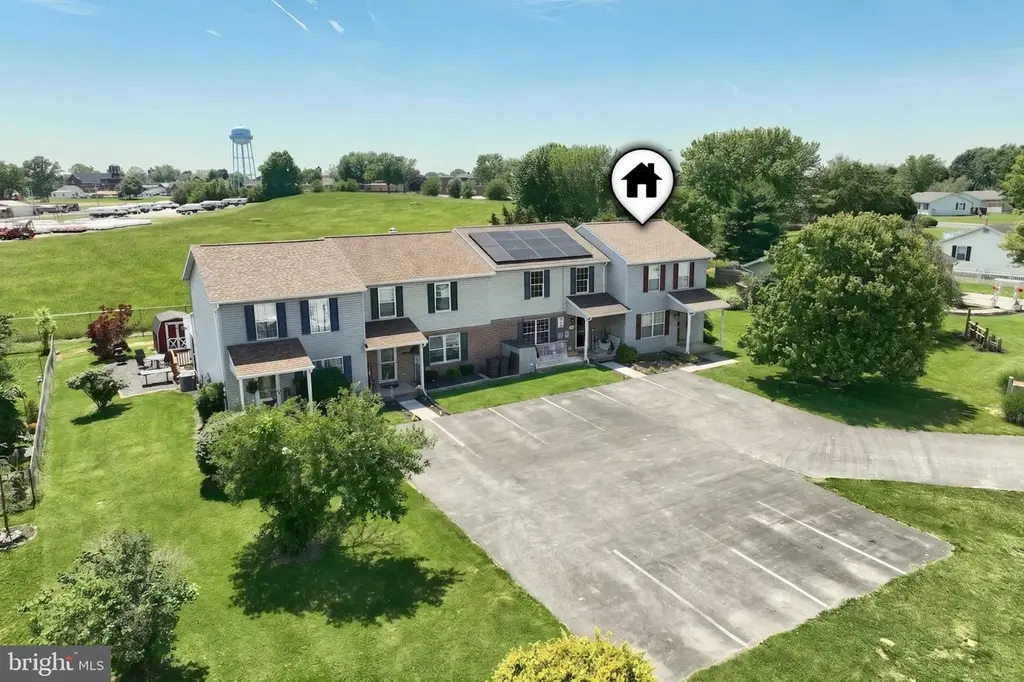
112 Billerbeck St · Oxford, PA
Flood risk 1/10 · Minimal
- FEMA flood zone
- X (unshaded)
- Chance of flooding over 30 yrs
- 0.0%
- Est. flood insurance / yr
- $473 – $860
Fire risk 1/10 · Minimal
- Est. fire insurance / yr
- $511 – $949
Heat risk 5/10 · Moderate
- Hot days now (above 101°F)
- 7 days/yr
- Hot days in 30 yrs
- 15 days/yr
Wind risk 4/10 · Minor
- Chance of severe wind over 30 yrs
- 8.0%
Air-quality risk 3/10 · Minor
- Unhealthy air days now
- 2 days/yr
- Unhealthy air days in 30 yrs
- 4 days/yr
Risk factors via First Street. Map © Google.
Why this score? — see what drove the D- grade
The composite is a weighted blend of 9 inputs, each scored 0–100. Each bar is that input's sub-score; the figure is the points it added to the 100-point composite (weight × sub-score).
- Cash flow +14.7/30.0
- DSCR +4.5/10.0
- Schools +4.1/10.0
- 1% rule +4.0/10.0
- Livability +3.4/5.0
- ARV discount +2.9/15.0
- Rent growth +2.5/5.0
- Condition / age +2.5/5.0
- Appreciation +0.0/10.0
$215,000
🖨 Deal sheet (PDF) 📄 Offer letter ✓ Due diligence
Listing remarks MLS
Like new 2 bedroom, 1 1/2 bath end unit townhome with finished basement. Tastefully decorated with laminate flooring in kitchen and foyer area. Large main bath and 1/2 bath on 1st floor. Fenced in yard and rear deck.
Key facts
- Built 1997
- Listed 13 days
Property features AI
Exterior
- Parking: Off-street parking
- Utilities: Public water; Public sewer; Electric cooling fuel; Natural gas heating fuel
- Home design: Interior townhouse/rowhouse; Fee simple ownership; Good condition
- Construction: Vinyl siding; Block foundation; Asphalt shingle roof; Estimated year built
- Exterior features: Level lot; Chain link fencing; Deck(s)
Interior
- Kitchen: Dishwasher; Single oven; Refrigerator
- Bedrooms: Two bedrooms on the upper level
- Bathrooms: One full bathroom on the upper level; One half bathroom on the main level
- Heating & cooling: Forced air heating (natural gas); Central air conditioning; Electric hot water
- Interior features: Eat-in kitchen; Full basement with additional space (other)
Neighborhood map
What this means for you Summary
Snapshot
- This is a 2-bed/1.5-bath townhouse listed at $215k.
Deal economics
- At list price, monthly cash flow is $56 ($667/yr) — positive.
- The deal already cash-flows at list — no discount required.
- To meet the 1% rule (rent ≥ 1% of price), the offer needs to be $194k (9.7% below list).
- Recommended offer: $194k (9.7% below list) — sets the bar for 1% rule.
- Cap rate 6.6% vs local median 2.1% in Oxford — top-decile yield for the area; either an underpriced asset or a hidden risk that comps aren't pricing in. Stress-test before assuming the spread holds.
Location & tenants
- Location reads 67/100 on livability (#999 in PA) — a middle-class / working-renter tenant base. Strengths: health & safety A+, cost of living A, housing A; Watch: employment D, amenities F, commute F.
- Conewago Valley SD (suburban): math 39% / reading 56% proficiency, ranked #215 of 539 in PA (top 40%) — families likely to look elsewhere, expect single-tenant / working-renter base with shorter leases.
- Zoned schools: New Oxford El Sch (math 52% / reading 62%, grade C+, #444 of 1,518 statewide, top 32%, 563 students, 52% FRL); Conewago Valley Intrmd Sch (math 38% / reading 57%, grade C-, #156 of 512 statewide, top 32%, 850 students, 46% FRL); New Oxford Shs (math 80% / reading 10%, grade D-, #192 of 437 statewide, top 44%, 1,249 students, 39% FRL).
- Market conditions: 54 active listings in the ZIP; 403 units permitted in Adams County in 2024 (0 in 5+ unit buildings).
Forward outlook
- Local home prices are declining (-3.0%/yr); year-one equity from $1k of loan paydown is wiped out by about $6k of value loss. Plan a longer hold.
- Adams County population projected at -10% by 2050 — secular population decline; favor cash flow + early exit over multi-decade hold.
Negotiation context
- Only 13 days on market — expect competitive offers; lowballing is unlikely to land.
- 2 sale attempts since 20y ago with the ask held roughly flat each time — persistent listings suggest the price (not the market) is what's stuck; bring a comps-based counter.
- Current owner paid $151k; 42% above their basis — modest negotiation headroom, anchor on the comps not their cost.
Risks & watch-outs
- Climate carrying-cost: extreme-heat days projected 7→15/yr by 2055 (HVAC capex compounding) — expect insurance premiums to compound above CPI over the hold.
Questions for the listing agent
- Is there a deadline driving the sale (1031 exchange, divorce, estate, relocation)? That informs how much negotiation room exists.
- The area grade is low — what's the realistic commute time and amenity access for the typical tenant pool here? Any planned neighborhood developments (good or bad) we should know about?
- What's the average days-on-market for RENTAL listings here right now (not sales)? A rising rental-DOM trend means longer vacancies and softer asking-rent achievability than the comps imply.
- What's the recent tenant-quality profile in this submarket — average credit score on applications, eviction rate, late-payment / NSF rate, and stable-employment percentage? A property-management company in the area should have these aggregated.
- How much new for-sale + rental construction is in the pipeline within 1–3 miles? Heavy new supply typically softens prices + rents 12–24 months out; constrained supply supports both.
Investment metrics
- 1% rule
- 0.90% ✗
- Cap rate
- 6.60%
- Cash-on-cash
- 1.11%
- DSCR
- 1.05
- GRM
- 9.2
CMA / ARV
- ARV (on-the-fly)
- $194,880
- Comps found
- 5
Show comp detail 5 sales within ~0.75 mi
| Address | Dist | Beds/Ba | Sqft | Sold | Price | $/sf | Match |
|---|---|---|---|---|---|---|---|
| 25 Commerce St | 0.26mi | 3/1.5 (+1) | 1,152 (+3%) | 5mo | $199,900 | $174 | 74 |
| 12 Fiddler Dr | 0.57mi | 3/2.0 (+1) | 1,144 (+2%) | 6mo | $200,000 | $175 | 58 |
| 41 Fiddler Dr | 0.59mi | 3/2.0 (+1) | 1,140 (+2%) | 13mo | $210,000 | $184 | 52 |
| 1 Oxford Ct | 0.64mi | 3/2.0 (+1) | 1,240 (+11%) | 5mo | $190,000 | $153 | 41 |
| 4 Oxford Ct | 0.67mi | 2/2.0 | 983 (-12%) | 7mo | $169,900 | $173 | 40 |
Match score weights: distance 35% · size 25% · config 20% · recency 20%. Top-matched comps best support the ARV.
Projected returns pro-forma
-3.0% appreciation · 3.0% rent growth · sell at horizon
- IRR
- -14.5%
- Equity multiple
- 0.48×
- Total profit
- $-31,273
- Equity at exit
- $32,057
- IRR
- -5.8%
- Equity multiple
- 0.63×
- Total profit
- $-22,570
- Equity at exit
- $18,589
Cash invested: $60,200 (down + closing). Projections, not guarantees.
Landlord ↔ Tenant lean methodology
- Overall (STATE)
- 62 Landlord-Friendly
- State Pennsylvania
- 62 Landlord-Friendly · EVEN
- County
- — inherits STATE
- City
- — inherits STATE
ZIP-level market 17350
- Home prices YoY
- -20.7%
- Active inventory
- 54
- Price-to-rent
- 9.2×
Monthly cashflow live
- Estimated rent
- $1,942 medium interval (Pro) →
- Mortgage (P&I)
- −$1,127
- Tax from tax record
- −$262 /mo · $3,139/yr
- Insurance
- −$90
- HOA
- −$0
- Vacancy / Maint / Mgmt
- −$408
- Net cashflow
- $56
Break-even live
Sensitivity live
| Price | -10% $177 | -5% $116 | +0% $56 | +5% $-5 | +10% $-66 |
|---|---|---|---|---|---|
| Rent | -10% $-98 | -5% $-21 | +0% $56 | +5% $132 | +10% $209 |
| Rate | -1.0pp $164 | -0.5pp $110 | base $56 | +0.5pp $0 | +1.0pp $-57 |
UW: 25.0% down · 7.5% · 30yr · 1.5% tax · 5.0% vac · 8.0% maint · 8.0% mgmt
Financing live
Cash to close
- Down payment
- $53,750
- Closing costs
- $6,450
- Reserves months
- —
- Total cash needed
- —
Loan-product check · same deal, 3 products live
Conventional
25% down · 7.5% · 30yr
- Down + closing
- —
- Monthly P&I
- —
- Monthly cashflow
- —
- DSCR
- —
- Eligible?
- —
Personal DTI + credit; lowest rate.
DSCR
20% down · 8.5% · 30yr
- Down + closing
- —
- Monthly P&I
- —
- Monthly cashflow
- —
- DSCR
- —
- Eligible?
- —
No personal income docs; deal must DSCR.
Hard money
10% down · 12.0% · 12mo
- Down + closing
- —
- Monthly P&I
- —
- Monthly cashflow
- —
- DSCR
- —
- Eligible?
- —
Short-term bridge; refi at stabilization.
Listing history 9 events
-
2026-06-22pricedays on market $215,000 Active 13 DOM
-
2026-06-18days on market $225,000 Active 10 DOM
-
2026-06-17days on market $225,000 Active 9 DOM
-
2026-06-16days on market $225,000 Active 8 DOM
-
2026-06-15days on market $225,000 Active 7 DOM
-
2026-06-14days on market $225,000 Active 5 DOM
-
2026-06-13days on market $225,000 Active 4 DOM
-
2026-06-10days on market $225,000 Active 2 DOM
-
2026-06-09$225,000 Active 1 DOM
ⓘ Source: listings_history table (triggers on properties + properties_extension) + one-shot
backfill from property_details.listing_events for pre-trigger history.
Tax reassessment forecast PA · Partial reset (capped growth)
- Current annual tax
- $3,139 · $262/mo
- Projected year-2 tax
- $3,268 · $272/mo
- Expected delta
- +$129/yr (+$11/mo · 4.1%)
ⓘ Screening estimate from a state-policy table — verify with the county assessor before closing.
Climate risk First Street
- Flood 1/10 Low FEMA zone X (unshaded) · 0% chance over 30 yrs
- Wildfire 1/10 Low
- Heat 5/10 Major 7 d/yr ≥101°F today · 15 d/yr by 30 yrs out
- Wind 4/10 Moderate 8% chance of damaging wind over 30 yrs
- Air quality 3/10 Moderate 2 unhealthy d/yr today · 4 by 30 yrs out
Nearby sold comps map
Loading sold comps map…
Walkable amenities ~0.75 mi
Loading nearby amenities…
Taxation est. · year 1
- Rental income
- $23,305
- − Mortgage interest
- −$12,043
- − Property taxes
- −$3,139
- − Insurance
- −$1,075
- − Repairs & maintenance
- −$1,864
- − Management
- −$1,864
- − Depreciation
- −$6,255
- Taxable loss
- −$2,936
- Est. tax savings @ 24.0%
- +$705
- After-tax cash flow
- $1,372/yr
For passive investors: Depreciation is non-cash, so a rental often shows a tax loss while cash-flowing — sheltering income. Rental losses are passive: they offset passive income freely, and up to $25,000/yr can offset ordinary (W-2) income if you actively participate and your MAGI is under $100k (phasing out to $0 by $150k); unused losses carry forward. On sale, claimed depreciation is recaptured at up to 25%, and gains may owe capital-gains tax (a 1031 exchange can defer both). Figures are a year-1 estimate at your 24.0% rate — not tax advice; consult a CPA.
Schools (NCES district)
- District
- Conewago Valley SD
- NCES district ID
- 4206550
- Math proficiency
- 39% ▼ -15.00%
- Reading proficiency
- 56% ▼ -11.00%
- Median HH income
- $54,603
- Composite
- 41.08/100
- National rank
- #3572
- State rank
- #215 of 539 in PA
Livability — Oxford
- Score
- 67/100
- State rank
- #999
- US rank
- #10995
Category grades
Schools grade is shown separately in the Schools card above.
Census & demographics
- City population
- 17,929
- Population (ZIP)
- 13,219
Population outlook (Adams County) Hauer SSP2
- Today (2025)
- 102,494 people
- By 2030
- 101,890 · -0.6%
- By 2040
- 98,417 · -4.0%
- By 2050
- 92,014 · -10.2%
- By 2075
- 76,128 · -25.7%
- By 2100
- 58,931 · -42.5%
Race, ethnicity, and origin ACS 2023
- Neighborhood character
- Predominantly White (89%)
- Race & ethnicity
- White 89% Hispanic / Latino 10% Two or more races 3%
- Hispanic origin (detail)
- Mexican 6% Puerto Rican 4%
- Common ancestry
- Slovak 2% Lithuanian 2% Romanian 1%
- Foreign-born
- 3% · Canada
- Languages at home
- 92% English-only · Spanish 7%
Political lean MEDSL · Adams
- 2024 margin
- Solid R (+33.6) · D 32.7% · R 66.4%
- 2008→2024 swing
- -14.1pp toward R · 2008: -19.6pp · 2024: -33.6pp
- All cycles
- 2024: R+33.6 2020: R+34.1 2016: R+36.4 2012: R+27.6 2008: R+19.6
Not yet ingested
- Civics
- —
Market trends
- HPI YoY
- ▼ -76.47%
- Current HPI
- 293.6445
- Rent YoY
- —
- Metro
- —
- State GDP YoY
- ▲ 1.68%
- F500 in state
- 34
Industry mix (Fortune 500 HQ in PA)
| Industry | F500 HQs | Revenue |
|---|---|---|
| Healthcare | 2 | $309B |
|
||
| Insurance | 2 | $27B |
|
||
| Telecommunications / Media | 1 | $124B |
|
||
| Industrial Distribution | 1 | $22B |
|
||
| Financial Services | 1 | $20B |
|
||
| Chemicals / Materials | 1 | $18B |
|
||
Price history
+49.0% since first listed4 events — show timeline
- 2026-06-08 Listed $225,000 BRIGHT MLS
- 2006-12-19 Sold (Public Records) $151,000 Public Records
- 2006-12-18 Sold (MLS) $151,000 BRIGHT MLS
- 2006-09-14 Listed $151,000 BRIGHT MLS
Property tax history
+3.5%/yrLatest (2026): $3,139 · +1.9% YoY. Source: county tax records.
Cash-flow waterfall
monthlySold comps — $/sqft
last 12 mo · ≤1 miLoading sold comps…