550 N Lasalle St · Indianapolis city (balance), IN
Flood risk 7/10 · Major
- FEMA flood zone
- X (unshaded)
- Chance of flooding over 30 yrs
- 0.76%
- Est. flood insurance / yr
- $507 – $1,088
Fire risk 1/10 · Minimal
- Est. fire insurance / yr
- $717 – $1,331
Heat risk 4/10 · Minor
- Hot days now (above 102°F)
- 7 days/yr
- Hot days in 30 yrs
- 19 days/yr
Wind risk 2/10 · Minimal
- Chance of severe wind over 30 yrs
- 1.0%
Air-quality risk 4/10 · Minor
- Unhealthy air days now
- 5 days/yr
- Unhealthy air days in 30 yrs
- 7 days/yr
Risk factors via First Street. Map © Google.
Why this score? — see what drove the B grade
The composite is a weighted blend of 9 inputs, each scored 0–100. Each bar is that input's sub-score; the figure is the points it added to the 100-point composite (weight × sub-score).
- Cash flow +30.0/30.0
- ARV discount +15.0/15.0
- 1% rule +10.0/10.0
- DSCR +10.0/10.0
- Rent growth +4.3/5.0
- Livability +2.5/5.0
- Schools +1.4/10.0
- Condition / age +1.0/5.0
- Appreciation +0.0/10.0
$53,900
🖨 Deal sheet 📄 Offer letter ✓ Due diligence
Listing remarks MLS
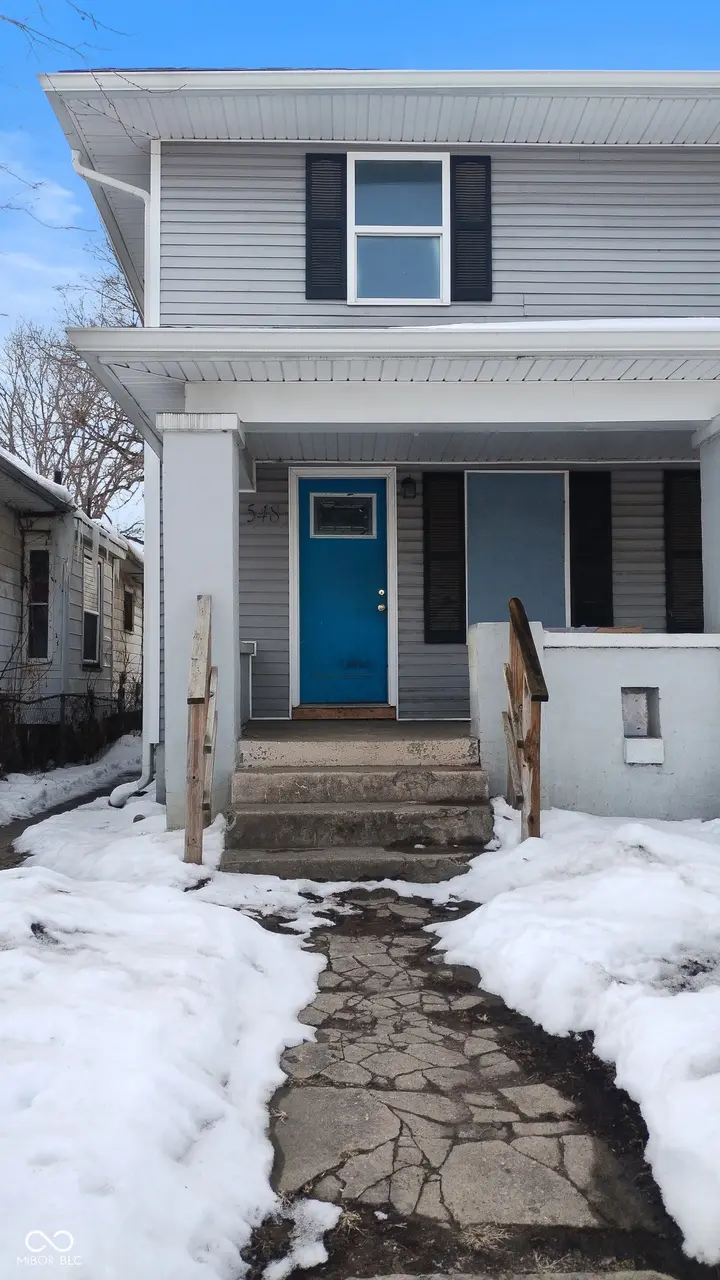
At 550 N Lasalle ST, INDIANAPOLIS a distinctive Fannie Mae HomePath condominium presents a remarkable opportunity for discerning investors and those seeking to personalize their living space. This property stands as a great investment option, inviting those with vision to explore its potential. The three bedrooms provide versatile arrangements for rest, creative pursuits, or dedicated workspaces, each offering a private retreat within the home. A single full bathroom is thoughtfully appointed, ensuring convenience and comfort for daily routines. Encompassing 1304 square feet of living area, this condominium offers generous proportions, allowing for comfortable daily living and entertaining. Spanning two stories, the interior design thoughtfully separates distinct living zones, enhancing both privacy and practical arrangement. Constructed in 1920, this residence embodies a timeless architectural presence, offering a unique foundation for contemporary enhancements. An inviting porch extends an opportunity for tranquil outdoor moments, providing a pleasant setting for relaxation or greeting the day. This condominium represents a compelling prospect for those ready to shape a truly exceptional urban residence or capitalize on a promising investment.
Key facts
- Built 1920
- Listed 39 days
Neighborhood map
What this means for you Summary
Snapshot
- This is a 3-bed/1.0-bath condo listed at $54k. Condition is rated poor.
Deal economics
- At list price, monthly cash flow is $580 ($7k/yr) — positive.
- The deal already cash-flows at list — no discount required.
- Meets the 1% rule at list price ($1k rent vs $54k).
- Recommended offer: $52k (3.0% below list) — sets the bar for market timing.
- Cap rate 20.7% vs local median 4.4% in Indianapolis city (balance) — top-decile yield for the area; either an underpriced asset or a hidden risk that comps aren't pricing in. Stress-test before assuming the spread holds.
Location & tenants
- Location reads: area grade B — affects rentability + tenant quality, not the cash-flow math above.
- Indianapolis Public Schools (urban): math 14% / reading 20% proficiency, ranked #286 of 301 in IN (top 95%) — low school quality limits family demand, transient renter base, plan for 1-2y turnover; 77% free/reduced lunch — lower-income household profile, screen leases tightly.
- Market conditions: Rents rising fast (+7.3%/yr); 480 active listings in the ZIP; 40 comparable units currently listed for rent nearby; rentals lingering (median 44d on market — plan ~5-8 weeks vacancy on turnover, expect pricing pressure); 50% of comp listings sitting > 30 days — soft ceiling on asking rent; 1,906 units permitted in Marion County in 2024 (621 in 5+ unit buildings).
- This rent runs 35% of the median local income ($49k/yr) — at the standard rent-burdened threshold; future hikes will face affordability resistance.
Forward outlook
- Local home prices are declining (-3.0%/yr); year-one equity from $373 of loan paydown is wiped out by about $2k of value loss. Plan a longer hold.
- Marion County population projected at +18% by 2050 — long-run rental-demand tailwind backs the buy-and-hold thesis.
- At projected returns (-3.0% appreciation + 7.3% rent growth), your $15k cash investment doubles in ~3 years — after that, you're playing with house money.
Negotiation context
- It's been on market 39 days — a 3% lower offer ($52k) is reasonable based on typical stale-listing flexibility.
Risks & watch-outs
- Watch-outs: property tax is 4.3% of price; flood insurance adds $66/mo; built in 1920 — expect roof / HVAC / electrical / plumbing capex.
- Climate carrying-cost: major flood risk — expect insurance premiums to compound above CPI over the hold.
Questions for the listing agent
- It's been on market 39 days. Have you received any prior offers? Is the seller open to a 3% concession, seller financing, or rate buy-down credit?
- Have any recent inspections been done? Can we get a copy of the seller's disclosures and any deferred-maintenance estimates?
- Built in 1920 — when were the roof, HVAC, electrical panel, plumbing, and water heater last replaced?
- Property tax is high relative to price — has the assessment been appealed recently, and will the sale trigger a re-assessment?
- What's the actual annual flood-insurance premium (NFIP or private), and is the property in a SFHA with mandatory coverage?
- Any open or pending special assessments — roof, HVAC, plumbing, elevator, façade? What's the per-unit balance and payoff schedule, and is the seller paying it off at close or rolling it to the buyer?
- Is there a deadline driving the sale (1031 exchange, divorce, estate, relocation)? That informs how much negotiation room exists.
- What's the average days-on-market for RENTAL listings here right now (not sales)? A rising rental-DOM trend means longer vacancies and softer asking-rent achievability than the comps imply.
- What's the recent tenant-quality profile in this submarket — average credit score on applications, eviction rate, late-payment / NSF rate, and stable-employment percentage? A property-management company in the area should have these aggregated.
- How much new apartment / multifamily construction is in the pipeline within 1–3 miles? Heavy new supply (>2% of stock underway) typically softens rents 12–24 months out; light construction supports rent growth.
Investment metrics
- 1% rule
- 2.69% ✓
- Cap rate
- 20.68%
- Cash-on-cash
- 51.40%
- DSCR
- 3.29
- GRM
- 3.1
CMA / ARV
- ARV (median comp)
- $95,000
- List price
- $53,900
- Delta
- -43.26%
- Verdict
- UNDERPRICED
- Comps
- 17 within 1.0 mi
Projected returns pro-forma
-3.0% appreciation · 7.31% rent growth · sell at horizon
- IRR
- 49.2%
- Equity multiple
- 3.31×
- Total profit
- $34,893
- Equity at exit
- $8,037
- IRR
- 56.8%
- Equity multiple
- 8.15×
- Total profit
- $107,902
- Equity at exit
- $4,660
Cash invested: $15,092 (down + closing). Projections, not guarantees.
Landlord ↔ Tenant lean methodology
- Overall (STATE)
- 90 Strongly Landlord-Friendly
- State Indiana
- 90 Strongly Landlord-Friendly · R+11
- County
- — inherits STATE
- City
- — inherits STATE
ZIP-level market 46201
- Home prices YoY
- -33.9%
- Rents YoY
- 7.3%
- Active inventory
- 480
- Price-to-rent
- 3.1×
Monthly cashflow live
- Estimated rent
- $1,448 high interval (Pro) →
- Mortgage (P&I)
- −$283
- Tax from tax record
- −$192 /mo · $2,309/yr
- Insurance
- −$22
- Flood insurance flood zone
- −$66 /mo · $798/yr
- HOA
- −$0
- Vacancy / Maint / Mgmt
- −$304
- Net cashflow
- $580
Break-even live
UW: 25.0% down · 7.5% · 30yr · 1.5% tax · 5.0% vac · 8.0% maint · 8.0% mgmt
Financing live
Cash to close
- Down payment
- $13,475
- Closing costs
- $1,617
- Reserves months
- —
- Total cash needed
- —
Loan-product check · same deal, 3 products live
Conventional
25% down · 7.5% · 30yr
- Down + closing
- —
- Monthly P&I
- —
- Monthly cashflow
- —
- DSCR
- —
- Eligible?
- —
Personal DTI + credit; lowest rate.
DSCR
20% down · 8.5% · 30yr
- Down + closing
- —
- Monthly P&I
- —
- Monthly cashflow
- —
- DSCR
- —
- Eligible?
- —
No personal income docs; deal must DSCR.
Hard money
10% down · 12.0% · 12mo
- Down + closing
- —
- Monthly P&I
- —
- Monthly cashflow
- —
- DSCR
- —
- Eligible?
- —
Short-term bridge; refi at stabilization.
Rent comps 40 comps
| Address | Beds | Baths | Sqft | Rent | $/sqft | DOM | Units | Dist |
|---|---|---|---|---|---|---|---|---|
| 510 N Dearborn St Indianapolis, IN | 3.0 | 1.0 | 1008 | $1,350 | $1.34 | 43d | 1 | 0.09mi |
| 637 N Gray St Indianapolis, IN | 3.0 | 1.5 | 1120 | $1,150 | $1.03 | 44d | 1 | 0.13mi |
| 639 N Gray St Indianapolis, IN | 3.0 | 1.5 | 1120 | $1,220 | $1.09 | 43d | 1 | 0.13mi |
| 632 N Gray St Indianapolis, IN | 3.0 | 1.0 | 960 | $1,800 | $1.88 | 43d | 1 | 0.14mi |
| 430 N Dearborn St Indianapolis, IN | 3.0 | 1.0 | 1128 | $1,300 | $1.15 | 43d | 1 | 0.17mi |
| 840 N Lasalle St Indianapolis, IN | 3.0 | 1.0 | 1215 | $1,100 | $0.91 | 23d | 1 | 0.18mi |
| 408 N Dearborn St Indianapolis, IN | 3.0 | 2.5 | 1740 | $1,750 | $1.01 | 43d | 1 | 0.21mi |
| 818 N Oakland Ave Unit 46201 Indianapolis, IN | 3.0 | 1.5 | 1332 | $1,550 | $1.16 | 43d | 1 | 0.24mi |
| 909 N Lasalle St Indianapolis, IN | 3.0 | 2.0 | 1717 | $1,600 | $0.93 | 44d | 1 | 0.24mi |
| 409 N Oakland Ave Unit 411 Indianapolis, IN | 3.0 | 2.0 | 1300 | $1,495 | $1.15 | 43d | 1 | 0.25mi |
| 2903 E Michigan St Indianapolis, IN | 3.0 | 2.0 | 1310 | $1,650 | $1.26 | 14d | 1 | 0.26mi |
| 849 N Oakland Ave Indianapolis, IN | 4.0 | 3.0 | 1638 | $2,350 | $1.43 | 12d | 1 | 0.26mi |
| 408 N Oakland Ave Unit A Indianapolis, IN | 2.0 | 2.0 | 1100 | $995 | $0.90 | 17d | 1 | 0.27mi |
| 933 N Dearborn St Indianapolis, IN | 3.0 | 1.5 | 1204 | $1,500 | $1.25 | 43d | 1 | 0.28mi |
| 515 N Oxford St Indianapolis, IN | 2.0 | 1.5 | 1728 | $1,050 | $0.61 | 3d | 1 | 0.29mi |
| 645 N Oxford St Indianapolis, IN | 4.0 | 1.5 | 1344 | $1,500 | $1.12 | 23d | 1 | 0.30mi |
| 253 N Gray St Indianapolis, IN | 3.0 | 1.5 | 1176 | $1,660 | $1.41 | 7d | 1 | 0.32mi |
| 2814 E Michigan St Unit D Indianapolis, IN | 2.0 | 1.5 | 949 | $1,350 | $1.42 | 43d | 1 | 0.34mi |
| 953 N Tuxedo St Indianapolis, IN | 3.0 | 1.0 | 1200 | $950 | $0.79 | 23d | 1 | 0.34mi |
| 2810 E Michigan St Unit C Indianapolis, IN | 2.0 | 1.5 | 949 | $1,350 | $1.42 | 43d | 1 | 0.34mi |
| 619 N Rural St Indianapolis, IN | 3.0 | 2.0 | 1300 | $1,600 | $1.23 | 23d | 1 | 0.35mi |
| 639 N Rural St Indianapolis, IN | 3.0 | 1.0 | 1000 | $1,675 | $1.68 | 17d | 1 | 0.35mi |
| 613-615 N Jefferson Indianapolis, IN | 3.0 | 1.0 | 1030 | $1,600 | $1.55 | 14d | 1 | 0.36mi |
| 3101 E 10th St #301 Indianapolis, IN | 2.0 | 1.0 | 921 | $1,195 | $1.30 | 43d | 1 | 0.39mi |
| 849 N Rural St Unit 849 Indianapolis, IN | 3.0 | 2.5 | 1300 | $2,000 | $1.54 | 43d | 1 | 0.40mi |
| 851 N Rural St Indianapolis, IN | 3.0 | 2.5 | 1300 | $1,700 | $1.31 | 23d | 1 | 0.41mi |
| 1018 N Tuxedo St Unit 1016 Indianapolis, IN | 3.0 | 1.5 | 1250 | $1,099 | $0.88 | 43d | 1 | 0.41mi |
| 83 N Ewing St Unit 83 Indianapolis, IN | 3.0 | 1.0 | 1016 | $1,199 | $1.18 | 43d | 1 | 0.41mi |
| 3030 E 10th St Indianapolis, IN | 2.0 | 1.0 | 950 | $900 | $0.95 | 21d | 1 | 0.42mi |
| 852 N Rural St Indianapolis, IN | 2.0 | 1.5 | 1528 | $1,300 | $0.85 | 23d | 1 | 0.43mi |
| 603 N Sherman Dr Indianapolis, IN | 3.0 | 1.0 | 1250 | $1,300 | $1.04 | 43d | 1 | 0.43mi |
| 447 N Sherman Dr Indianapolis, IN | 3.0 | 1.5 | 1312 | $1,195 | $0.91 | 43d | 1 | 0.44mi |
| 418 Eastern Ave Indianapolis, IN | 3.0 | 1.0 | 1008 | $1,325 | $1.31 | 23d | 1 | 0.46mi |
| 20 N Gray St Indianapolis, IN | 3.0 | 2.0 | 1300 | $1,800 | $1.38 | 43d | 1 | 0.47mi |
| 1015 N Gale St Indianapolis, IN | 3.0 | 2.0 | 1200 | $1,550 | $1.29 | 14d | 1 | 0.47mi |
| 313 Eastern Ave Indianapolis, IN | 2.0 | 1.0 | 1040 | $950 | $0.91 | 21d | 1 | 0.48mi |
| 3712 E Market St Indianapolis, IN | 3.0 | 1.0 | 1800 | $1,450 | $0.81 | 14d | 1 | 0.48mi |
| 822 N Bradley Ave Unit 822 Indianapolis, IN | 3.0 | 1.0 | 1100 | $1,200 | $1.09 | 43d | 1 | 0.49mi |
| 1036 N Parker Ave Indianapolis, IN | 4.0 | 2.0 | 1342 | $1,745 | $1.30 | 4d | 1 | 0.49mi |
| 1038 N Parker Ave Indianapolis, IN | 4.0 | 2.0 | 1342 | $1,745 | $1.30 | 4d | 1 | 0.49mi |
HOA detail condo
- Monthly dues
- $0 · $0/yr
- Assessments
- None detected in remarks — confirm with the listing agent.
Listing history 2 events
-
2026-05-09status Pending 1268-char remark
Show marketing remark (1268 chars)
At 550 N Lasalle ST, INDIANAPOLIS a distinctive Fannie Mae HomePath condominium presents a remarkable opportunity for discerning investors and those seeking to personalize their living space. This property stands as a great investment option, inviting those with vision to explore its potential. The three bedrooms provide versatile arrangements for rest, creative pursuits, or dedicated workspaces, each offering a private retreat within the home. A single full bathroom is thoughtfully appointed, ensuring convenience and comfort for daily routines. Encompassing 1304 square feet of living area, this condominium offers generous proportions, allowing for comfortable daily living and entertaining. Spanning two stories, the interior design thoughtfully separates distinct living zones, enhancing both privacy and practical arrangement. Constructed in 1920, this residence embodies a timeless architectural presence, offering a unique foundation for contemporary enhancements. An inviting porch extends an opportunity for tranquil outdoor moments, providing a pleasant setting for relaxation or greeting the day. This condominium represents a compelling prospect for those ready to shape a truly exceptional urban residence or capitalize on a promising investment.
-
2026-03-31$53,900 Active 1268-char remark
Show marketing remark (1268 chars)
At 550 N Lasalle ST, INDIANAPOLIS a distinctive Fannie Mae HomePath condominium presents a remarkable opportunity for discerning investors and those seeking to personalize their living space. This property stands as a great investment option, inviting those with vision to explore its potential. The three bedrooms provide versatile arrangements for rest, creative pursuits, or dedicated workspaces, each offering a private retreat within the home. A single full bathroom is thoughtfully appointed, ensuring convenience and comfort for daily routines. Encompassing 1304 square feet of living area, this condominium offers generous proportions, allowing for comfortable daily living and entertaining. Spanning two stories, the interior design thoughtfully separates distinct living zones, enhancing both privacy and practical arrangement. Constructed in 1920, this residence embodies a timeless architectural presence, offering a unique foundation for contemporary enhancements. An inviting porch extends an opportunity for tranquil outdoor moments, providing a pleasant setting for relaxation or greeting the day. This condominium represents a compelling prospect for those ready to shape a truly exceptional urban residence or capitalize on a promising investment.
ⓘ Source: listings_history table (triggers on properties + properties_extension) + one-shot
backfill from property_details.listing_events for pre-trigger history.
Tax reassessment forecast IN · Partial reset (capped growth)
- Current annual tax
- $2,309 · $192/mo
- Projected year-2 tax
- $2,309 · $192/mo
- Expected delta
- $0/yr ($0/mo · 0.0%)
ⓘ Screening estimate from a state-policy table — verify with the county assessor before closing.
Climate risk First Street
- Flood 7/10 Severe FEMA zone X (unshaded) · 76% chance over 30 yrs
- Wildfire 1/10 Low
- Heat 4/10 Moderate 7 d/yr ≥102°F today · 19 d/yr by 30 yrs out
- Wind 2/10 Low 100% chance of damaging wind over 30 yrs
- Air quality 4/10 Moderate 5 unhealthy d/yr today · 7 by 30 yrs out
Nearby sold comps map
Loading sold comps map…
Walkable amenities ~0.75 mi
Loading nearby amenities…
Taxation est. · year 1
- Rental income
- $17,376
- − Mortgage interest
- −$3,019
- − Property taxes
- −$2,309
- − Insurance
- −$1,067
- − Repairs & maintenance
- −$1,390
- − Management
- −$1,390
- − Depreciation
- −$1,568
- Taxable income
- $6,633
- Est. tax owed @ 24.0%
- −$1,592
- After-tax cash flow
- $5,367/yr
For passive investors: Depreciation is non-cash, so a rental often shows a tax loss while cash-flowing — sheltering income. Rental losses are passive: they offset passive income freely, and up to $25,000/yr can offset ordinary (W-2) income if you actively participate and your MAGI is under $100k (phasing out to $0 by $150k); unused losses carry forward. On sale, claimed depreciation is recaptured at up to 25%, and gains may owe capital-gains tax (a 1031 exchange can defer both). Figures are a year-1 estimate at your 24.0% rate — not tax advice; consult a CPA.
Condition & rehab AI · 12 photos
This property requires extensive repairs and updates to improve its condition and value. Painting, flooring replacement, and stair and railing repair are immediate priorities. Landscaping and HVAC updates would also significantly enhance its appeal.
Repairs flagged
- Major Exterior siding — Weathered and possibly damaged
- Major Interior walls — Peeling paint and visible damage
- Major Flooring — Old and possibly damaged
- Major Stairs and railings — Signs of wear
Value-add opportunities
- Resale Painting and updating interior walls — Fresh paint and updated walls can significantly improve the home's appearance and appeal to potential buyers.
- Resale Flooring replacement — Replacing old and damaged flooring can enhance the home's overall condition and value.
- Resale Stair and railing repair — Repairing worn-out stairs and railings can improve safety and the home's overall condition.
- Both Landscaping and curb appeal — A well-maintained and attractive exterior can improve the home's curb appeal and overall value.
- Both HVAC/mechanical updates — Upgrading HVAC and mechanical systems can improve comfort and energy efficiency, which can increase both resale and rental value.
- Both Kitchen and bathroom updates — Updating these areas can significantly increase the home's value and appeal to potential buyers and renters. However, no specific areas are visible in the provided photos.
Renovation cost estimate screening
| Repair item | Severity | Est. cost |
|---|---|---|
| Exterior siding · Weathered and possibly damaged | Major | $15,000–50,000 |
| Interior walls · Peeling paint and visible damage | Major | $15,000–50,000 |
| Flooring · Old and possibly damaged | Major | $15,000–50,000 |
| Stairs and railings · Signs of wear | Major | $15,000–50,000 |
| Total estimated repair cost · 4 items | $60,000–200,000 |
Value-add ROI direction
- Resale Painting and updating interior walls — Fresh paint and updated walls can significantly improve the home's appearance and appeal to potential buyers. ↑
- Resale Flooring replacement — Replacing old and damaged flooring can enhance the home's overall condition and value. ↑
- Resale Stair and railing repair — Repairing worn-out stairs and railings can improve safety and the home's overall condition. ↑
- Both Landscaping and curb appeal — A well-maintained and attractive exterior can improve the home's curb appeal and overall value. ↑
- Both HVAC/mechanical updates — Upgrading HVAC and mechanical systems can improve comfort and energy efficiency, which can increase both resale and rental value. ↑
- Both Kitchen and bathroom updates — Updating these areas can significantly increase the home's value and appeal to potential buyers and renters. However, no specific areas are visible in the provided photos. ↑
ⓘ Cost ranges are severity-bucket heuristics (US national rule-of-thumb). Get contractor quotes + a written scope before underwriting a rehab budget.
Schools (NCES district)
- District
- Indianapolis Public Schools
- NCES district ID
- 1804770
- Math proficiency
- 14% ▼ -7.00%
- Reading proficiency
- 20% ▼ -3.00%
- Median HH income
- $32,034
- Composite
- 13.69/100
- National rank
- #9499
- State rank
- #286 of 301 in IN
Livability — Indianapolis city (balance)
No livability data for this city. (Only ~50 U.S. cities are tracked.)
Census & demographics
- Census place
- Indianapolis city (balance), IN
- County
- Marion County · 998,460 people
- City population
- 881,119
- Metro
- Indianapolis-Carmel-Anderson, IN
- Population (ZIP)
- 30,335
- Household income
- $49,195
- Rent vs Own
- Severe rent burden
- 1906.0
Population outlook (Marion County) Hauer SSP2
- Today (2025)
- 1,025,572 people
- By 2030
- 1,065,727 · +3.9%
- By 2040
- 1,141,577 · +11.3%
- By 2050
- 1,208,920 · +17.9%
- By 2075
- 1,367,288 · +33.3%
- By 2100
- 1,438,201 · +40.2%
Race, ethnicity, and origin ACS 2023
- Neighborhood character
- Diverse neighborhood (Simpson 0.63)
- Race & ethnicity
- White 53% Hispanic / Latino 23% Black 18% Two or more races 9%
- Hispanic origin (detail)
- Mexican 14% Puerto Rican 2%
- Common ancestry
- Slovak 2% Lithuanian 2% Italian 1%
- Foreign-born
- 9% · Canada
- Languages at home
- 81% English-only · Spanish 17%
Political lean MEDSL · Marion
- 2024 margin
- Strong D (+27.7) · D 63.0% · R 35.3% · Other 1.7%
- 2008→2024 swing
- -0.7pp no change · 2008: 28.4pp · 2024: 27.7pp
- All cycles
- 2024: D+27.7 2020: D+29.1 2016: D+22.8 2012: D+22.2 2008: D+28.4
Not yet ingested
- Civics
- —
Market trends
- HPI YoY
- ▼ -192.51%
- Current HPI
- 375.0969
- Rent YoY
- ▲ 7.31%
- Metro
- Indianapolis-Carmel-Anderson, IN
- State GDP YoY
- ▲ 2.90%
- F500 in state
- 18
Industry mix (Fortune 500 HQ in IN)
| Industry | F500 HQs | Revenue |
|---|---|---|
| Industrial Machinery | 2 | $37B |
|
||
| Healthcare | 1 | $177B |
|
||
| Pharmaceuticals | 1 | $45B |
|
||
| Metals / Steel | 1 | $18B |
|
||
| Agriculture | 1 | $17B |
|
||
| Packaging | 1 | $12B |
|
||
Price history
2 events — show timeline
- 2026-05-09 Pending — MIBOR as Distributed by MLS Grid
- 2026-03-31 Listed $53,900 MIBOR as Distributed by MLS Grid
Property tax history
-6.5%/yrLatest (2025): $2,309 · +23.2% YoY. Source: county tax records.
Cash-flow waterfall
monthlySold comps — $/sqft
last 12 mo · ≤1 miLoading sold comps…