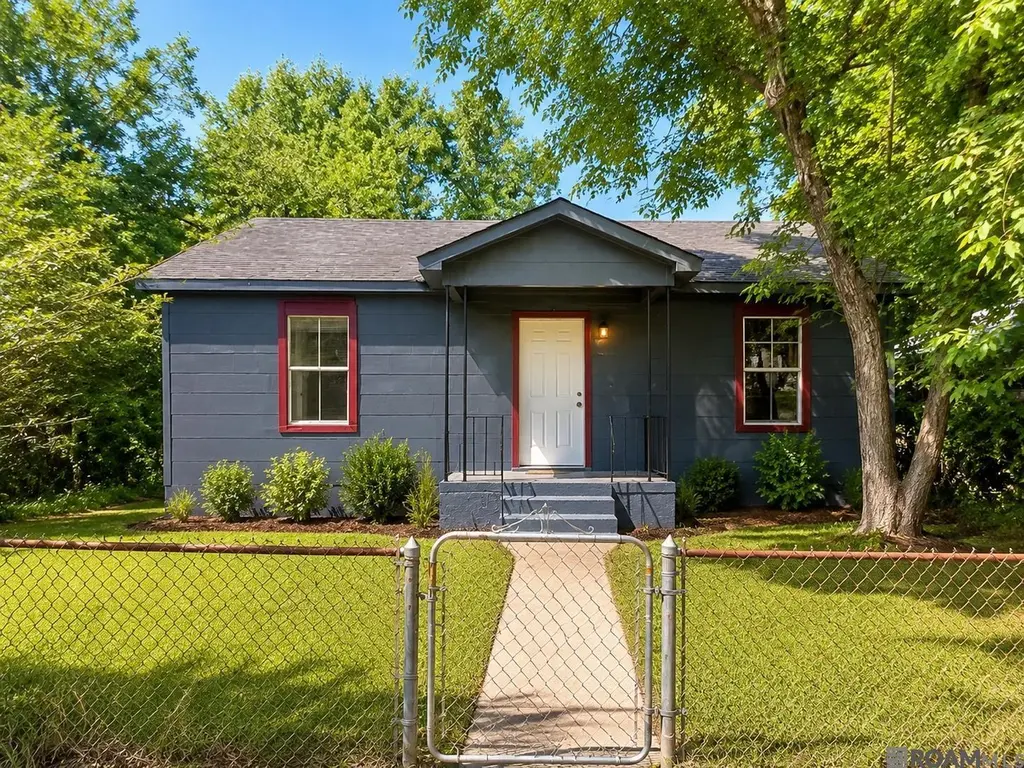
4234 Maple Dr · Baton Rouge, LA
Flood risk 4/10 · Minor
- FEMA flood zone
- AE
- Chance of flooding over 30 yrs
- 0.22%
- Est. flood insurance / yr
- $1,737 – $8,500
Fire risk 1/10 · Minimal
- Est. fire insurance / yr
- $1,269 – $2,357
Heat risk 8/10 · Major
- Hot days now (above 108°F)
- 7 days/yr
- Hot days in 30 yrs
- 19 days/yr
Wind risk 9/10 · Severe
- Chance of severe wind over 30 yrs
- 99.0%
Air-quality risk 2/10 · Minimal
- Unhealthy air days now
- 1 days/yr
- Unhealthy air days in 30 yrs
- 1 days/yr
Risk factors via First Street. Map © Google.
Why this score? — see what drove the B+ grade
The composite is a weighted blend of 9 inputs, each scored 0–100. Each bar is that input's sub-score; the figure is the points it added to the 100-point composite (weight × sub-score).
- Cash flow +30.0/30.0
- ARV discount +15.0/15.0
- 1% rule +10.0/10.0
- DSCR +10.0/10.0
- Livability +3.7/5.0
- Condition / age +2.5/5.0
- Schools +2.4/10.0
- Rent growth +2.2/5.0
- Appreciation +0.0/10.0
$53,550
🖨 Deal sheet (PDF) 📄 Offer letter ✓ Due diligence
Listing remarks MLS
Property presents a strong opportunity for an owner-occupant or investor seeking a partially renovated home in an established area. Previous owner was unable to complete planned improvements, leaving the property with only minor remaining work needed to finalize updates and bring it to full completion. Most major components are in place, with finishing touches required to reach full potential. Ideal for buyers looking to add value through light cosmetic work rather than full-scale renovation. Property is being sold in its current condition. All offers should include proof of funds or lender pre-approval. Great opportunity for a quick close for serious buyers or investors.
Key facts
- 9,147 sq ft lot
- 4 parking spots
- Built 1950
Property features AI
Exterior
- Parking: Open parking with a total of 4 parking spaces
- Utilities: Public water service; Public sewer service
- Home design: Detached single-family residence; Residential property
- Construction: Pillar/post/pier foundation; Built (year not provided)
- Exterior features: Lot approximately 0.21 acres; Lot dimensions about 70 x 133; Public water; Public sewer; Subdivision: Plank Road
Interior
- Bathrooms: 1 full bathroom
- Interior features: Central heating; No cooling
Neighborhood map
What this means for you Summary
Snapshot
- This is a 2-bed/1.0-bath single-family listed at $54k.
Deal economics
- At list price, monthly cash flow is $-26 ($-307/yr) — negative.
- To cash-flow at today's rent, offer at most $49k (8.4% below list).
- Meets the 1% rule at list price ($911 rent vs $54k).
- Recommended offer: $49k (8.4% below list) — sets the bar for cash-flow.
- Cap rate 15.3% vs local median 4.2% in Baton Rouge — top-decile yield for the area; either an underpriced asset or a hidden risk that comps aren't pricing in. Stress-test before assuming the spread holds.
Location & tenants
- Location reads 74/100 on livability (#24 in LA, #4,535 nationally) — a middle-class / working-renter tenant base. Strengths: commute A+, cost of living A+, health & safety A+; Watch: amenities D, crime F, employment D-.
- East Baton Rouge Parish (urban): math 22% / reading 34% proficiency, ranked #47 of 98 in LA (top 48%) — low school quality limits family demand, transient renter base, plan for 1-2y turnover; 77% free/reduced lunch — lower-income household profile, screen leases tightly.
- Zoned schools: Winbourne Elementary School (math 12% / reading 12%, grade F, #568 of 646 statewide, top 89%, 293 students, 93% FRL); Capitol Middle School (math 4% / reading 10%, grade F, #212 of 218 statewide, top 97%, 580 students, 87% FRL); Liberty High School (math 50% / reading 74%, grade B-, #15 of 265 statewide, top 6%, 1,208 students, 60% FRL) — zoned schools at 80% FRL track the district average.
- Market conditions: Rents soft (-1.2%/yr); 155 active listings in the ZIP; 22 comparable units currently listed for rent nearby; rentals at typical pace (median 26d on market — plan ~3-4 weeks tenant-placement turnaround); 41% of comp listings sitting > 30 days — soft ceiling on asking rent; lower-income renter base — watch delinquency; 2,252 units permitted in East Baton Rouge Parish in 2024 (440 in 5+ unit buildings).
- This rent runs 43% of the median local income ($25k/yr) — at the standard rent-burdened threshold; future hikes will face affordability resistance.
Forward outlook
- Local home prices are declining (-3.0%/yr); year-one equity from $370 of loan paydown is wiped out by about $2k of value loss. Plan a longer hold.
- East Baton Rouge County population projected at +4% by 2050 — modest demand growth; plan on rents tracking national, not racing it.
Negotiation context
- Only 5 days on market — expect competitive offers; lowballing is unlikely to land.
- Current owner paid $20k; list at $54k implies a 168% gain — meaningful room to come down on a strong offer.
Risks & watch-outs
- Watch-outs: flood insurance adds $427/mo; built in 1950 — expect roof / HVAC / electrical / plumbing capex.
- Climate carrying-cost: in FEMA flood zone AE (mandatory federal flood insurance); severe wind risk, 99% chance of damaging wind over 30y; extreme-heat days projected 7→19/yr by 2055 (HVAC capex compounding) — expect insurance premiums to compound above CPI over the hold.
Questions for the listing agent
- What do current leases actually rent for vs. the listed asking? Can we see a recent rent roll and the last 12 months of T-12 income?
- Built in 1950 — when were the roof, HVAC, electrical panel, plumbing, and water heater last replaced?
- What's the actual annual flood-insurance premium (NFIP or private), and is the property in a SFHA with mandatory coverage?
- Is there a deadline driving the sale (1031 exchange, divorce, estate, relocation)? That informs how much negotiation room exists.
- Crime grade is F in this area — have there been break-ins, vandalism, or insurance claims at this property in the last 3 years? What carrier currently insures it and at what premium?
- What's the average days-on-market for RENTAL listings here right now (not sales)? A rising rental-DOM trend means longer vacancies and softer asking-rent achievability than the comps imply.
- What's the recent tenant-quality profile in this submarket — average credit score on applications, eviction rate, late-payment / NSF rate, and stable-employment percentage? A property-management company in the area should have these aggregated.
- How much new for-sale + rental construction is in the pipeline within 1–3 miles? Heavy new supply typically softens prices + rents 12–24 months out; constrained supply supports both.
Investment metrics
- 1% rule
- 1.70% ✓
- Cap rate
- 15.28%
- Cash-on-cash
- 32.09%
- DSCR
- 2.43
- GRM
- 4.9
CMA / ARV
- ARV (on-the-fly)
- $86,250
- Comps found
- 12
Show comp detail 12 sales within ~0.75 mi
| Address | Dist | Beds/Ba | Sqft | Sold | Price | $/sf | Match |
|---|---|---|---|---|---|---|---|
| 3169 Sherwood St | 0.35mi | 3/1.0 (+1) | 1,196 (+4%) | 1mo | $89,500 | $75 | 72 |
| 4236 Delaware St | 0.11mi | 3/2.0 (+1) | 1,200 (+4%) | 9mo | $79,500 | $66 | 72 |
| 3620 Clayton Dr | 0.18mi | 2/1.0 | 1,289 (+12%) | 1mo | $55,000 | $43 | 71 |
| 3815 Webb Dr | 0.37mi | 3/1.0 (+1) | 1,190 (+4%) | 4mo | $10,000 | $8 | 69 |
| 3430 Oswego St | 0.59mi | 2/1.0 | 1,180 (+3%) | 1mo | $95,900 | $81 | 68 |
| 3577 Shelley St | 0.27mi | 3/1.0 (+1) | 1,241 (+8%) | 6mo | $130,000 | $105 | 64 |
| 4361 Evangeline St | 0.48mi | 2/1.0 | 1,002 (-13%) | 3mo | $75,000 | $75 | 53 |
| 3841 Lorraine St | 0.56mi | 2/1.0 | 1,261 (+10%) | 11mo | $39,900 | $32 | 49 |
| 4986 Shelley St | 0.71mi | 3/2.0 (+1) | 1,156 (+0%) | 11mo | $130,000 | $112 | 48 |
| 3335 N 38th St | 0.66mi | 3/1.0 (+1) | 1,275 (+11%) | 6mo | $55,000 | $43 | 41 |
| 3736 Alliquippa St | 0.74mi | 3/1.5 (+1) | 1,050 (-9%) | 5mo | $109,900 | $105 | 40 |
| 3011 Lorraine St | 0.75mi | 3/1.0 (+1) | 1,100 (-4%) | 17mo | $50,000 | $45 | 39 |
Match score weights: distance 35% · size 25% · config 20% · recency 20%. Top-matched comps best support the ARV.
Projected returns pro-forma
-3.0% appreciation · 0.0% rent growth · sell at horizon
- IRR
- -26.5%
- Equity multiple
- 0.15×
- Total profit
- $-12,732
- Equity at exit
- $7,984
- IRR
- -72.1%
- Equity multiple
- -0.50×
- Total profit
- $-22,512
- Equity at exit
- $4,630
Cash invested: $14,994 (down + closing). Projections, not guarantees.
Landlord ↔ Tenant lean methodology
- Overall (STATE)
- 90 Strongly Landlord-Friendly
- State Louisiana
- 90 Strongly Landlord-Friendly · R+12
- County
- — inherits STATE
- City
- — inherits STATE
ZIP-level market 70805
- Rents YoY
- -1.2%
- Active inventory
- 155
- Price-to-rent
- 4.9×
Monthly cashflow live
- Estimated rent
- $911 high interval (Pro) →
- Mortgage (P&I)
- −$281
- Tax from tax record
- −$16 /mo · $189/yr
- Insurance
- −$22
- Flood insurance flood zone
- −$427 /mo · $5,118/yr
- HOA
- −$0
- Vacancy / Maint / Mgmt
- −$191
- Net cashflow
- $-26
Break-even live
Sensitivity live
| Price | -10% $5 | -5% $-10 | +0% $-26 | +5% $-41 | +10% $-56 |
|---|---|---|---|---|---|
| Rent | -10% $-98 | -5% $-62 | +0% $-26 | +5% $10 | +10% $46 |
| Rate | -1.0pp $1 | -0.5pp $-12 | base $-26 | +0.5pp $-39 | +1.0pp $-54 |
UW: 25.0% down · 7.5% · 30yr · 1.5% tax · 5.0% vac · 8.0% maint · 8.0% mgmt
Financing live
Cash to close
- Down payment
- $13,388
- Closing costs
- $1,606
- Reserves months
- —
- Total cash needed
- —
Loan-product check · same deal, 3 products live
Conventional
25% down · 7.5% · 30yr
- Down + closing
- —
- Monthly P&I
- —
- Monthly cashflow
- —
- DSCR
- —
- Eligible?
- —
Personal DTI + credit; lowest rate.
DSCR
20% down · 8.5% · 30yr
- Down + closing
- —
- Monthly P&I
- —
- Monthly cashflow
- —
- DSCR
- —
- Eligible?
- —
No personal income docs; deal must DSCR.
Hard money
10% down · 12.0% · 12mo
- Down + closing
- —
- Monthly P&I
- —
- Monthly cashflow
- —
- DSCR
- —
- Eligible?
- —
Short-term bridge; refi at stabilization.
Rent comps 22 comps
| Address | Beds | Baths | Sqft | Rent | $/sqft | DOM | Units | Dist |
|---|---|---|---|---|---|---|---|---|
| 4380 Mohican-Prescott Crossover Baton Rouge, LA | 2.0 | 2.0 | 910 | $1,055 | $1.16 | 45d | 1 | 0.39mi |
| 3567 Charles St Baton Rouge, LA | 3.0 | 1.0 | 1400 | $1,250 | $0.89 | 45d | 1 | 0.45mi |
| 2933 Dayton St Unit A Baton Rouge, LA | 1.0 | 1.0 | 800 | $540 | $0.68 | 16d | 1 | 0.50mi |
| 2852 Dayton St Baton Rouge, LA | 2.0 | 1.0 | 1020 | $850 | $0.83 | 25d | 1 | 0.54mi |
| 3160 Wyandotte St Baton Rouge, LA | 2.0 | 1.0 | 1100 | $800 | $0.73 | 45d | 1 | 0.55mi |
| 3647 Mission Dr Baton Rouge, LA | 3.0 | 1.0 | 900 | $895 | $0.99 | 25d | 1 | 0.56mi |
| 3577 Mission Dr Baton Rouge, LA | 2.0 | 1.0 | 755 | $950 | $1.26 | 21d | 1 | 0.59mi |
| 2606 Weller Ave Baton Rouge, LA | 2.0 | 1.0 | 1000 | $650 | $0.65 | 45d | 1 | 0.70mi |
| 3540 N Foster Dr Baton Rouge, LA | 2.0 | 1.0 | 1000 | $1,000 | $1.00 | 25d | 1 | 0.83mi |
| 3859 Brady St Baton Rouge, LA | 2.0 | 1.0 | 800 | $775 | $0.97 | 45d | 1 | 0.89mi |
| 5350 Clayton Dr Baton Rouge, LA | 3.0 | 1.0 | 1050 | $850 | $0.81 | 45d | 1 | 0.95mi |
| 3936 Dalton St Baton Rouge, LA | 2.0 | 1.0 | 900 | $750 | $0.83 | 21d | 1 | 0.97mi |
| 5617 Prescott Rd Baton Rouge, LA | 1.0–2.0 | 1.0 | 687 | $900 | $1.31 | 25d | 26 | 1.06mi |
| 4189 W Brookstown Dr Baton Rouge, LA | 1.0–2.0 | 1.0 | 695 | $825 | $1.19 | 16d | 20 | 1.11mi |
| 4963 Greenwell St Baton Rouge, LA | 3.0 | 2.0 | 1400 | $1,500 | $1.07 | 25d | 1 | 1.16mi |
| 5315 McClelland Dr Baton Rouge, LA | 3.0 | 2.0 | 1369 | $1,000 | $0.73 | 25d | 1 | 1.21mi |
| 2347 Rhodes Ave Baton Rouge, LA | 2.0 | 1.0 | 1250 | $950 | $0.76 | 21d | 1 | 1.31mi |
| 5665 McClelland Dr Baton Rouge, LA | 2.0 | 1.0 | 775 | $825 | $1.06 | 25d | 1 | 1.31mi |
| 5665 McClelland Dr Apt 220 Baton Rouge, LA | 3.0 | 1.5 | 870 | $950 | $1.09 | 16d | 1 | 1.33mi |
| 5665 McClelland Dr Apt 133 Baton Rouge, LA | 2.0 | 1.0 | 775 | $825 | $1.06 | 45d | 1 | 1.33mi |
| 5665 McClelland Dr Apt 201 Baton Rouge, LA | 3.0 | 1.5 | 870 | $1,050 | $1.21 | 45d | 1 | 1.33mi |
| 5665 McClelland Dr Unit 245 Baton Rouge, LA | 2.0 | 1.5 | 765 | $800 | $1.05 | 45d | 1 | 1.33mi |
Listing history 6 events
-
2026-06-22days on market $53,550 Active 5 DOM
-
2026-06-18days on market $53,550 Active 2 DOM
-
2026-06-16statusdays on market $53,550 Active 1 DOM
-
2026-06-15days on market $53,550 Coming Soon 2 DOM
-
2026-06-14remarks 680-char remark
Show marketing remark (680 chars)
Property presents a strong opportunity for an owner-occupant or investor seeking a partially renovated home in an established area. Previous owner was unable to complete planned improvements, leaving the property with only minor remaining work needed to finalize updates and bring it to full completion. Most major components are in place, with finishing touches required to reach full potential. Ideal for buyers looking to add value through light cosmetic work rather than full-scale renovation. Property is being sold in its current condition. All offers should include proof of funds or lender pre-approval. Great opportunity for a quick close for serious buyers or investors.
-
2026-06-14$53,550 Coming Soon 1 DOM
Show marketing remark (680 chars)
Property presents a strong opportunity for an owner-occupant or investor seeking a partially renovated home in an established area. Previous owner was unable to complete planned improvements, leaving the property with only minor remaining work needed to finalize updates and bring it to full completion. Most major components are in place, with finishing touches required to reach full potential. Ideal for buyers looking to add value through light cosmetic work rather than full-scale renovation. Property is being sold in its current condition. All offers should include proof of funds or lender pre-approval. Great opportunity for a quick close for serious buyers or investors.
ⓘ Source: listings_history table (triggers on properties + properties_extension) + one-shot
backfill from property_details.listing_events for pre-trigger history.
Tax reassessment forecast LA · Resets to sale price
- Current annual tax
- $189 · $16/mo
- Projected year-2 tax
- $295 · $25/mo
- Expected delta
- +$105/yr (+$9/mo · 55.5%)
ⓘ Screening estimate from a state-policy table — verify with the county assessor before closing.
Climate risk First Street
- Flood 4/10 Moderate FEMA zone AE · 22% chance over 30 yrs
- Wildfire 1/10 Low
- Heat 8/10 Severe 7 d/yr ≥108°F today · 19 d/yr by 30 yrs out
- Wind 9/10 Extreme 99% chance of damaging wind over 30 yrs
- Air quality 2/10 Low 1 unhealthy d/yr today · 1 by 30 yrs out
Nearby sold comps map
Loading sold comps map…
Walkable amenities ~0.75 mi
Loading nearby amenities…
Taxation est. · year 1
- Rental income
- $10,935
- − Mortgage interest
- −$3,000
- − Property taxes
- −$189
- − Insurance
- −$5,386
- − Repairs & maintenance
- −$875
- − Management
- −$875
- − Depreciation
- −$1,558
- Taxable loss
- −$948
- Est. tax savings @ 24.0%
- +$227
- After-tax cash flow
- $-79/yr
For passive investors: Depreciation is non-cash, so a rental often shows a tax loss while cash-flowing — sheltering income. Rental losses are passive: they offset passive income freely, and up to $25,000/yr can offset ordinary (W-2) income if you actively participate and your MAGI is under $100k (phasing out to $0 by $150k); unused losses carry forward. On sale, claimed depreciation is recaptured at up to 25%, and gains may owe capital-gains tax (a 1031 exchange can defer both). Figures are a year-1 estimate at your 24.0% rate — not tax advice; consult a CPA.
Schools (NCES district)
- District
- East Baton Rouge Parish
- NCES district ID
- 2200540
- Math proficiency
- 22% ▼ -36.00%
- Reading proficiency
- 34% ▼ -31.00%
- Median HH income
- $46,263
- Composite
- 24.14/100
- National rank
- #7745
- State rank
- #47 of 98 in LA
Livability — Baton Rouge
- Score
- 74/100
- State rank
- #24
- US rank
- #4535
Category grades
Schools grade is shown separately in the Schools card above.
Census & demographics
- Census place
- Baton Rouge, LA
- County
- East Baton Rouge Parish · 399,686 people
- City population
- 351,868
- Metro
- Baton Rouge, LA
- Population (ZIP)
- 23,288
- Household income
- $25,397
- Rent vs Own
- Severe rent burden
- 1980.0
Population outlook (East Baton Rouge County) Hauer SSP2
- Today (2025)
- 464,810 people
- By 2030
- 472,137 · +1.6%
- By 2040
- 480,243 · +3.3%
- By 2050
- 484,422 · +4.2%
- By 2075
- 492,069 · +5.9%
- By 2100
- 476,347 · +2.5%
Race, ethnicity, and origin ACS 2023
- Neighborhood character
- Predominantly Black (95%)
- Race & ethnicity
- Black 95% Hispanic / Latino 2% White 2% Two or more races 1%
- Common ancestry
- Lithuanian 1%
- Foreign-born
- 1% · Canada
- Languages at home
- 98% English-only · Spanish 1%
Political lean MEDSL · East Baton Rouge
- 2024 margin
- D (+11.1) · D 54.5% · R 43.4% · Other 2.1%
- 2008→2024 swing
- +8.9pp toward D · 2008: 2.2pp · 2024: 11.1pp
- All cycles
- 2024: D+11.1 2020: D+13.1 2016: D+9.2 2012: D+5.2 2008: D+2.2
Not yet ingested
- Civics
- —
Market trends
- HPI YoY
- ▼ -110.79%
- Current HPI
- 75.7121
- Rent YoY
- ▼ -1.21%
- Metro
- Baton Rouge, LA
- State GDP YoY
- ▲ 3.29%
- F500 in state
- 10
Industry mix (Fortune 500 HQ in LA)
| Industry | F500 HQs | Revenue |
|---|---|---|
| Telecommunications | 2 | $23B |
|
||
| Utilities | 1 | $12B |
|
||
| Wholesale / Distribution | 1 | $5B |
|
||
| Advertising | 1 | $2B |
|
||
Price history
+167.8% since first listed4 events — show timeline
- 2026-06-14 Coming Soon $53,550 AcadianaMLS
- 2026-06-13 Coming Soon $53,550 GBRMLS
- 2009-11-10 Sold (Public Records) $20,000 Public Records
- 1980-05-22 Sold (Public Records) — Public Records
Property tax history
+2.9%/yrLatest (2025): $189 · +4.7% YoY. Source: county tax records.
Cash-flow waterfall
monthlySold comps — $/sqft
last 12 mo · ≤1 miLoading sold comps…