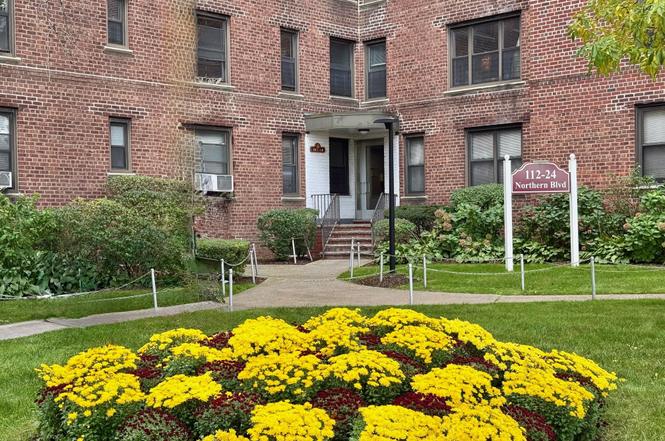
112-24 Northern Blvd Unit 3G · New York, NY
Flood risk No data
- FEMA flood zone
- —
- Chance of flooding over 30 yrs
- —
- Est. flood insurance / yr
- —
Fire risk No data
- Est. fire insurance / yr
- —
Heat risk No data
- Hot days now (above threshold)
- —
- Hot days in 30 yrs
- —
Wind risk No data
- Chance of severe wind over 30 yrs
- —
Air-quality risk No data
- Unhealthy air days now
- —
- Unhealthy air days in 30 yrs
- —
Risk factors via First Street. Map © Google.
Why this score? — see what drove the B- grade
The composite is a weighted blend of 9 inputs, each scored 0–100. Each bar is that input's sub-score; the figure is the points it added to the 100-point composite (weight × sub-score).
- Cash flow +23.2/30.0
- Appreciation +8.7/10.0
- DSCR +7.5/10.0
- ARV discount +7.5/15.0
- 1% rule +6.0/10.0
- Schools +5.0/10.0
- Livability +3.8/5.0
- Rent growth +2.5/5.0
- Condition / age +2.5/5.0
$284,000
🖨 Deal sheet 📄 Offer letter ✓ Due diligence
Listing remarks
WELCOME TO THIS SPACIOUS TWO BEDROOM CORNER UNIT LOCATED IN THE HIGHLY DESIRABLE DORIE MILLER CO-OPS IN CORONA, NY. UPON ENTERING, YOU ARE GREETED BY A BRIGHT AND INVITING LIVING AREA FEATURING WARM HARDWOOD FLOORS, LARGE WINDOWS THAT FILL THE SPACE WITH NATURAL LIGHT, AND AMPLE STORAGE WITH FIVE CLOSETS THROUGHOUT, INCLUDING A CONVENIENT COAT CLOSET. THIS THIRD FLOOR APARTMENT FEATURES A RENOVATED KITCHEN WITH MAPLE COLORED WOOD CABINETS, A WINDOW FOR VENTILATION AND BRINGS IN PLENTY OF SUNLIGHT. THE OPEN DINING AREA FLOWS SEAMLESSLY INTO THE LIVING ROOM, CREATING A COMFORTABLE AND FUNCTIONAL LAYOUT FOR DAILY LIVING AND ENTERTAINING. THE LIVING ROOM BOASTS A LARGE DOUBLE WINDOW, HARDWOOD F
Key facts
- Original bathroom
- Large closets
- Corner unit
Tags
Property features AI
Finance
- HOA & community: Association: Dorie Miller; Additional monthly energy assessment of $56 through June 2026
Exterior
- Parking: Garage parking; Common parking lot; Waitlist for parking; Parking fee $100
- Security: Building security; Video cameras
- Utilities: Public sewer; Cable available; Electricity available; Natural gas available; Public trash collection; Water available
- Home design: Stock cooperative; 6-story building; Unit located between 3rd and 5th floors
- Construction: Brick construction
- Exterior features: Courtyard; Garden; Outdoor space; Mailbox; Bicycle room
Interior
- Kitchen: Gas range; Refrigerator
- Bedrooms: Located between 3rd and 5th floors
- Flooring: Hardwood floors
- Bathrooms: 1 full bathroom
- Heating & cooling: Steam heating; No central cooling
- Interior features: Elevator; Accessible approach with ramp
- Laundry & utility: Common area laundry; Basement laundry room
Neighborhood map
What this means for you Summary
Snapshot
- This is a 2-bed/1.0-bath condo listed at $284k.
Deal economics
- At list price, monthly cash flow is $515 ($6k/yr) — positive.
- The deal already cash-flows at list — no discount required.
- Meets the 1% rule at list price ($3k rent vs $284k).
- Recommended offer: $250k (12.0% below list) — sets the bar for market timing.
- Cap rate 8.5% vs local median 2.6% in New York — top-decile yield for the area; either an underpriced asset or a hidden risk that comps aren't pricing in. Stress-test before assuming the spread holds.
Location & tenants
- Location reads 75/100 on livability (#268 in NY, #4,188 nationally) — a middle-class / working-renter tenant base. Strengths: amenities A+, commute A+, health & safety A; Watch: crime F, cost of living F.
- Market conditions: 243 active listings in the ZIP; 40 comparable units currently listed for rent nearby; rentals at typical pace (median 22d on market — plan ~3-4 weeks tenant-placement turnaround); 5,302 units permitted in Queens County in 2024 (4,918 in 5+ unit buildings).
- At $3,136/mo this rent would consume 52% of the median local household income ($72k/yr) (locally 6817% of renters already pay >50% of income on rent) — very limited rent-growth headroom before tenants either downsize or default.
Forward outlook
- In year one you build about $23k of equity ($2k loan paydown + $21k appreciation (7.4% local appreciation)).
- Queens County population projected at +16% by 2050 — long-run rental-demand tailwind backs the buy-and-hold thesis.
- At projected returns (7.4% appreciation + 3.0% rent growth), your $80k cash investment doubles in ~3 years — after that, you're playing with house money.
- By year 2, paydown + projected appreciation supports a ~$37k cash-out refi (75% LTV) — recoverable capital for the next deal without selling this one.
Negotiation context
- It's been on market 253 days — a 12% lower offer ($250k) is reasonable based on typical stale-listing flexibility.
Risks & watch-outs
- Watch-outs: built in 1956 — expect roof / HVAC / electrical / plumbing capex.
Questions for the listing agent
- It's been on market 253 days. Have you received any prior offers? Is the seller open to a 12% concession, seller financing, or rate buy-down credit?
- Built in 1956 — when were the roof, HVAC, electrical panel, plumbing, and water heater last replaced?
- Any open or pending special assessments — roof, HVAC, plumbing, elevator, façade? What's the per-unit balance and payoff schedule, and is the seller paying it off at close or rolling it to the buyer?
- Why hasn't it sold? Are there any deal-killer items the seller is aware of (foundation, flood, title, zoning, code violations)?
- Is there a deadline driving the sale (1031 exchange, divorce, estate, relocation)? That informs how much negotiation room exists.
- Schools are B-rated — typically a magnet for longer-tenancy family renters. What's the average tenant stay here, and is there a school-zone premium baked into asking?
- Crime grade is F in this area — have there been break-ins, vandalism, or insurance claims at this property in the last 3 years? What carrier currently insures it and at what premium?
- What's the average days-on-market for RENTAL listings here right now (not sales)? A rising rental-DOM trend means longer vacancies and softer asking-rent achievability than the comps imply.
- What's the recent tenant-quality profile in this submarket — average credit score on applications, eviction rate, late-payment / NSF rate, and stable-employment percentage? A property-management company in the area should have these aggregated.
- How much new apartment / multifamily construction is in the pipeline within 1–3 miles? Heavy new supply (>2% of stock underway) typically softens rents 12–24 months out; light construction supports rent growth.
Investment metrics
- 1% rule
- 1.10% ✓
- Cap rate
- 8.47%
- Cash-on-cash
- 7.77%
- DSCR
- 1.35
- GRM
- 7.5
CMA / ARV
No comps found within radius.
Projected returns pro-forma
7.4% appreciation · 3.0% rent growth · sell at horizon
- IRR
- 24.7%
- Equity multiple
- 2.75×
- Total profit
- $139,010
- Equity at exit
- $204,268
- IRR
- 22.6%
- Equity multiple
- 5.77×
- Total profit
- $379,095
- Equity at exit
- $394,973
Cash invested: $79,520 (down + closing). Projections, not guarantees.
Landlord ↔ Tenant lean methodology
- Overall (CITY)
- 0 Strongly Tenant-Friendly
- State New York
- 15 Strongly Tenant-Friendly · D+10
- County
- — inherits STATE
- City New York
- 0 Strongly Tenant-Friendly · D+34
ZIP-level market 11368
- Home prices YoY
- 2.7%
- Active inventory
- 243
- Price-to-rent
- 7.5×
Monthly cashflow live
- Estimated rent
- $3,136 high interval (Pro) →
- Mortgage (P&I)
- −$1,489
- Tax est. 1.5%
- −$355 /mo · $4,260/yr
- Insurance
- −$118
- HOA
- −$0
- Vacancy / Maint / Mgmt
- −$659
- Net cashflow
- $515
Break-even live
UW: 25.0% down · 7.5% · 30yr · 1.5% tax · 5.0% vac · 8.0% maint · 8.0% mgmt
Financing live
Cash to close
- Down payment
- $71,000
- Closing costs
- $8,520
- Reserves months
- —
- Total cash needed
- —
Loan-product check · same deal, 3 products live
Conventional
25% down · 7.5% · 30yr
- Down + closing
- —
- Monthly P&I
- —
- Monthly cashflow
- —
- DSCR
- —
- Eligible?
- —
Personal DTI + credit; lowest rate.
DSCR
20% down · 8.5% · 30yr
- Down + closing
- —
- Monthly P&I
- —
- Monthly cashflow
- —
- DSCR
- —
- Eligible?
- —
No personal income docs; deal must DSCR.
Hard money
10% down · 12.0% · 12mo
- Down + closing
- —
- Monthly P&I
- —
- Monthly cashflow
- —
- DSCR
- —
- Eligible?
- —
Short-term bridge; refi at stabilization.
Rent comps 40 comps
| Address | Beds | Baths | Sqft | Rent | $/sqft | DOM | Units | Dist |
|---|---|---|---|---|---|---|---|---|
| 3260 106th St East Elmhurst, NY | 1.0 | 1.0 | 600 | $3,750 | $6.25 | 7d | 1 | 0.26mi |
| 31-47 102nd St Unit 2 fl Flushing, NY | 2.0 | 1.0 | 650 | $2,600 | $4.00 | 24d | 1 | 0.48mi |
| 3730 103rd St Corona, NY | 1.0 | 1.0 | 540 | $1,800 | $3.33 | 19d | 1 | 0.51mi |
| 2724 Gillmore St Unit 2 East Elmhurst, NY | 1.0 | 1.0 | 576 | $2,300 | $3.99 | 24d | 1 | 0.58mi |
| 98-07 37th Ave Flushing, NY | 3.0 | 1.0 | 750 | $3,350 | $4.47 | 24d | 1 | 0.69mi |
| 31-40 98th St Unit 2 Flushing, NY | 1.0 | 1.0 | 800 | $2,100 | $2.62 | 7d | 1 | 0.70mi |
| 25-61 99th St Unit 2nd Fl Flushing, NY | 2.0 | 1.0 | 780 | $3,200 | $4.10 | 24d | 1 | 0.74mi |
| 10302 42nd Ave Unit 4D Corona, NY | 2.0 | 1.5 | 761 | $3,400 | $4.47 | 19d | 1 | 0.74mi |
| 10869 50th Ave Corona, NY | 3.0 | 1.0 | 912 | $3,300 | $3.62 | 24d | 1 | 0.90mi |
| 4911 108th St Unit 4A Corona, NY | 3.0 | 2.0 | 1027 | $3,600 | $3.51 | 17d | 1 | 0.91mi |
| 9707 24th Ave East Elmhurst, NY | 3.0 | 1.5 | 1100 | $4,500 | $4.09 | 24d | 1 | 0.97mi |
| 54-01 108th St Unit 2R Flushing, NY | 2.0 | 1.0 | 1000 | $3,050 | $3.05 | 24d | 1 | 1.11mi |
| 8910 35th Ave Unit E1L Jackson Heights, NY | 2.0 | 1.0 | 850 | $3,050 | $3.59 | 24d | 1 | 1.11mi |
| 13105 40th Rd Flushing, NY | 2.0 | 1.0–2.0 | 762 | $4,500 | $5.90 | 3d | 3 | 1.13mi |
| 13105 40th Rd Flushing, NY | 1.0 | 1.0 | 626 | $3,350 | $5.35 | 19d | 3 | 1.13mi |
| 4050 Case St Elmhurst, NY | 3.0 | 2.0 | 988 | $3,900 | $3.95 | 7d | 1 | 1.17mi |
| 40-85 Denman St Unit 2 Elmhurst, NY | 3.0 | 1.5 | 1100 | $3,200 | $2.91 | 20d | 1 | 1.18mi |
| 4028 College Point Blvd #912 Flushing, NY | 2.0 | 2.0 | 1083 | $4,200 | $3.88 | 24d | 1 | 1.23mi |
| 13101 40th Rd Unit 2P Flushing, NY | 1.0 | 1.0 | 761 | $3,300 | $4.34 | 24d | 1 | 1.23mi |
| 4022 College Point Blvd Flushing, NY | 1.0–2.0 | 1.0–2.0 | 983 | $4,000 | $4.07 | 24d | 2 | 1.24mi |
| 9209 43rd Ave Unit 2 Elmhurst, NY | 3.0 | 1.5 | 1100 | $3,200 | $2.91 | 24d | 1 | 1.26mi |
| 13327 39th Ave Unit 3N Flushing, NY | 1.0 | 1.0 | 720 | $3,600 | $5.00 | 24d | 1 | 1.29mi |
| 4105 College Point Blvd Unit 5I Flushing, NY | 2.0 | 2.0 | 600 | $2,600 | $4.33 | 4d | 1 | 1.30mi |
| 4142 College Point Blvd Unit 6A Flushing, NY | 2.0 | 2.0 | 868 | $3,000 | $3.46 | 2d | 1 | 1.30mi |
| 13119 Fowler Ave Unit 7C Flushing, NY | 2.0 | 2.0 | 810 | $3,300 | $4.07 | 19d | 1 | 1.31mi |
| 91-04 43rd Ave Unit 2ND Elmhurst, NY | 3.0 | 1.0 | 1100 | $3,600 | $3.27 | 24d | 1 | 1.33mi |
| 13203 Sanford Ave Unit 7E Flushing, NY | 2.0 | 2.0 | 702 | $2,800 | $3.99 | 24d | 1 | 1.33mi |
| 13222 41st Rd #501 Flushing, NY | 2.0 | 2.0 | 843 | $3,400 | $4.03 | 24d | 1 | 1.34mi |
| 30-13 85th St Unit 2 Flushing, NY | 3.0 | 1.0 | 1100 | $3,800 | $3.45 | 22d | 1 | 1.34mi |
| 3916 Prince St Flushing, NY | 1.0 | 1.0 | 530 | $2,900 | $5.47 | 15d | 2 | 1.38mi |
| 3371 Prince St Unit 8J Flushing, NY | 2.0 | 2.0 | 741 | $4,075 | $5.50 | 15d | 1 | 1.39mi |
| 3371 Prince St Unit 6K Flushing, NY | 2.0 | 2.0 | 768 | $4,000 | $5.21 | 15d | 1 | 1.39mi |
| 3371 Prince St Unit 7C Flushing, NY | 2.0 | 2.0 | 773 | $4,025 | $5.21 | 15d | 1 | 1.39mi |
| 3371 Prince St Unit 8F Flushing, NY | 2.0 | 2.0 | 716 | $4,050 | $5.66 | 15d | 1 | 1.39mi |
| 13416 35th Ave Unit 7E Flushing, NY | 2.0 | 2.0 | 681 | $3,300 | $4.85 | 24d | 1 | 1.39mi |
| 13208 Pople Ave Unit 4A Flushing, NY | 1.0 | 1.0 | 650 | $2,500 | $3.85 | 24d | 1 | 1.40mi |
| 133-08 41st Rd Flushing, NY | 2.0 | 1.0 | 700 | $2,300 | $3.29 | 24d | 1 | 1.43mi |
| 13239 Pople Ave Unit 6D Flushing, NY | 1.0 | 1.0 | 750 | $2,500 | $3.33 | 4d | 1 | 1.43mi |
| 13226 Avery Ave Unit 8A Flushing, NY | 2.0 | 2.0 | 725 | $2,800 | $3.86 | 4d | 1 | 1.44mi |
| 25-05 124th St Fl 1 Flushing, NY | 2.0 | 1.0 | 750 | $2,300 | $3.07 | 19d | 1 | 1.46mi |
HOA detail condo
- Monthly dues
- $0 · $0/yr
- Assessments
- None detected in remarks — confirm with the listing agent.
Listing history 6 events
-
2026-06-08statusdays on market $284,000 Pending 253 DOM
-
2026-06-03days on market $284,000 Active 251 DOM
-
2026-06-01days on market $284,000 Active 249 DOM
-
2026-05-31days on market $284,000 Active 248 DOM
-
2026-01-25price $284,000
-
2025-09-24$289,000 Active
ⓘ Source: listings_history table (triggers on properties + properties_extension) + one-shot
backfill from property_details.listing_events for pre-trigger history.
Nearby sold comps map
Loading sold comps map…
Walkable amenities ~0.75 mi
Loading nearby amenities…
Taxation est. · year 1
- Rental income
- $37,629
- − Mortgage interest
- −$15,908
- − Property taxes
- −$4,260
- − Insurance
- −$1,420
- − Repairs & maintenance
- −$3,010
- − Management
- −$3,010
- − Depreciation
- −$8,262
- Taxable income
- $1,758
- Est. tax owed @ 24.0%
- −$422
- After-tax cash flow
- $5,753/yr
For passive investors: Depreciation is non-cash, so a rental often shows a tax loss while cash-flowing — sheltering income. Rental losses are passive: they offset passive income freely, and up to $25,000/yr can offset ordinary (W-2) income if you actively participate and your MAGI is under $100k (phasing out to $0 by $150k); unused losses carry forward. On sale, claimed depreciation is recaptured at up to 25%, and gains may owe capital-gains tax (a 1031 exchange can defer both). Figures are a year-1 estimate at your 24.0% rate — not tax advice; consult a CPA.
Schools (NCES district)
No district data.
Livability — New York
- Score
- 75/100
- State rank
- #268
- US rank
- #4188
Category grades
Schools grade is shown separately in the Schools card above.
Census & demographics
- Census place
- New York, NY
- County
- Queens County · 1,914,869 people
- City population
- 7,731,280
- Metro
- New York-Newark-Jersey City, NY-NJ-PA
- Population (ZIP)
- 105,716
- Household income
- $72,270
- Rent vs Own
- Severe rent burden
- 6817.0
Population outlook (Queens County) Hauer SSP2
- Today (2025)
- 2,546,320 people
- By 2030
- 2,643,059 · +3.8%
- By 2040
- 2,815,563 · +10.6%
- By 2050
- 2,944,423 · +15.6%
- By 2075
- 3,123,338 · +22.7%
- By 2100
- 3,098,688 · +21.7%
Race, ethnicity, and origin ACS 2023
- Neighborhood character
- Predominantly Hispanic (75%)
- Race & ethnicity
- Hispanic / Latino 75% Two or more races 14% Asian 12% Black 8% White 4% Native American 1%
- Hispanic origin (detail)
- Mexican 20% Puerto Rican 2% Dominican 14%
- Foreign-born
- 60% · Canada, China, Jamaica
- Languages at home
- 15% English-only · Spanish 70% Chinese 6% Other Indo-European 3%
Political lean MEDSL · Queens
- 2024 margin
- Strong D (+24.6) · D 62.3% · R 37.7%
- 2008→2024 swing
- -26.2pp toward R · 2008: 50.8pp · 2024: 24.6pp
- All cycles
- 2024: D+24.6 2020: D+45.2 2016: D+53.4 2012: D+58.5 2008: D+50.8
Not yet ingested
- Civics
- —
Market trends
- HPI YoY
- ▲ 7.40%
- Current HPI
- 282.8276
- Rent YoY
- —
- Metro
- New York-Newark-Jersey City, NY-NJ-PA
- State GDP YoY
- ▲ 2.60%
- F500 in state
- 92
Industry mix (Fortune 500 HQ in NY)
| Industry | F500 HQs | Revenue |
|---|---|---|
| Financial Services | 10 | $950B |
|
||
| Consumer Goods | 9 | $162B |
|
||
| Insurance | 4 | $225B |
|
||
| Telecommunications | 2 | $144B |
|
||
| Pharmaceuticals | 2 | $112B |
|
||
| Media / Entertainment | 2 | $69B |
|
||
Price history
-1.7% since first listed2 events — show timeline
- 2026-01-25 Price Changed $284,000 OneKey® MLS as Distributed by MLS Grid
- 2025-09-24 Listed $289,000 OneKey® MLS as Distributed by MLS Grid
Cash-flow waterfall
monthlySold comps — $/sqft
last 12 mo · ≤1 miLoading sold comps…