15 Randy Ave · Melrose, MN
Flood risk 1/10 · Minimal
- FEMA flood zone
- X (unshaded)
- Chance of flooding over 30 yrs
- 0.0%
- Est. flood insurance / yr
- $507 – $1,088
Fire risk 1/10 · Minimal
- Est. fire insurance / yr
- $888 – $1,650
Heat risk 2/10 · Minimal
- Hot days now (above 98°F)
- 7 days/yr
- Hot days in 30 yrs
- 13 days/yr
Wind risk 2/10 · Minimal
- Chance of severe wind over 30 yrs
- —
Air-quality risk 2/10 · Minimal
- Unhealthy air days now
- 2 days/yr
- Unhealthy air days in 30 yrs
- 2 days/yr
Risk factors via First Street. Map © Google.
Why this score? — see what drove the C- grade
The composite is a weighted blend of 9 inputs, each scored 0–100. Each bar is that input's sub-score; the figure is the points it added to the 100-point composite (weight × sub-score).
- Cash flow +12.6/30.0
- Appreciation +10.0/10.0
- ARV discount +7.5/15.0
- 1% rule +6.3/10.0
- Schools +4.1/10.0
- Livability +3.8/5.0
- DSCR +3.7/10.0
- Rent growth +2.5/5.0
- Condition / age +2.5/5.0
$119,900
🖨 Deal sheet 📄 Offer letter ✓ Due diligence
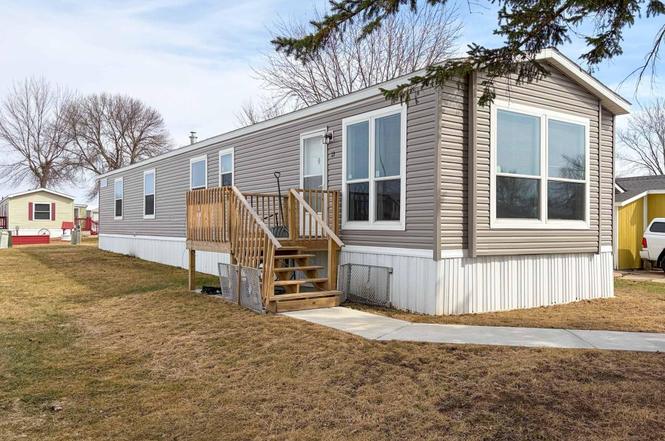
Listing remarks
Affordable housing option, located in a well-maintained mobile home park! Mobile home is a 2023 model w/ popular amenities & modern colors & finishes. Rental is $280/month & includes a detached oversized 1-stall garage. You'll appreciate the kitchen's large center island w/ butcher block countertop, beautifully stained cabinets, SS appliances, tiled backsplash & laminate planking flooring. Open concept kitchen/dining/living rooms; plenty of natural light! Relax in the spacious primary bedroom suite; you will love the WIC, stand up shower and deep soaker tub. Steps away is a laundry area! Second and third bedrooms are nice-sized and are next to the second full bathroo
Key facts
- Large center island
- Ss appliances
- 2023 model
Tags
Neighborhood map
What this means for you Summary
Snapshot
- This is a 3-bed/2.0-bath single-family listed at $120k.
Deal economics
- At list price, monthly cash flow is $-16 ($-195/yr) — negative.
- To cash-flow at today's rent, offer at most $118k (2.0% below list).
- Meets the 1% rule at list price ($1k rent vs $120k).
- Recommended offer: $116k (3.0% below list) — sets the bar for market timing.
Location & tenants
- Location reads 76/100 on livability (#164 in MN, #3,568 nationally) — a middle-class / working-renter tenant base. Strengths: crime A+, cost of living A+, housing A+; Watch: amenities F, commute F.
- Melrose Public School District (rural): math 45% / reading 50% proficiency, ranked #142 of 301 in MN (top 47%) — families likely to look elsewhere, expect single-tenant / working-renter base with shorter leases.
- Market conditions: 31 active listings in the ZIP; 661 units permitted in Stearns County in 2024 (291 in 5+ unit buildings).
Forward outlook
- In year one you build about $13k of equity ($829 loan paydown + $12k appreciation (10.0% local appreciation)).
- Stearns County population projected at +9% by 2050 — modest demand growth; plan on rents tracking national, not racing it.
- At projected returns (10.0% appreciation + 3.0% rent growth), your $34k cash investment doubles in ~3 years — after that, you're playing with house money.
- By year 3, paydown + projected appreciation supports a ~$32k cash-out refi (75% LTV) — recoverable capital for the next deal without selling this one.
Negotiation context
- It's been on market 52 days — a 3% lower offer ($116k) is reasonable based on typical stale-listing flexibility.
Questions for the listing agent
- What do current leases actually rent for vs. the listed asking? Can we see a recent rent roll and the last 12 months of T-12 income?
- It's been on market 52 days. Have you received any prior offers? Is the seller open to a 3% concession, seller financing, or rate buy-down credit?
- What does the HOA fee cover, when was the last increase, and are there any pending special assessments or reserve-fund shortfalls?
- Is there a deadline driving the sale (1031 exchange, divorce, estate, relocation)? That informs how much negotiation room exists.
- Schools are B-rated — typically a magnet for longer-tenancy family renters. What's the average tenant stay here, and is there a school-zone premium baked into asking?
- What's the average days-on-market for RENTAL listings here right now (not sales)? A rising rental-DOM trend means longer vacancies and softer asking-rent achievability than the comps imply.
- What's the recent tenant-quality profile in this submarket — average credit score on applications, eviction rate, late-payment / NSF rate, and stable-employment percentage? A property-management company in the area should have these aggregated.
- How much new for-sale + rental construction is in the pipeline within 1–3 miles? Heavy new supply typically softens prices + rents 12–24 months out; constrained supply supports both.
Investment metrics
- 1% rule
- 1.13% ✓
- Cap rate
- 6.13%
- Cash-on-cash
- -0.58%
- DSCR
- 0.97
- GRM
- 7.4
CMA / ARV
No comps found within radius.
Projected returns pro-forma
10.0% appreciation · 3.0% rent growth · sell at horizon
- IRR
- 23.9%
- Equity multiple
- 2.92×
- Total profit
- $64,448
- Equity at exit
- $108,015
- IRR
- 21.3%
- Equity multiple
- 6.69×
- Total profit
- $190,960
- Equity at exit
- $232,939
Cash invested: $33,572 (down + closing). Projections, not guarantees.
Landlord ↔ Tenant lean methodology
- Overall (STATE)
- 46 Balanced
- State Minnesota
- 46 Balanced · D+2
- County
- — inherits STATE
- City
- — inherits STATE
ZIP-level market 56352
- Home prices YoY
- 6.1%
- Active inventory
- 31
- Price-to-rent
- 7.4×
Monthly cashflow live
- Estimated rent
- $1,357 medium interval (Pro) →
- Mortgage (P&I)
- −$629
- Tax est. 1.5%
- −$150 /mo · $1,798/yr
- Insurance
- −$50
- HOA
- −$260
- Vacancy / Maint / Mgmt
- −$285
- Net cashflow
- $-16
Break-even live
UW: 25.0% down · 7.5% · 30yr · 1.5% tax · 5.0% vac · 8.0% maint · 8.0% mgmt
Financing live
Cash to close
- Down payment
- $29,975
- Closing costs
- $3,597
- Reserves months
- —
- Total cash needed
- —
Loan-product check · same deal, 3 products live
Conventional
25% down · 7.5% · 30yr
- Down + closing
- —
- Monthly P&I
- —
- Monthly cashflow
- —
- DSCR
- —
- Eligible?
- —
Personal DTI + credit; lowest rate.
DSCR
20% down · 8.5% · 30yr
- Down + closing
- —
- Monthly P&I
- —
- Monthly cashflow
- —
- DSCR
- —
- Eligible?
- —
No personal income docs; deal must DSCR.
Hard money
10% down · 12.0% · 12mo
- Down + closing
- —
- Monthly P&I
- —
- Monthly cashflow
- —
- DSCR
- —
- Eligible?
- —
Short-term bridge; refi at stabilization.
HOA detail
- Monthly dues
- $260 · $3,120/yr
Listing history 5 events
-
2026-04-16status Pending
-
2026-04-15historical Contingent - Inspection
-
2026-03-13price $119,900
-
2026-03-03price $122,900
-
2026-02-23$124,900 Active
ⓘ Source: listings_history table (triggers on properties + properties_extension) + one-shot
backfill from property_details.listing_events for pre-trigger history.
Climate risk First Street
- Flood 1/10 Low FEMA zone X (unshaded) · 0% chance over 30 yrs
- Wildfire 1/10 Low
- Heat 2/10 Low 7 d/yr ≥98°F today · 13 d/yr by 30 yrs out
- Wind 2/10 Low
- Air quality 2/10 Low 2 unhealthy d/yr today · 2 by 30 yrs out
Nearby sold comps map
Loading sold comps map…
Walkable amenities ~0.75 mi
Loading nearby amenities…
Taxation est. · year 1
- Rental income
- $16,289
- − Mortgage interest
- −$6,716
- − Property taxes
- −$1,798
- − Insurance
- −$600
- − Repairs & maintenance
- −$1,303
- − Management
- −$1,303
- − HOA
- −$3,120
- − Depreciation
- −$3,488
- Taxable loss
- −$2,039
- Est. tax savings @ 24.0%
- +$489
- After-tax cash flow
- $295/yr
For passive investors: Depreciation is non-cash, so a rental often shows a tax loss while cash-flowing — sheltering income. Rental losses are passive: they offset passive income freely, and up to $25,000/yr can offset ordinary (W-2) income if you actively participate and your MAGI is under $100k (phasing out to $0 by $150k); unused losses carry forward. On sale, claimed depreciation is recaptured at up to 25%, and gains may owe capital-gains tax (a 1031 exchange can defer both). Figures are a year-1 estimate at your 24.0% rate — not tax advice; consult a CPA.
Schools (NCES district)
- District
- Melrose Public School District
- NCES district ID
- 2720550
- Math proficiency
- 45% ▼ -14.00%
- Reading proficiency
- 50% ▼ -5.00%
- Median HH income
- $55,833
- Composite
- 41.26/100
- National rank
- #3525
- State rank
- #142 of 301 in MN
Livability — Melrose
- Score
- 76/100
- State rank
- #164
- US rank
- #3568
Category grades
Schools grade is shown separately in the Schools card above.
Census & demographics
- Census place
- Melrose, MN
- Population (ZIP)
- 5,955
Population outlook (Stearns County) Hauer SSP2
- Today (2025)
- 162,629 people
- By 2030
- 166,495 · +2.4%
- By 2040
- 172,661 · +6.2%
- By 2050
- 177,480 · +9.1%
- By 2075
- 192,907 · +18.6%
- By 2100
- 206,274 · +26.8%
Race, ethnicity, and origin ACS 2023
- Neighborhood character
- Predominantly White (86%)
- Race & ethnicity
- White 86% Hispanic / Latino 12% Two or more races 2%
- Hispanic origin (detail)
- Mexican 11%
- Common ancestry
- Portuguese 4% Romanian 4% Lithuanian 2%
- Foreign-born
- 5% · Canada
- Languages at home
- 87% English-only · Spanish 11% German/W. Germanic 1%
Political lean MEDSL · Stearns
- 2024 margin
- Strong R (+26.8) · D 35.7% · R 62.5% · Other 1.9%
- 2008→2024 swing
- -19.8pp toward R · 2008: -7.0pp · 2024: -26.8pp
- All cycles
- 2024: R+26.8 2020: R+22.5 2016: R+27.9 2012: R+12.1 2008: R+7.0
Not yet ingested
- Civics
- —
Market trends
- HPI YoY
- ▲ 23.62%
- Current HPI
- 410.59
- Rent YoY
- —
- Metro
- —
- State GDP YoY
- ▲ 2.41%
- F500 in state
- 34
Industry mix (Fortune 500 HQ in MN)
| Industry | F500 HQs | Revenue |
|---|---|---|
| Healthcare | 2 | $407B |
|
||
| Retail | 2 | $150B |
|
||
| Consumer Goods | 2 | $32B |
|
||
| Industrial Machinery | 2 | $6B |
|
||
| Agriculture | 1 | $40B |
|
||
| Healthcare / Medical Devices | 1 | $32B |
|
||
Price history
-4.0% since first listed5 events — show timeline
- 2026-04-16 Pending — NORTHSTARMLS as Distributed by MLS Grid
- 2026-04-15 Contingent — NORTHSTARMLS as Distributed by MLS Grid
- 2026-03-13 Price Changed $119,900 NORTHSTARMLS as Distributed by MLS Grid
- 2026-03-03 Price Changed $122,900 NORTHSTARMLS as Distributed by MLS Grid
- 2026-02-23 Listed $124,900 NORTHSTARMLS as Distributed by MLS Grid
Cash-flow waterfall
monthlySold comps — $/sqft
last 12 mo · ≤1 miLoading sold comps…