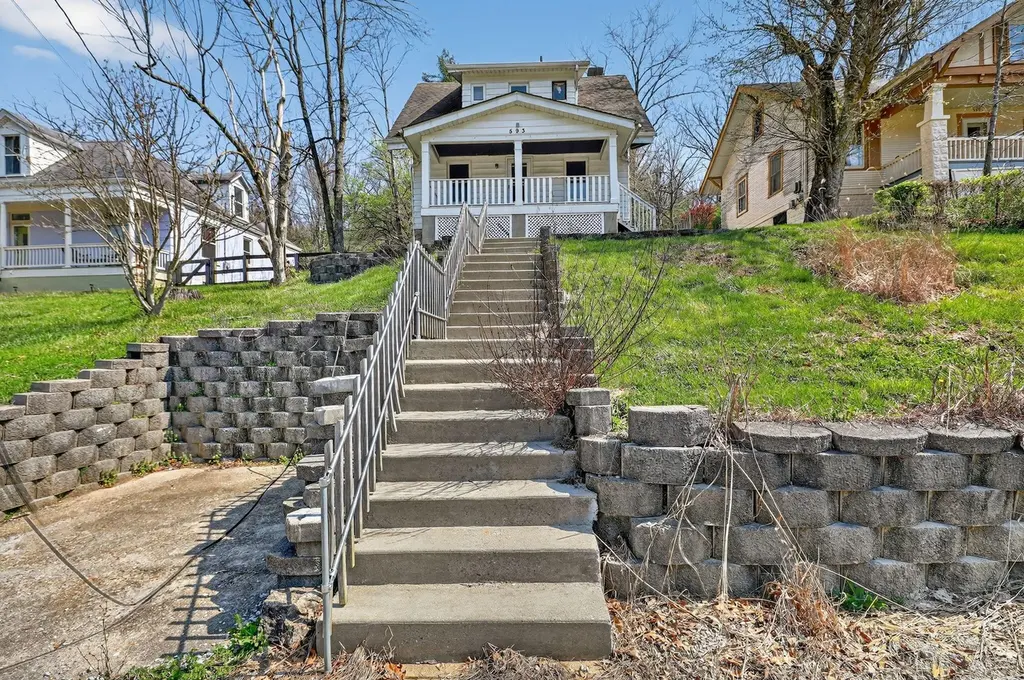
593 Waterworks Rd · Fort Thomas, KY
Flood risk 1/10 · Minimal
- FEMA flood zone
- X (unshaded)
- Chance of flooding over 30 yrs
- 0.0%
- Est. flood insurance / yr
- $507 – $1,088
Fire risk 2/10 · Minimal
- Est. fire insurance / yr
- $839 – $1,559
Heat risk 4/10 · Minor
- Hot days now (above 103°F)
- 7 days/yr
- Hot days in 30 yrs
- 19 days/yr
Wind risk 2/10 · Minimal
- Chance of severe wind over 30 yrs
- 1.0%
Air-quality risk 3/10 · Minor
- Unhealthy air days now
- 2 days/yr
- Unhealthy air days in 30 yrs
- 3 days/yr
Risk factors via First Street. Map © Google.
Why this score? — see what drove the C grade
The composite is a weighted blend of 9 inputs, each scored 0–100. Each bar is that input's sub-score; the figure is the points it added to the 100-point composite (weight × sub-score).
- Cash flow +22.9/30.0
- ARV discount +7.5/15.0
- DSCR +7.4/10.0
- Schools +5.4/10.0
- 1% rule +4.8/10.0
- Livability +4.7/5.0
- Rent growth +4.1/5.0
- Condition / age +2.5/5.0
- Appreciation +0.0/10.0
$169,900
🖨 Deal sheet 📄 Offer letter ✓ Due diligence
Listing remarks MLS
Fort Thomas off the beaten path. Johnson school district. Large 1st floor master w/2 double closets. Natural woodwork. Off street parking. Nice front porch. Home needs some updating and TLC.
Key facts
- Expansive lot
- Easy access to 471
- Full basement
Tags
Property features AI
Exterior
- Parking: Off-street parking
- Utilities: Public water; Public sewer; Natural gas available
- Home design: Single family residence; One and one-half story
- Construction: Built in 1920; Aluminum siding; Block foundation
- Exterior features: Shingle roof; Double-hung windows with wood frames; Sloped lot; Has view
Interior
- Kitchen: Gas range
- Bedrooms: Primary bedroom (14 x 11); Bedroom 2 (14 x 9)
- Bathrooms: 1 full bathroom
- Heating & cooling: Central air; Has heating
- Interior features: Fireplace with insert; Full basement; Has central air
Neighborhood map
What this means for you Summary
Snapshot
- This is a 2-bed/1.0-bath single-family listed at $170k.
Deal economics
- At list price, monthly cash flow is $300 ($4k/yr) — positive.
- The deal already cash-flows at list — no discount required.
- To meet the 1% rule (rent ≥ 1% of price), the offer needs to be $167k (1.6% below list).
- Recommended offer: $167k (1.6% below list) — sets the bar for 1% rule.
- Cap rate 8.4% vs local median 3.4% in Fort Thomas — top-decile yield for the area; either an underpriced asset or a hidden risk that comps aren't pricing in. Stress-test before assuming the spread holds.
Location & tenants
- Location reads 93/100 on livability (#7 in KY, #22 nationally) — a professional / high-income tenant draw. Strengths: crime A+, commute A+, employment A+.
- Fort Thomas Independent (suburban): math 60% / reading 64% proficiency, ranked #2 of 165 in KY (top 1%) — acceptable for families but not a draw, mixed tenant base, ~2y average lease; only 10% free/reduced lunch — higher-income household profile.
- Zoned schools: Johnson Elementary School (math 67% / reading 67%, grade B+, #13 of 676 statewide, top 2%, 425 students, 6% FRL); Highlands Middle School (math 53% / reading 64%, grade B, #4 of 217 statewide, top 2%, 732 students, 11% FRL); Highlands High School (math 62% / reading 57%, grade C+, #4 of 254 statewide, top 1%, 1,015 students, 9% FRL) — zoned schools at 9% FRL track the district average.
- Market conditions: Rents rising fast (+6.5%/yr); 97 active listings in the ZIP; 8 comparable units currently listed for rent nearby; rentals at typical pace (median 24d on market — plan ~3-4 weeks tenant-placement turnaround); solid renter incomes; 247 units permitted in Campbell County in 2024 (77 in 5+ unit buildings).
Forward outlook
- Local home prices are declining (-3.0%/yr); year-one equity from $1k of loan paydown is wiped out by about $5k of value loss. Plan a longer hold.
- At projected returns (-3.0% appreciation + 6.5% rent growth), your $48k cash investment doubles in ~9 years — after that, you're playing with house money.
Negotiation context
- It's been on market 25 days — a 2% lower offer ($167k) is reasonable based on typical stale-listing flexibility.
- 3 sale attempts since 11y ago with the ask held roughly flat each time — persistent listings suggest the price (not the market) is what's stuck; bring a comps-based counter.
Risks & watch-outs
- Watch-outs: built in 1920 — expect roof / HVAC / electrical / plumbing capex.
Questions for the listing agent
- Built in 1920 — when were the roof, HVAC, electrical panel, plumbing, and water heater last replaced?
- Is there a deadline driving the sale (1031 exchange, divorce, estate, relocation)? That informs how much negotiation room exists.
- Schools are A-rated — typically a magnet for longer-tenancy family renters. What's the average tenant stay here, and is there a school-zone premium baked into asking?
- What's the average days-on-market for RENTAL listings here right now (not sales)? A rising rental-DOM trend means longer vacancies and softer asking-rent achievability than the comps imply.
- What's the recent tenant-quality profile in this submarket — average credit score on applications, eviction rate, late-payment / NSF rate, and stable-employment percentage? A property-management company in the area should have these aggregated.
- How much new for-sale + rental construction is in the pipeline within 1–3 miles? Heavy new supply typically softens prices + rents 12–24 months out; constrained supply supports both.
Investment metrics
- 1% rule
- 0.98% ✗
- Cap rate
- 8.41%
- Cash-on-cash
- 7.57%
- DSCR
- 1.34
- GRM
- 8.5
CMA / ARV
- ARV (on-the-fly)
- $343,870
- Comps found
- 12
Show comp detail 12 sales within ~0.75 mi
| Address | Dist | Beds/Ba | Sqft | Sold | Price | $/sf | Match |
|---|---|---|---|---|---|---|---|
| 1430 Waterworks Rd | 0.34mi | 2/2.0 | 1,207 (-4%) | 1mo | $225,000 | $186 | 73 |
| 2135 Memorial Pkwy | 0.64mi | 2/1.0 | 1,249 (-0%) | 0mo | $275,000 | $220 | 69 |
| 319 Rossford Ave | 0.57mi | 3/1.5 (+1) | 1,269 (+1%) | 2mo | $335,000 | $264 | 63 |
| 11 Tower Hill Rd | 0.69mi | 2/2.0 | 1,250 (-0%) | 2mo | $270,000 | $216 | 61 |
| 111 Hartweg Ave | 0.67mi | 2/1.0 | 1,160 (-8%) | 1mo | $318,850 | $275 | 55 |
| 411 Chesapeake Ave | 0.31mi | 3/2.0 (+1) | 1,092 (-13%) | 1mo | $329,900 | $302 | 54 |
| 304 Newman Ave | 0.63mi | 3/1.5 (+1) | 1,299 (+4%) | 7mo | $285,000 | $219 | 52 |
| 115 Water Works Rd | 0.63mi | 2/1.0 | 1,104 (-12%) | 7mo | $260,000 | $236 | 44 |
| 343 Rossford Ave | 0.60mi | 3/2.5 (+1) | 1,344 (+7%) | 10mo | $368,368 | $274 | 41 |
| 402 Rossford Ave | 0.59mi | 3/2.0 (+1) | 1,435 (+14%) | 1mo | $405,000 | $282 | 38 |
| 67 Rossford Ave | 0.67mi | 3/2.0 (+1) | 1,092 (-13%) | 9mo | $299,900 | $275 | 31 |
| 29 Wesley Hills Dr | 0.72mi | 3/3.0 (+1) | 1,432 (+14%) | 10mo | $482,500 | $337 | 22 |
Match score weights: distance 35% · size 25% · config 20% · recency 20%. Top-matched comps best support the ARV.
Projected returns pro-forma
-3.0% appreciation · 6.5% rent growth · sell at horizon
- IRR
- -1.3%
- Equity multiple
- 0.95×
- Total profit
- $-2,396
- Equity at exit
- $25,333
- IRR
- 11.5%
- Equity multiple
- 2.03×
- Total profit
- $49,125
- Equity at exit
- $14,690
Cash invested: $47,572 (down + closing). Projections, not guarantees.
Landlord ↔ Tenant lean methodology
- Overall (STATE)
- 83 Strongly Landlord-Friendly
- State Kentucky
- 83 Strongly Landlord-Friendly · R+16
- County
- — inherits STATE
- City
- — inherits STATE
ZIP-level market 41075
- Rents YoY
- 6.5%
- Active inventory
- 97
- Price-to-rent
- 8.5×
Monthly cashflow live
- Estimated rent
- $1,672 high interval (Pro) →
- Mortgage (P&I)
- −$891
- Tax from tax record
- −$60 /mo · $714/yr
- Insurance
- −$71
- HOA
- −$0
- Vacancy / Maint / Mgmt
- −$351
- Net cashflow
- $300
Break-even live
UW: 25.0% down · 7.5% · 30yr · 1.5% tax · 5.0% vac · 8.0% maint · 8.0% mgmt
Financing live
Cash to close
- Down payment
- $42,475
- Closing costs
- $5,097
- Reserves months
- —
- Total cash needed
- —
Loan-product check · same deal, 3 products live
Conventional
25% down · 7.5% · 30yr
- Down + closing
- —
- Monthly P&I
- —
- Monthly cashflow
- —
- DSCR
- —
- Eligible?
- —
Personal DTI + credit; lowest rate.
DSCR
20% down · 8.5% · 30yr
- Down + closing
- —
- Monthly P&I
- —
- Monthly cashflow
- —
- DSCR
- —
- Eligible?
- —
No personal income docs; deal must DSCR.
Hard money
10% down · 12.0% · 12mo
- Down + closing
- —
- Monthly P&I
- —
- Monthly cashflow
- —
- DSCR
- —
- Eligible?
- —
Short-term bridge; refi at stabilization.
Rent comps 8 comps
| Address | Beds | Baths | Sqft | Rent | $/sqft | DOM | Units | Dist |
|---|---|---|---|---|---|---|---|---|
| 35 Gettysburg Square Rd Fort Thomas, KY | 1.0–2.0 | 1.0 | 800 | $1,630 | $2.04 | 2d | 29 | 0.50mi |
| 40 Edwards Ct Fort Thomas, KY | 2.0 | 1.0 | 1013 | $2,100 | $2.07 | 1d | 1 | 0.95mi |
| 327 Covert Run Pike Unit 1 Bellevue, KY | 2.0 | 2.0 | 1580 | $1,850 | $1.17 | 23d | 1 | 1.03mi |
| 239 Grandview Ave Bellevue, KY | 2.0 | 2.0 | 1093 | $1,645 | $1.50 | 4d | 2 | 1.19mi |
| 929 Boone St Newport, KY | 2.0 | 2.0 | 1458 | $1,495 | $1.03 | 43d | 1 | 1.27mi |
| 1044 Washington Ave #2 Newport, KY | 2.0 | 2.0 | 1250 | $1,800 | $1.44 | 43d | 1 | 1.29mi |
| 3949 Vision CIR Southgate, KY | 1.0–2.0 | 1.0–2.0 | 1132 | $2,515 | $2.22 | 1d | 10 | 1.37mi |
| 814 Washington Ave Unit 2 Newport, KY | 2.0 | 2.0 | 1450 | $1,500 | $1.03 | 23d | 1 | 1.43mi |
Listing history 13 events
-
2026-06-18status $169,900 Active 25 DOM
-
2026-05-05status Pending
-
2026-04-10$169,900 Active
-
2025-12-04status Pending
-
2025-12-04historical
-
2025-10-21price $174,900
-
2025-09-09$184,900 Active
-
2018-01-17soldstatus $399,400
-
2018-01-17soldstatus $86,100
-
2018-01-17soldstatus $399,400
-
2015-09-22soldstatus $59,600
-
2015-09-17soldstatus $59,600 190-char remark
Show marketing remark (190 chars)
Fort Thomas off the beaten path. Johnson school district. Large 1st floor master w/2 double closets. Natural woodwork. Off street parking. Nice front porch. Home needs some updating and TLC.
-
2015-03-26$69,900 190-char remark
Show marketing remark (190 chars)
Fort Thomas off the beaten path. Johnson school district. Large 1st floor master w/2 double closets. Natural woodwork. Off street parking. Nice front porch. Home needs some updating and TLC.
ⓘ Source: listings_history table (triggers on properties + properties_extension) + one-shot
backfill from property_details.listing_events for pre-trigger history.
Tax reassessment forecast KY · Resets to sale price
- Current annual tax
- $714 · $60/mo
- Projected year-2 tax
- $1,461 · $122/mo
- Expected delta
- +$747/yr (+$62/mo · 104.6%)
ⓘ Screening estimate from a state-policy table — verify with the county assessor before closing.
Climate risk First Street
- Flood 1/10 Low FEMA zone X (unshaded) · 0% chance over 30 yrs
- Wildfire 2/10 Low
- Heat 4/10 Moderate 7 d/yr ≥103°F today · 19 d/yr by 30 yrs out
- Wind 2/10 Low 100% chance of damaging wind over 30 yrs
- Air quality 3/10 Moderate 2 unhealthy d/yr today · 3 by 30 yrs out
Nearby sold comps map
Loading sold comps map…
Walkable amenities ~0.75 mi
Loading nearby amenities…
Taxation est. · year 1
- Rental income
- $20,070
- − Mortgage interest
- −$9,517
- − Property taxes
- −$714
- − Insurance
- −$850
- − Repairs & maintenance
- −$1,606
- − Management
- −$1,606
- − Depreciation
- −$4,943
- Taxable income
- $836
- Est. tax owed @ 24.0%
- −$201
- After-tax cash flow
- $3,400/yr
For passive investors: Depreciation is non-cash, so a rental often shows a tax loss while cash-flowing — sheltering income. Rental losses are passive: they offset passive income freely, and up to $25,000/yr can offset ordinary (W-2) income if you actively participate and your MAGI is under $100k (phasing out to $0 by $150k); unused losses carry forward. On sale, claimed depreciation is recaptured at up to 25%, and gains may owe capital-gains tax (a 1031 exchange can defer both). Figures are a year-1 estimate at your 24.0% rate — not tax advice; consult a CPA.
Schools (NCES district)
- District
- Fort Thomas Independent
- NCES district ID
- 2102040
- Math proficiency
- 60% ▼ -10.00%
- Reading proficiency
- 64% ▼ -13.00%
- Median HH income
- $64,528
- Composite
- 54.11/100
- National rank
- #1385
- State rank
- #2 of 165 in KY
Livability — Fort Thomas
- Score
- 93/100
- State rank
- #7
- US rank
- #22
Category grades
Schools grade is shown separately in the Schools card above.
Census & demographics
- Census place
- Fort Thomas, KY
- County
- Campbell County · 84,793 people
- City population
- 17,240
- Metro
- Cincinnati, OH-KY-IN
- Population (ZIP)
- 17,240
- Household income
- $104,875
- Rent vs Own
- Severe rent burden
- 462.0
Population outlook (Campbell County) Hauer SSP2
- Today (2025)
- 95,668 people
- By 2030
- 96,886 · +1.3%
- By 2040
- 97,734 · +2.2%
- By 2050
- 96,413 · +0.8%
- By 2075
- 90,211 · -5.7%
- By 2100
- 79,434 · -17.0%
Race, ethnicity, and origin ACS 2023
- Neighborhood character
- Predominantly White (90%)
- Race & ethnicity
- White 90% Two or more races 5% Hispanic / Latino 3% Black 2%
- Common ancestry
- Slovak 3% Lithuanian 3% Serbian 2%
- Foreign-born
- 3% · Canada
- Languages at home
- 95% English-only · Spanish 2% French/Haitian/Cajun 1%
Political lean MEDSL · Campbell
- 2024 margin
- R (+19.7) · D 39.2% · R 58.9% · Other 1.9%
- 2008→2024 swing
- +1.2pp toward D · 2008: -20.9pp · 2024: -19.7pp
- All cycles
- 2024: R+19.7 2020: R+18.6 2016: R+24.5 2012: R+22.8 2008: R+20.9
Not yet ingested
- Civics
- —
Market trends
- HPI YoY
- ▼ -277.18%
- Current HPI
- 209.5929
- Rent YoY
- ▲ 6.50%
- Metro
- Cincinnati, OH-KY-IN
- State GDP YoY
- ▲ 1.81%
- F500 in state
- 4
Industry mix (Fortune 500 HQ in KY)
| Industry | F500 HQs | Revenue |
|---|---|---|
| Healthcare | 1 | $118B |
|
||
| Food / Beverage | 1 | $7B |
|
||
Price history
+143.1% since first listed12 events — show timeline
- 2026-05-05 Pending — NKMLS
- 2026-04-10 Listed $169,900 NKMLS
- 2025-12-04 Pending — NKMLS
- 2025-12-04 Listing Removed — NKMLS
- 2025-10-21 Price Changed $174,900 NKMLS
- 2025-09-09 Listed $184,900 NKMLS
- 2018-01-17 Sold (Public Records) $399,400 Public Records
- 2018-01-17 Sold (Public Records) $86,100 Public Records
- 2018-01-17 Sold (Public Records) $399,400 Public Records
- 2015-09-22 Sold (Public Records) $59,600 Public Records
- 2015-09-17 Sold (MLS) $59,600 NKMLS
- 2015-03-26 Listed $69,900 NKMLS
Property tax history
+5.7%/yrLatest (2025): $714 · -3.8% YoY. Source: county tax records.
Cash-flow waterfall
monthlySold comps — $/sqft
last 12 mo · ≤1 miLoading sold comps…