153 Fairway Dr · Lake Placid, FL
Flood risk 1/10 · Minimal
- FEMA flood zone
- X (unshaded)
- Chance of flooding over 30 yrs
- 0.0%
- Est. flood insurance / yr
- $507 – $1,088
Fire risk 5/10 · Moderate
- Est. fire insurance / yr
- $947 – $1,759
Heat risk 8/10 · Major
- Hot days now (above 108°F)
- 7 days/yr
- Hot days in 30 yrs
- 27 days/yr
Wind risk 10/10 · Severe
- Chance of severe wind over 30 yrs
- 99.0%
Air-quality risk 2/10 · Minimal
- Unhealthy air days now
- 1 days/yr
- Unhealthy air days in 30 yrs
- 2 days/yr
Risk factors via First Street. Map © Google.
Why this score? — see what drove the D grade
The composite is a weighted blend of 9 inputs, each scored 0–100. Each bar is that input's sub-score; the figure is the points it added to the 100-point composite (weight × sub-score).
- Cash flow +12.3/30.0
- 1% rule +6.0/10.0
- ARV discount +5.9/15.0
- DSCR +3.7/10.0
- Schools +3.6/10.0
- Livability +3.4/5.0
- Rent growth +2.7/5.0
- Condition / age +2.5/5.0
- Appreciation +0.0/10.0
$129,900
🖨 Deal sheet (PDF) 📄 Offer letter ✓ Due diligence
Listing remarks
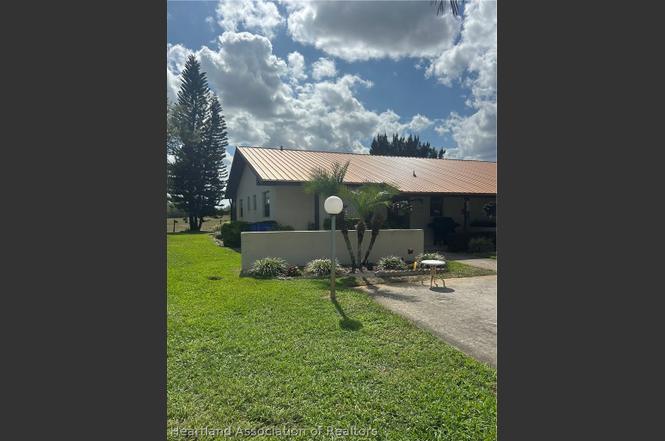
NEW METAL ROOF. Priced right. Adorable 2/2 villa - fully-furnished and priced to sell. From the moment you walk into the home, you see the beautiful view of pasture out back. This is an end unit and is light and bright inside. Some recent updates include remodeled master bathroom and new laminate flooring in entry and both bedrooms. Large screened in porch overlooking pasture land and a small pond to the left. Head out your back door and follow the concrete pathway to the nearby private community heated pool, which includes a covered patio area. Monthly HOA fee of $300 per month includes exterior maintenance, exterior building insurance, trash removal, pool and common areas, lawn and pest c
Key facts
- Gated community park
- Boat ramp
- 2 parking spots
Tags
Property features AI
Finance
- HOA & community: Homeowners association with a $300 monthly fee; Senior community
Exterior
- Parking: 2 parking spaces
- Utilities: Public water; Public sewer; Cable available
- Home design: Single family residence (villa); One level
- Construction: Block and concrete construction; Metal roof
- Exterior features: Front porch; Rear enclosed porch; Paved road access; Community pool available
Interior
- Kitchen: Dishwasher; Microwave; Oven; Range; Refrigerator; Disposal; Electric water heater
- Bedrooms: Total rooms: 9
- Flooring: Carpet; Vinyl
- Bathrooms: 2 full bathrooms
- Heating & cooling: Central heating (electric); Central air conditioning (electric)
- Interior features: Ceiling fans; High-speed internet; Blinds and drapes; Furnished
- Laundry & utility: Washer; Dryer
Neighborhood map
What this means for you Summary
Snapshot
- This is a 2-bed/2.0-bath single-family listed at $130k.
Deal economics
- At list price, monthly cash flow is $-24 ($-282/yr) — negative.
- To cash-flow at today's rent, offer at most $126k (3.2% below list).
- Meets the 1% rule at list price ($1k rent vs $130k).
- Recommended offer: $114k (12.0% below list) — sets the bar for market timing.
- Cap rate 6.1% vs local median 3.8% in Lake Placid — top-decile yield for the area; either an underpriced asset or a hidden risk that comps aren't pricing in. Stress-test before assuming the spread holds.
Location & tenants
- Location reads 68/100 on livability (#525 in FL) — a middle-class / working-renter tenant base. Strengths: crime A+, cost of living A+, health & safety A+; Watch: amenities F, commute F, employment F.
- Highlands (other): math 45% / reading 43% proficiency, ranked #54 of 73 in FL (top 74%) — families likely to look elsewhere, expect single-tenant / working-renter base with shorter leases; 68% free/reduced lunch — lower-income household profile, screen leases tightly.
- Zoned schools: Lake Country Elementary School (math 57% / reading 54%, grade C, #855 of 2,144 statewide, top 41%, 685 students, 73% FRL); Lake Placid Middle School (math 42% / reading 33%, grade F, #395 of 571 statewide, top 70%, 621 students, 75% FRL); Lake Placid High School (math 36% / reading 35%, grade F, #367 of 667 statewide, top 57%, 868 students, 66% FRL) — zoned schools at 71% FRL track the district average.
- Market conditions: Rents flat; 1495 active listings in the ZIP; 980 units permitted in Highlands County in 2024 (80 in 5+ unit buildings).
- This rent runs 32% of the median local income ($54k/yr) — at the standard rent-burdened threshold; future hikes will face affordability resistance.
Forward outlook
- Local home prices are declining (-3.0%/yr); year-one equity from $898 of loan paydown is wiped out by about $4k of value loss. Plan a longer hold.
Negotiation context
- It's been on market 212 days — a 12% lower offer ($114k) is reasonable based on typical stale-listing flexibility.
Risks & watch-outs
- Watch-outs: HOA is 21% of rent.
- Climate carrying-cost: severe wind risk, 99% chance of damaging wind over 30y; moderate wildfire risk; extreme-heat days projected 7→27/yr by 2055 (HVAC capex compounding) — expect insurance premiums to compound above CPI over the hold.
Questions for the listing agent
- What do current leases actually rent for vs. the listed asking? Can we see a recent rent roll and the last 12 months of T-12 income?
- It's been on market 212 days. Have you received any prior offers? Is the seller open to a 12% concession, seller financing, or rate buy-down credit?
- Built in 1979 — when were the roof, HVAC, electrical panel, plumbing, and water heater last replaced?
- What does the HOA fee cover, when was the last increase, and are there any pending special assessments or reserve-fund shortfalls?
- Why hasn't it sold? Are there any deal-killer items the seller is aware of (foundation, flood, title, zoning, code violations)?
- Is there a deadline driving the sale (1031 exchange, divorce, estate, relocation)? That informs how much negotiation room exists.
- Schools are D-rated, which usually means shorter tenancies and higher turnover. Who's the typical renter profile here, and what's been the actual vacancy rate?
- The area grade is low — what's the realistic commute time and amenity access for the typical tenant pool here? Any planned neighborhood developments (good or bad) we should know about?
- What's the average days-on-market for RENTAL listings here right now (not sales)? A rising rental-DOM trend means longer vacancies and softer asking-rent achievability than the comps imply.
- What's the recent tenant-quality profile in this submarket — average credit score on applications, eviction rate, late-payment / NSF rate, and stable-employment percentage? A property-management company in the area should have these aggregated.
- How much new for-sale + rental construction is in the pipeline within 1–3 miles? Heavy new supply typically softens prices + rents 12–24 months out; constrained supply supports both.
Investment metrics
- 1% rule
- 1.10% ✓
- Cap rate
- 6.08%
- Cash-on-cash
- -0.78%
- DSCR
- 0.97
- GRM
- 7.5
CMA / ARV
- ARV (on-the-fly)
- $125,320
- Comps found
- 5
Show comp detail 5 sales within ~0.75 mi
| Address | Dist | Beds/Ba | Sqft | Sold | Price | $/sf | Match |
|---|---|---|---|---|---|---|---|
| 153 Fairway Dr | 0.00mi | 2/2.0 | 964 (0%) | 0mo | $125,000 | $130 | 100 |
| 124 Fairway Dr | 0.11mi | 2/2.0 | 1,045 (+8%) | 10mo | $155,000 | $148 | 72 |
| 229 Harmony Ct | 0.53mi | 2/1.0 | 928 (-4%) | 2mo | $90,000 | $97 | 64 |
| 221 Serenade Dr | 0.49mi | 2/1.0 | 928 (-4%) | 9mo | $100,000 | $108 | 60 |
| 208 Country Dr | 0.53mi | 2/2.0 | 1,050 (+9%) | 16mo | $240,000 | $229 | 47 |
Match score weights: distance 35% · size 25% · config 20% · recency 20%. Top-matched comps best support the ARV.
Projected returns pro-forma
-3.0% appreciation · 0.82% rent growth · sell at horizon
- IRR
- -20.6%
- Equity multiple
- 0.30×
- Total profit
- $-25,447
- Equity at exit
- $19,369
- IRR
- -21.5%
- Equity multiple
- 0.03×
- Total profit
- $-35,452
- Equity at exit
- $11,231
Cash invested: $36,372 (down + closing). Projections, not guarantees.
Landlord ↔ Tenant lean methodology
- Overall (STATE)
- 87 Strongly Landlord-Friendly
- State Florida
- 87 Strongly Landlord-Friendly · R+3
- County
- — inherits STATE
- City
- — inherits STATE
ZIP-level market 33852
- Rents YoY
- 0.8%
- Active inventory
- 1495
- Price-to-rent
- 7.5×
Monthly cashflow live
- Estimated rent
- $1,435 medium interval (Pro) →
- Mortgage (P&I)
- −$681
- Tax from tax record
- −$122 /mo · $1,459/yr
- Insurance
- −$54
- HOA
- −$300
- Vacancy / Maint / Mgmt
- −$301
- Net cashflow
- $-24
Break-even live
Sensitivity live
| Price | -10% $50 | -5% $13 | +0% $-24 | +5% $-60 | +10% $-97 |
|---|---|---|---|---|---|
| Rent | -10% $-137 | -5% $-80 | +0% $-24 | +5% $33 | +10% $90 |
| Rate | -1.0pp $42 | -0.5pp $10 | base $-24 | +0.5pp $-57 | +1.0pp $-91 |
UW: 25.0% down · 7.5% · 30yr · 1.5% tax · 5.0% vac · 8.0% maint · 8.0% mgmt
Financing live
Cash to close
- Down payment
- $32,475
- Closing costs
- $3,897
- Reserves months
- —
- Total cash needed
- —
Loan-product check · same deal, 3 products live
Conventional
25% down · 7.5% · 30yr
- Down + closing
- —
- Monthly P&I
- —
- Monthly cashflow
- —
- DSCR
- —
- Eligible?
- —
Personal DTI + credit; lowest rate.
DSCR
20% down · 8.5% · 30yr
- Down + closing
- —
- Monthly P&I
- —
- Monthly cashflow
- —
- DSCR
- —
- Eligible?
- —
No personal income docs; deal must DSCR.
Hard money
10% down · 12.0% · 12mo
- Down + closing
- —
- Monthly P&I
- —
- Monthly cashflow
- —
- DSCR
- —
- Eligible?
- —
Short-term bridge; refi at stabilization.
HOA detail
- Monthly dues
- $300 · $3,600/yr
- Likely covers
- trashexterior maint.insurancepool
Listing history 12 events
-
2026-06-14statusdays on market $129,900 Pending 212 DOM
-
2026-06-10days on market $129,900 Active Under Contract 211 DOM
-
2026-06-09days on market $129,900 Active Under Contract 210 DOM
-
2026-06-08days on market $129,900 Active Under Contract 209 DOM
-
2026-06-07days on market $129,900 Active Under Contract 208 DOM
-
2026-06-02days on market $129,900 Active Under Contract 203 DOM
-
2026-06-01days on market $129,900 Active Under Contract 202 DOM
-
2026-05-31days on market $129,900 Active Under Contract 201 DOM
-
2026-05-30days on market $129,900 Active Under Contract 200 DOM
-
2026-05-15historical Active Under Contract
-
2026-02-13price $129,900
-
2025-11-11$139,900 Active
ⓘ Source: listings_history table (triggers on properties + properties_extension) + one-shot
backfill from property_details.listing_events for pre-trigger history.
Tax reassessment forecast FL · Resets to sale price
- Current annual tax
- $1,459 · $122/mo
- Projected year-2 tax
- $1,459 · $122/mo
- Expected delta
- $0/yr ($0/mo · 0.0%)
ⓘ Screening estimate from a state-policy table — verify with the county assessor before closing.
Climate risk First Street
- Flood 1/10 Low FEMA zone X (unshaded) · 0% chance over 30 yrs
- Wildfire 5/10 Major
- Heat 8/10 Severe 7 d/yr ≥108°F today · 27 d/yr by 30 yrs out
- Wind 10/10 Extreme 99% chance of damaging wind over 30 yrs
- Air quality 2/10 Low 1 unhealthy d/yr today · 2 by 30 yrs out
Nearby sold comps map
Loading sold comps map…
Walkable amenities ~0.75 mi
Loading nearby amenities…
Taxation est. · year 1
- Rental income
- $17,216
- − Mortgage interest
- −$7,276
- − Property taxes
- −$1,459
- − Insurance
- −$650
- − Repairs & maintenance
- −$1,377
- − Management
- −$1,377
- − HOA
- −$3,600
- − Depreciation
- −$3,779
- Taxable loss
- −$2,302
- Est. tax savings @ 24.0%
- +$553
- After-tax cash flow
- $270/yr
For passive investors: Depreciation is non-cash, so a rental often shows a tax loss while cash-flowing — sheltering income. Rental losses are passive: they offset passive income freely, and up to $25,000/yr can offset ordinary (W-2) income if you actively participate and your MAGI is under $100k (phasing out to $0 by $150k); unused losses carry forward. On sale, claimed depreciation is recaptured at up to 25%, and gains may owe capital-gains tax (a 1031 exchange can defer both). Figures are a year-1 estimate at your 24.0% rate — not tax advice; consult a CPA.
Schools (NCES district)
- District
- Highlands
- NCES district ID
- 1200840
- Math proficiency
- 45% ▼ -7.00%
- Reading proficiency
- 43% ▼ -3.00%
- Median HH income
- $35,276
- Composite
- 36.42/100
- National rank
- #4672
- State rank
- #54 of 73 in FL
Livability — Lake Placid
- Score
- 68/100
- State rank
- #525
- US rank
- #9813
Category grades
Schools grade is shown separately in the Schools card above.
Census & demographics
- County
- Highlands County · 98,898 people
- City population
- 22,600
- Metro
- Sebring-Avon Park, FL
- Population (ZIP)
- 22,600
- Household income
- $54,284
- Rent vs Own
- Severe rent burden
- 439.0
Population outlook (Highlands County) Hauer SSP2
- Today (2025)
- 99,674 people
- By 2030
- 99,615 · -0.1%
- By 2040
- 99,342 · -0.3%
- By 2050
- 98,242 · -1.4%
- By 2075
- 93,291 · -6.4%
- By 2100
- 79,894 · -19.8%
Race, ethnicity, and origin ACS 2023
- Neighborhood character
- Predominantly White (68%)
- Race & ethnicity
- White 68% Hispanic / Latino 22% Two or more races 11% Black 6% Asian 1%
- Hispanic origin (detail)
- Mexican 11% Puerto Rican 3% Cuban 3%
- Common ancestry
- Lithuanian 2% Slovak 2% Iranian 1%
- Foreign-born
- 14% · Canada, Dominican Republic
- Languages at home
- 79% English-only · Spanish 19% Tagalog/Filipino 1%
Political lean MEDSL · Highlands
- 2024 margin
- Solid R (+40.8) · D 29.3% · R 70.1%
- 2008→2024 swing
- -22.7pp toward R · 2008: -18.1pp · 2024: -40.8pp
- All cycles
- 2024: R+40.8 2020: R+34.4 2016: R+32.0 2012: R+23.0 2008: R+18.1
Not yet ingested
- Civics
- —
Market trends
- HPI YoY
- ▼ -203.31%
- Current HPI
- 224.8693
- Rent YoY
- ▲ 0.82%
- Metro
- Sebring-Avon Park, FL
- State GDP YoY
- ▲ 3.28%
- F500 in state
- 36
Industry mix (Fortune 500 HQ in FL)
| Industry | F500 HQs | Revenue |
|---|---|---|
| Industrial Technology | 2 | $29B |
|
||
| Insurance | 2 | $17B |
|
||
| Retail | 1 | $60B |
|
||
| Technology Distribution | 1 | $58B |
|
||
| Homebuilding | 1 | $35B |
|
||
| Technology Manufacturing | 1 | $35B |
|
||
Price history
-7.1% since first listed3 events — show timeline
- 2026-05-15 Contingent — HAOR as distributed by MLS GRID
- 2026-02-13 Price Changed $129,900 HAOR as distributed by MLS GRID
- 2025-11-11 Listed $139,900 HAOR as distributed by MLS GRID
Property tax history
+8.3%/yrLatest (2025): $1,459 · +5.8% YoY. Source: county tax records.
Cash-flow waterfall
monthlySold comps — $/sqft
last 12 mo · ≤1 miLoading sold comps…