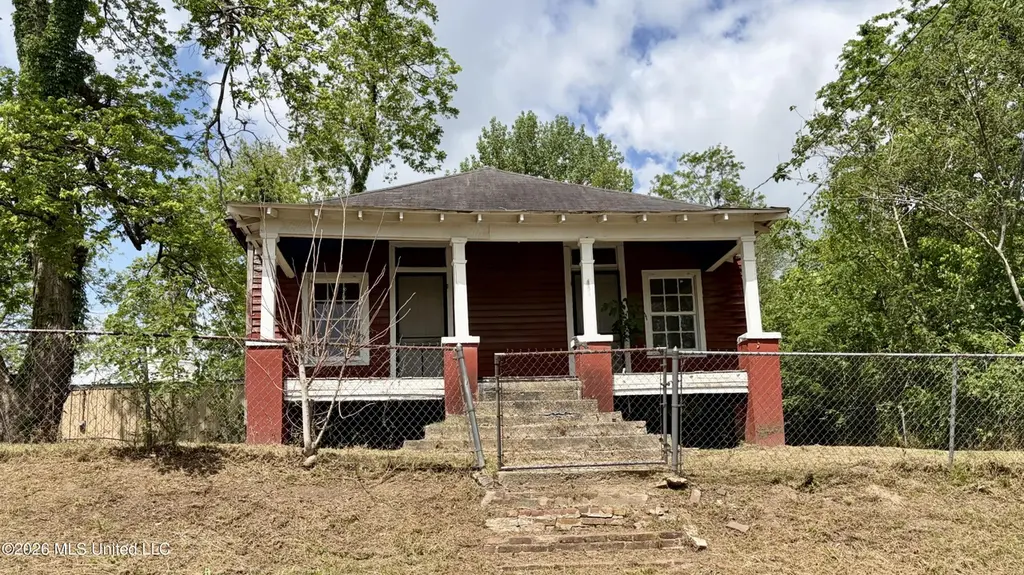
410 Farmer St · Port Gibson, MS
Flood risk 5/10 · Moderate
- FEMA flood zone
- X (shaded)
- Chance of flooding over 30 yrs
- 0.24%
- Est. flood insurance / yr
- $507 – $1,088
Fire risk 4/10 · Minor
- Est. fire insurance / yr
- $1,241 – $2,305
Heat risk 8/10 · Major
- Hot days now (above 109°F)
- 7 days/yr
- Hot days in 30 yrs
- 20 days/yr
Wind risk 8/10 · Major
- Chance of severe wind over 30 yrs
- 80.0%
Air-quality risk 1/10 · Minimal
- Unhealthy air days now
- 0 days/yr
- Unhealthy air days in 30 yrs
- 0 days/yr
Risk factors via First Street. Map © Google.
Why this score? — see what drove the B+ grade
The composite is a weighted blend of 9 inputs, each scored 0–100. Each bar is that input's sub-score; the figure is the points it added to the 100-point composite (weight × sub-score).
- Cash flow +30.0/30.0
- ARV discount +10.4/15.0
- 1% rule +10.0/10.0
- DSCR +10.0/10.0
- Appreciation +5.7/10.0
- Livability +3.2/5.0
- Rent growth +2.5/5.0
- Condition / age +2.5/5.0
- Schools +0.7/10.0
$40,000
🖨 Deal sheet 📄 Offer letter ✓ Due diligence
Listing remarks
Located near historic downtown Port Gibson with convenient access to Highway 61, 410 Farmer Street offers a unique opportunity for redevelopment or restoration. The property includes two lots and sits between the residential side of Farmer Street and the commercial corridor along Orange Street, creating potential for residential or possible commercial use subject to zoning and buyer verification. The home was built in 1930 and is being sold strictly as-is. The seller will make no repairs. The property is in need of substantial renovation and will likely be best suited for an investor, developer, or buyer looking to build or restore a long-term home in the City of Port Gibson. Buyer to verif
Key facts
- 9,147 sq ft lot
- Built 1930
- Listed 42 days
Property features AI
Finance
- Other: Property condition: fixer; Lot zoning: Neighborhood Commercial District
Exterior
- Parking: On-site parking
- Utilities: Water: see remarks; Sewer: see remarks; Utilities: see remarks
- Home design: Single-family house; One level
- Construction: Architectural shingle roof; Concrete perimeter foundation; Built (year source: assessor)
- Exterior features: Front yard; Rectangular lot; Chain link fencing
Interior
- Kitchen: Kitchen on main level
- Bedrooms: Main level bedroom; Main level bedroom
- Bathrooms: 1 full bathroom (main level)
- Heating & cooling: Heating: see remarks; Cooling: see remarks
- Interior features: 5 total rooms; Crawl space basement
Neighborhood map
What this means for you Summary
Snapshot
- This is a 2-bed/1.0-bath single-family listed at $40k.
Deal economics
- At list price, monthly cash flow is $469 ($6k/yr) — positive.
- The deal already cash-flows at list — no discount required.
- Meets the 1% rule at list price ($923 rent vs $40k).
- Recommended offer: $39k (3.0% below list) — sets the bar for market timing.
Location & tenants
- Location reads 65/100 on livability (#121 in MS) — a middle-class / working-renter tenant base. Strengths: crime A+, cost of living A+, housing A-; Watch: schools F, amenities F, commute F.
- Claiborne County School District (rural): math 7% / reading 13% proficiency, ranked #119 of 130 in MS (top 92%) — low school quality limits family demand, transient renter base, plan for 1-2y turnover; 98% free/reduced lunch — lower-income household profile, screen leases tightly.
- Market conditions: 22 active listings in the ZIP.
Forward outlook
- In year one you build about $818 of equity ($277 loan paydown + $541 appreciation (1.4% local appreciation)).
- Claiborne County population projected at -18% by 2050 — secular population decline; favor cash flow + early exit over multi-decade hold.
- At projected returns (1.4% appreciation + 3.0% rent growth), your $11k cash investment doubles in ~2 years — after that, you're playing with house money.
Negotiation context
- It's been on market 43 days — a 3% lower offer ($39k) is reasonable based on typical stale-listing flexibility.
Risks & watch-outs
- Watch-outs: built in 1930 — expect roof / HVAC / electrical / plumbing capex.
- Climate carrying-cost: moderate flood risk; severe wind risk, 80% chance of damaging wind over 30y; extreme-heat days projected 7→20/yr by 2055 (HVAC capex compounding) — expect insurance premiums to compound above CPI over the hold.
Questions for the listing agent
- It's been on market 43 days. Have you received any prior offers? Is the seller open to a 3% concession, seller financing, or rate buy-down credit?
- Built in 1930 — when were the roof, HVAC, electrical panel, plumbing, and water heater last replaced?
- Is there a deadline driving the sale (1031 exchange, divorce, estate, relocation)? That informs how much negotiation room exists.
- Schools are F-rated, which usually means shorter tenancies and higher turnover. Who's the typical renter profile here, and what's been the actual vacancy rate?
- What's the average days-on-market for RENTAL listings here right now (not sales)? A rising rental-DOM trend means longer vacancies and softer asking-rent achievability than the comps imply.
- What's the recent tenant-quality profile in this submarket — average credit score on applications, eviction rate, late-payment / NSF rate, and stable-employment percentage? A property-management company in the area should have these aggregated.
- How much new for-sale + rental construction is in the pipeline within 1–3 miles? Heavy new supply typically softens prices + rents 12–24 months out; constrained supply supports both.
Investment metrics
- 1% rule
- 2.31% ✓
- Cap rate
- 20.35%
- Cash-on-cash
- 50.21%
- DSCR
- 3.23
- GRM
- 3.6
CMA / ARV
- ARV (median comp)
- $42,709
- List price
- $40,000
- Delta
- -6.34%
- Verdict
- FAIR
- Comps
- 2 within 1.0 mi
Projected returns pro-forma
1.35% appreciation · 3.0% rent growth · sell at horizon
- IRR
- 53.3%
- Equity multiple
- 3.79×
- Total profit
- $31,292
- Equity at exit
- $14,392
- IRR
- 54.5%
- Equity multiple
- 7.61×
- Total profit
- $74,077
- Equity at exit
- $19,709
Cash invested: $11,200 (down + closing). Projections, not guarantees.
Landlord ↔ Tenant lean methodology
- Overall (STATE)
- 90 Strongly Landlord-Friendly
- State Mississippi
- 90 Strongly Landlord-Friendly · R+11
- County
- — inherits STATE
- City
- — inherits STATE
ZIP-level market 39150
- Home prices YoY
- 1.9%
- Active inventory
- 22
- Price-to-rent
- 3.6×
Monthly cashflow live
- Estimated rent
- $923 medium interval (Pro) →
- Mortgage (P&I)
- −$210
- Tax from tax record
- −$34 /mo · $411/yr
- Insurance
- −$17
- HOA
- −$0
- Vacancy / Maint / Mgmt
- −$194
- Net cashflow
- $469
Break-even live
UW: 25.0% down · 7.5% · 30yr · 1.5% tax · 5.0% vac · 8.0% maint · 8.0% mgmt
Financing live
Cash to close
- Down payment
- $10,000
- Closing costs
- $1,200
- Reserves months
- —
- Total cash needed
- —
Loan-product check · same deal, 3 products live
Conventional
25% down · 7.5% · 30yr
- Down + closing
- —
- Monthly P&I
- —
- Monthly cashflow
- —
- DSCR
- —
- Eligible?
- —
Personal DTI + credit; lowest rate.
DSCR
20% down · 8.5% · 30yr
- Down + closing
- —
- Monthly P&I
- —
- Monthly cashflow
- —
- DSCR
- —
- Eligible?
- —
No personal income docs; deal must DSCR.
Hard money
10% down · 12.0% · 12mo
- Down + closing
- —
- Monthly P&I
- —
- Monthly cashflow
- —
- DSCR
- —
- Eligible?
- —
Short-term bridge; refi at stabilization.
Listing history 17 events
-
2026-06-19days on market $40,000 Active 43 DOM
-
2026-06-18days on market $40,000 Active 42 DOM
-
2026-06-17days on market $40,000 Active 41 DOM
-
2026-06-16days on market $40,000 Active 40 DOM
-
2026-06-15days on market $40,000 Active 39 DOM
-
2026-06-14days on market $40,000 Active 37 DOM
-
2026-06-12days on market $40,000 Active 36 DOM
-
2026-06-09days on market $40,000 Active 33 DOM
-
2026-06-08days on market $40,000 Active 32 DOM
-
2026-06-07days on market $40,000 Active 31 DOM
-
2026-06-05days on market $40,000 Active 28 DOM
-
2026-06-03days on market $40,000 Active 27 DOM
-
2026-06-02days on market $40,000 Active 26 DOM
-
2026-06-01days on market $40,000 Active 25 DOM
-
2026-05-31days on market $40,000 Active 24 DOM
-
2026-05-30days on market $40,000 Active 23 DOM
-
2026-05-05$40,000 Active 784-char remark
ⓘ Source: listings_history table (triggers on properties + properties_extension) + one-shot
backfill from property_details.listing_events for pre-trigger history.
Tax reassessment forecast MS · Resets to sale price
- Current annual tax
- $411 · $34/mo
- Projected year-2 tax
- $411 · $34/mo
- Expected delta
- $0/yr ($0/mo · 0.0%)
ⓘ Screening estimate from a state-policy table — verify with the county assessor before closing.
Climate risk First Street
- Flood 5/10 Major FEMA zone X (shaded) · 24% chance over 30 yrs
- Wildfire 4/10 Moderate
- Heat 8/10 Severe 7 d/yr ≥109°F today · 20 d/yr by 30 yrs out
- Wind 8/10 Severe 80% chance of damaging wind over 30 yrs
- Air quality 1/10 Low 0 unhealthy d/yr today · 0 by 30 yrs out
Nearby sold comps map
Loading sold comps map…
Walkable amenities ~0.75 mi
Loading nearby amenities…
Taxation est. · year 1
- Rental income
- $11,078
- − Mortgage interest
- −$2,241
- − Property taxes
- −$411
- − Insurance
- −$200
- − Repairs & maintenance
- −$886
- − Management
- −$886
- − Depreciation
- −$1,164
- Taxable income
- $5,290
- Est. tax owed @ 24.0%
- −$1,270
- After-tax cash flow
- $4,354/yr
For passive investors: Depreciation is non-cash, so a rental often shows a tax loss while cash-flowing — sheltering income. Rental losses are passive: they offset passive income freely, and up to $25,000/yr can offset ordinary (W-2) income if you actively participate and your MAGI is under $100k (phasing out to $0 by $150k); unused losses carry forward. On sale, claimed depreciation is recaptured at up to 25%, and gains may owe capital-gains tax (a 1031 exchange can defer both). Figures are a year-1 estimate at your 24.0% rate — not tax advice; consult a CPA.
Schools (NCES district)
- District
- Claiborne County School District
- NCES district ID
- 2801020
- Math proficiency
- 7% ▼ -22.00%
- Reading proficiency
- 13% ▼ -7.00%
- Median HH income
- $25,274
- Composite
- 7.24/100
- National rank
- #9959
- State rank
- #119 of 130 in MS
Livability — Port Gibson
- Score
- 65/100
- State rank
- #121
- US rank
- #13508
Category grades
Schools grade is shown separately in the Schools card above.
Census & demographics
- Census place
- Port Gibson, MS
- Population (ZIP)
- 5,094
Population outlook (Claiborne County) Hauer SSP2
- Today (2025)
- 8,631 people
- By 2030
- 8,271 · -4.2%
- By 2040
- 7,570 · -12.3%
- By 2050
- 7,065 · -18.1%
- By 2075
- 6,329 · -26.7%
- By 2100
- 5,655 · -34.5%
Race, ethnicity, and origin ACS 2023
- Neighborhood character
- Predominantly Black (84%)
- Race & ethnicity
- Black 84% White 13% Two or more races 3%
- Common ancestry
- Slovak 1%
- Foreign-born
- 0%
Political lean MEDSL · Claiborne
- 2024 margin
- Solid D (+67.5) · D 83.3% · R 15.8%
- 2008→2024 swing
- -4.6pp toward R · 2008: 72.1pp · 2024: 67.5pp
- All cycles
- 2024: D+67.5 2020: D+71.2 2016: D+71.4 2012: D+76.5 2008: D+72.1
Not yet ingested
- Civics
- —
Market trends
- HPI YoY
- ▲ 1.35%
- Current HPI
- 71.3734
- Rent YoY
- —
- Metro
- —
- State GDP YoY
- —
- F500 in state
- 0
Price history
1 event — show timeline
- 2026-05-05 Listed $40,000 MLSU
Property tax history
+1.1%/yrLatest (2025): $411 · +0.0% YoY. Source: county tax records.
Cash-flow waterfall
monthlySold comps — $/sqft
last 12 mo · ≤1 miLoading sold comps…