150 Higgs Rd · Caneyville, KY
Flood risk 1/10 · Minimal
- FEMA flood zone
- X (unshaded)
- Chance of flooding over 30 yrs
- 0.0%
- Est. flood insurance / yr
- $507 – $1,088
Fire risk 3/10 · Minor
- Est. fire insurance / yr
- $839 – $1,559
Heat risk 5/10 · Moderate
- Hot days now (above 107°F)
- 7 days/yr
- Hot days in 30 yrs
- 21 days/yr
Wind risk 3/10 · Minor
- Chance of severe wind over 30 yrs
- 7.0%
Air-quality risk 2/10 · Minimal
- Unhealthy air days now
- 0 days/yr
- Unhealthy air days in 30 yrs
- 1 days/yr
Risk factors via First Street. Map © Google.
Why this score? — see what drove the D grade
The composite is a weighted blend of 9 inputs, each scored 0–100. Each bar is that input's sub-score; the figure is the points it added to the 100-point composite (weight × sub-score).
- Cash flow +15.0/30.0
- ARV discount +7.5/15.0
- DSCR +4.6/10.0
- Livability +3.4/5.0
- 1% rule +3.0/10.0
- Schools +2.8/10.0
- Rent growth +2.5/5.0
- Condition / age +2.5/5.0
- Appreciation +0.0/10.0
$144,000
🖨 Deal sheet (PDF) 📄 Offer letter ✓ Due diligence
Listing remarks
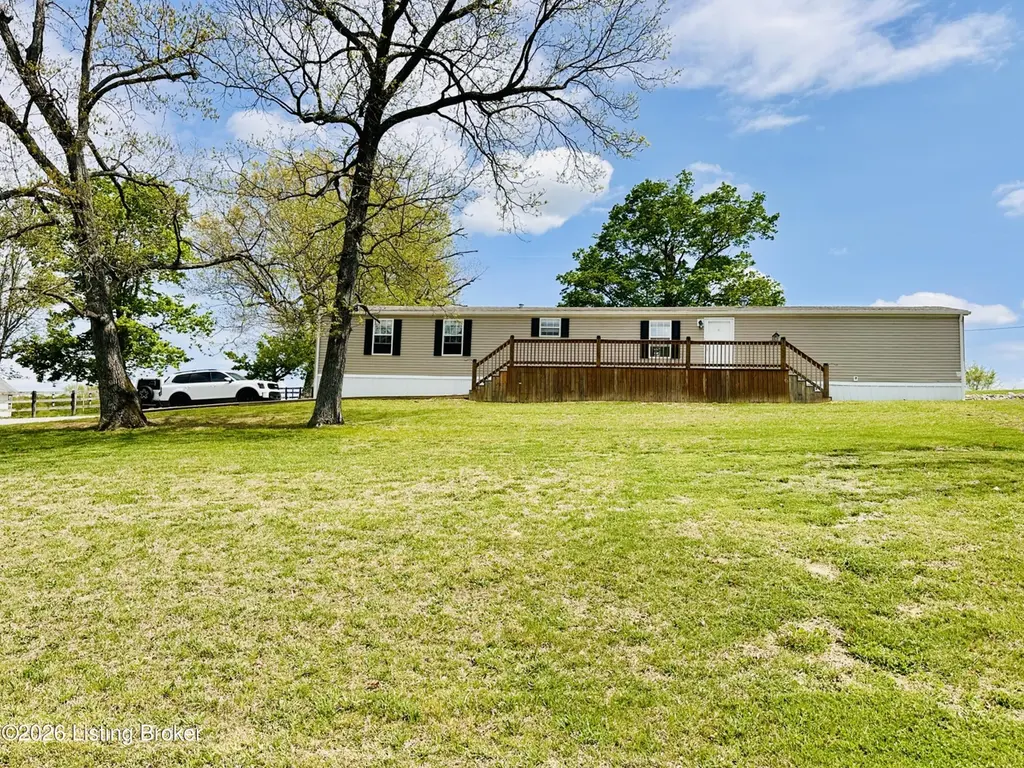
Welcome to peaceful country living at 150 Higgs Rd in Caneyville! This beautifully remodeled 3 bedroom, 2 bath mobile home offers 1,216 +/- sq ft of comfortable living space and is situated on approximately 0.83 +/- acres, providing the perfect blend of comfort, style, and scenic surroundings. Step inside to an immaculate interior featuring numerous updates, including new flooring, kitchen cabinets, countertops, vanities, and updated lighting throughout. The spacious kitchen boasts tons of cabinetry along with a convenient island, making it ideal for both everyday living and entertaining. Outside, you'll fall in love with the serene rural setting. The home sits on a hill, providing beautifu
Key facts
- Immaculate interior
- New flooring
- Spacious kitchen
Tags
Property features AI
Finance
- Other: Approximate living area reported as 1,216 (source: listing agent); Lot size about 0.83 acres
- HOA & community: No association fee
Exterior
- Parking: Driveway
- Utilities: Electricity connected; Electric heating; Central air conditioning
- Home design: Residential property; One story; Built in 2014; Other architectural style
- Construction: Vinyl siding; Shingle roof; Built in 2014
- Exterior features: Irregular lot; No fencing
Interior
- Kitchen: Kitchen located on the first floor
- Bedrooms: 3 bedrooms total, all on the first floor; Primary bedroom on the first floor
- Bathrooms: 2 full bathrooms, including primary full bathroom on the first floor
- Interior features: 5 total rooms; 3 closets; No basement; First-floor laundry
- Laundry & utility: Laundry on the first floor
Neighborhood map
What this means for you Summary
Snapshot
- This is a 3-bed/2.0-bath manufactured listed at $144k.
Deal economics
- At list price, monthly cash flow is $45 ($535/yr) — positive.
- The deal already cash-flows at list — no discount required.
- To meet the 1% rule (rent ≥ 1% of price), the offer needs to be $115k (20.2% below list).
- Recommended offer: $115k (20.2% below list) — sets the bar for 1% rule.
- Cap rate 6.7% vs local median 2.1% in Caneyville — top-decile yield for the area; either an underpriced asset or a hidden risk that comps aren't pricing in. Stress-test before assuming the spread holds.
Location & tenants
- Location reads 68/100 on livability (#182 in KY) — a middle-class / working-renter tenant base. Strengths: crime A+, cost of living A+, housing A+; Watch: amenities F, commute F, employment F.
- Grayson County (rural): math 27% / reading 40% proficiency, ranked #84 of 165 in KY (top 51%) — families likely to look elsewhere, expect single-tenant / working-renter base with shorter leases.
- Zoned schools: Caneyville Elementary School (math 27% / reading 37%, grade F, #348 of 676 statewide, top 55%, 390 students, 71% FRL); Grayson County Middle School (math 23% / reading 38%, grade F, #143 of 217 statewide, top 67%, 839 students, 63% FRL); Grayson County High School (math 24% / reading 38%, grade F, #118 of 254 statewide, top 47%, 1,252 students, 61% FRL).
- Market conditions: 27 active listings in the ZIP; 23 units permitted in Grayson County in 2024 (12 in 5+ unit buildings).
Forward outlook
- Local home prices are declining (-3.0%/yr); year-one equity from $996 of loan paydown is wiped out by about $4k of value loss. Plan a longer hold.
Negotiation context
- It's been on market 54 days — a 3% lower offer ($140k) is reasonable based on typical stale-listing flexibility.
- Current owner paid $55k; list at $144k implies a 162% gain — meaningful room to come down on a strong offer.
Risks & watch-outs
- Climate carrying-cost: extreme-heat days projected 7→21/yr by 2055 (HVAC capex compounding) — expect insurance premiums to compound above CPI over the hold.
Questions for the listing agent
- It's been on market 54 days. Have you received any prior offers? Is the seller open to a 20% concession, seller financing, or rate buy-down credit?
- Is there a deadline driving the sale (1031 exchange, divorce, estate, relocation)? That informs how much negotiation room exists.
- Schools are D-rated, which usually means shorter tenancies and higher turnover. Who's the typical renter profile here, and what's been the actual vacancy rate?
- The area grade is low — what's the realistic commute time and amenity access for the typical tenant pool here? Any planned neighborhood developments (good or bad) we should know about?
- What's the average days-on-market for RENTAL listings here right now (not sales)? A rising rental-DOM trend means longer vacancies and softer asking-rent achievability than the comps imply.
- What's the recent tenant-quality profile in this submarket — average credit score on applications, eviction rate, late-payment / NSF rate, and stable-employment percentage? A property-management company in the area should have these aggregated.
- How much new for-sale + rental construction is in the pipeline within 1–3 miles? Heavy new supply typically softens prices + rents 12–24 months out; constrained supply supports both.
Investment metrics
- 1% rule
- 0.80% ✗
- Cap rate
- 6.66%
- Cash-on-cash
- 1.33%
- DSCR
- 1.06
- GRM
- 10.4
CMA / ARV
No comps found within radius.
Projected returns pro-forma
-3.0% appreciation · 3.0% rent growth · sell at horizon
- IRR
- -14.2%
- Equity multiple
- 0.49×
- Total profit
- $-20,558
- Equity at exit
- $21,471
- IRR
- -5.6%
- Equity multiple
- 0.64×
- Total profit
- $-14,503
- Equity at exit
- $12,450
Cash invested: $40,320 (down + closing). Projections, not guarantees.
Landlord ↔ Tenant lean methodology
- Overall (STATE)
- 83 Strongly Landlord-Friendly
- State Kentucky
- 83 Strongly Landlord-Friendly · R+16
- County
- — inherits STATE
- City
- — inherits STATE
ZIP-level market 42721
- Home prices YoY
- -3.9%
- Active inventory
- 27
- Price-to-rent
- 10.4×
Monthly cashflow live
- Estimated rent
- $1,149 medium interval (Pro) →
- Mortgage (P&I)
- −$755
- Tax from tax record
- −$48 /mo · $578/yr
- Insurance
- −$60
- HOA
- −$0
- Vacancy / Maint / Mgmt
- −$241
- Net cashflow
- $45
Break-even live
Sensitivity live
| Price | -10% $126 | -5% $85 | +0% $45 | +5% $4 | +10% $-37 |
|---|---|---|---|---|---|
| Rent | -10% $-46 | -5% $-1 | +0% $45 | +5% $90 | +10% $135 |
| Rate | -1.0pp $117 | -0.5pp $81 | base $45 | +0.5pp $7 | +1.0pp $-31 |
UW: 25.0% down · 7.5% · 30yr · 1.5% tax · 5.0% vac · 8.0% maint · 8.0% mgmt
Financing live
Cash to close
- Down payment
- $36,000
- Closing costs
- $4,320
- Reserves months
- —
- Total cash needed
- —
Loan-product check · same deal, 3 products live
Conventional
25% down · 7.5% · 30yr
- Down + closing
- —
- Monthly P&I
- —
- Monthly cashflow
- —
- DSCR
- —
- Eligible?
- —
Personal DTI + credit; lowest rate.
DSCR
20% down · 8.5% · 30yr
- Down + closing
- —
- Monthly P&I
- —
- Monthly cashflow
- —
- DSCR
- —
- Eligible?
- —
No personal income docs; deal must DSCR.
Hard money
10% down · 12.0% · 12mo
- Down + closing
- —
- Monthly P&I
- —
- Monthly cashflow
- —
- DSCR
- —
- Eligible?
- —
Short-term bridge; refi at stabilization.
Listing history 20 events
-
2026-06-21days on market $144,000 Active 54 DOM
-
2026-06-21days on market $144,000 Active 53 DOM
-
2026-06-18days on market $144,000 Active 51 DOM
-
2026-06-17days on market $144,000 Active 50 DOM
-
2026-06-16days on market $144,000 Active 49 DOM
-
2026-06-15days on market $144,000 Active 48 DOM
-
2026-06-13days on market $144,000 Active 46 DOM
-
2026-06-12days on market $144,000 Active 45 DOM
-
2026-06-09days on market $144,000 Active 42 DOM
-
2026-06-08days on market $144,000 Active 41 DOM
-
2026-06-07days on market $144,000 Active 40 DOM
-
2026-06-07pricedays on market $144,000 Active 39 DOM
-
2026-06-04days on market $154,000 Active 36 DOM
-
2026-06-02days on market $154,000 Active 35 DOM
-
2026-06-01days on market $154,000 Active 34 DOM
-
2026-05-31days on market $154,000 Active 33 DOM
-
2026-05-31days on market $154,000 Active 32 DOM
-
2026-05-21price $154,000
-
2026-04-25$159,000 Active
-
2021-07-30soldstatus $55,000
ⓘ Source: listings_history table (triggers on properties + properties_extension) + one-shot
backfill from property_details.listing_events for pre-trigger history.
Tax reassessment forecast KY · Resets to sale price
- Current annual tax
- $578 · $48/mo
- Projected year-2 tax
- $1,238 · $103/mo
- Expected delta
- +$661/yr (+$55/mo · 114.3%)
ⓘ Screening estimate from a state-policy table — verify with the county assessor before closing.
Climate risk First Street
- Flood 1/10 Low FEMA zone X (unshaded) · 0% chance over 30 yrs
- Wildfire 3/10 Moderate
- Heat 5/10 Major 7 d/yr ≥107°F today · 21 d/yr by 30 yrs out
- Wind 3/10 Moderate 7% chance of damaging wind over 30 yrs
- Air quality 2/10 Low 0 unhealthy d/yr today · 1 by 30 yrs out
Nearby sold comps map
Loading sold comps map…
Walkable amenities ~0.75 mi
Loading nearby amenities…
Taxation est. · year 1
- Rental income
- $13,791
- − Mortgage interest
- −$8,066
- − Property taxes
- −$578
- − Insurance
- −$720
- − Repairs & maintenance
- −$1,103
- − Management
- −$1,103
- − Depreciation
- −$4,189
- Taxable loss
- −$1,969
- Est. tax savings @ 24.0%
- +$473
- After-tax cash flow
- $1,008/yr
For passive investors: Depreciation is non-cash, so a rental often shows a tax loss while cash-flowing — sheltering income. Rental losses are passive: they offset passive income freely, and up to $25,000/yr can offset ordinary (W-2) income if you actively participate and your MAGI is under $100k (phasing out to $0 by $150k); unused losses carry forward. On sale, claimed depreciation is recaptured at up to 25%, and gains may owe capital-gains tax (a 1031 exchange can defer both). Figures are a year-1 estimate at your 24.0% rate — not tax advice; consult a CPA.
Schools (NCES district)
- District
- Grayson County
- NCES district ID
- 2102300
- Math proficiency
- 27% ▼ -23.00%
- Reading proficiency
- 40% ▼ -17.00%
- Median HH income
- $34,256
- Composite
- 27.55/100
- National rank
- #6944
- State rank
- #84 of 165 in KY
Livability — Caneyville
- Score
- 68/100
- State rank
- #182
- US rank
- #9075
Category grades
Schools grade is shown separately in the Schools card above.
Census & demographics
- City population
- 4,302
- Population (ZIP)
- 4,302
Population outlook (Grayson County) Hauer SSP2
- Today (2025)
- 26,840 people
- By 2030
- 27,032 · +0.7%
- By 2040
- 27,236 · +1.5%
- By 2050
- 27,076 · +0.9%
- By 2075
- 26,565 · -1.0%
- By 2100
- 24,007 · -10.6%
Race, ethnicity, and origin ACS 2023
- Neighborhood character
- Predominantly White (97%)
- Race & ethnicity
- White 97% Two or more races 1% Hispanic / Latino 1%
- Common ancestry
- Slovak 3% Italian 1%
- Foreign-born
- 1% · Canada
- Languages at home
- 96% English-only · German/W. Germanic 4%
Political lean MEDSL · Grayson
- 2024 margin
- Solid R (+61.8) · D 18.5% · R 80.3% · Other 1.2%
- 2008→2024 swing
- -26.9pp toward R · 2008: -34.9pp · 2024: -61.8pp
- All cycles
- 2024: R+61.8 2020: R+58.8 2016: R+59.3 2012: R+39.5 2008: R+34.9
Not yet ingested
- Civics
- —
Market trends
- HPI YoY
- ▼ -13.73%
- Current HPI
- 337.3074
- Rent YoY
- —
- Metro
- —
- State GDP YoY
- ▲ 1.81%
- F500 in state
- 4
Industry mix (Fortune 500 HQ in KY)
| Industry | F500 HQs | Revenue |
|---|---|---|
| Healthcare | 1 | $118B |
|
||
| Food / Beverage | 1 | $7B |
|
||
Price history
+180.0% since first listed3 events — show timeline
- 2026-05-21 Price Changed $154,000 Metro Search MLS
- 2026-04-25 Listed $159,000 Metro Search MLS
- 2021-07-30 Sold (Public Records) $55,000 Public Records
Property tax history
+10.9%/yrLatest (2025): $578 · -0.6% YoY. Source: county tax records.
Cash-flow waterfall
monthlySold comps — $/sqft
last 12 mo · ≤1 miLoading sold comps…